Stocks & Equities

Important: The Dow/Gold Breakout …

For a couple of years now I’ve maintained my view that the Dow Industrials and broad U.S. equity markets were entering a new bull market. One of the tools I used to come to that conclusion back in 2008 was the ratio of the Dow Industrials to the price of gold.

I wrote extensively about it in my July 2008 issue of Real Wealth Report. I also reported on it several times in other pieces I wrote. Today, I want to update the analysis for you.

First some background. At the peak of the ratio in the year 2000, the Dow Industrials would have purchased just over 51 ounces of gold. That’s because the Dow was at a high in real, inflation-adjusted terms, while gold was at its bottom at the $255 to $275 level.

During the financial crisis of 2007 – 2009, as equities plunged and gold rallied (since its bottom in 2000) the ratio collapsed all the way down to the 6 to 7 level.

In other words, in terms of gold — what I like to call “honest money” — the Dow Industrials had lost more than 87 percent of the entire equity bull market from 1980 to 1999.

chart1s

In my Real Wealth Report issue of July 2008, I called for the bottom in the ratio to come in around the 5 to 6 level.

It bottomed slightly above that level, then retested it with a slightly lower low in September 2011.

Since then, stocks have vastly outperformed gold.

As a result, the ratio of the Dow Industrials to gold has widened back out, and has broken out of a resistance level as you can see on the chart.

Now trading at about the 10-to-1 level, the Dow/Gold ratio is set to widen much further.

So what does this all mean? And what does it hold for the future for the Dow? For gold?

I’ll answer those questions now. But I urge you to put your thinking cap on, because the analysis of the Dow/Gold ratio is not easy to grasp, yet it’s critically important to understanding the future.

FIRST, the collapse in the Dow to Gold ratio was not caused simply by a crash in equity prices. It was also due to a crash in the value of the dollar, as reflected in the soaring value of gold from the year 2000 on.

SECOND, the breakout in the ratio means that the Dow is now beginning to inflation-adjust, to reflect the lower value of the dollar (as reflected in the higher price of gold).

This inflation-adjusting of equities is perfectly normal and one of the main reasons I am very bullish equities over the next several years.

All asset classes eventually recalibrate their price levels to the new reality of the purchasing power of the underlying currency, which in this case, is the dollar, which in turn, is nowhere near what it was worth back in the year 2000.

A simple exercise here will show you how the Dow will adjust. For the Dow/Gold ratio to climb back to the 18 to 20 resistance level you see on my chart, the Dow would have to explode higher to the 28,000 level, assuming gold’s current price of roughly $1,400.

Screen shot 2013-05-05 at 1.28.09 PMNaturally, the price of gold is not going to remain at $1,400. It will probably fall back to the $1,030 level, which is my target for gold’s bottom. Let’s say it does that. Then a 20-to-1 ratio for Dow/Gold, with gold at $1,030, would still imply a Dow eventually hitting the 20,600 level.

And what would happen if gold were to move to $2,000 … $3,000 … or higher? Then to reach a 20-to-1 ratio, the Dow would have to explode even higher.

At $2,000 gold, a 20:1 ratio would see the Dow eventually hit 40,000.

Take the other extreme: Gold falls to say, $600. A 20:1 ratio puts the Dow at 12,000.

Do this exercise for any price level of gold you wish, and you will see that the downside risk in the Dow is minimal and the upside potential is enormous.

That’s not to say there won’t be pullbacks in the Dow. There will be. This kind of analysis simply shows you that …

THIRD, the monetary system has changed dramatically. More specifically, the dollar has lost another huge chunk of purchasing power ? value that it will most likely never get back, even if the dollar stages a rally in the Forex markets, as it has been doing and will do some more.

Naturally, the ratio between the Dow and gold will vary considerably over the next few years.

But given the breakout from the bottom of the ratio … and the normal tendency from all markets, no matter what they are, to retrace good portions of what they have lost …

I believe it’s a very safe assumption to make that the Dow/Gold ratio will continue to climb. And that means much higher prices to come for the Dow, and U.S. equity markets in general.

You can do this sort of exercise with any asset class you want. You can look at real estate values in terms of honest money, gold … even with collectibles such as art.

And each time you do that comparison, with the price of gold, you will find that the value of the dollar has changed dramatically over the last 12 years, so much so that almost all asset prices will eventually be forced to inflate much higher.

As for gold and silver right now, the bounce you’ve seen is nothing more than a dead cat bounce. The precious metals, and commodities in general, have NOT bottomed.

So please don’t buy yet, and don’t fall prey to the pitches from all the snake-oil salesmen out there who are trying so desperately to sell you metal and mining shares now so they can earn an extra commission.

I repeat my warnings:

Gold will not bottom until it hits major long-term support at $1,030.

Silver will not bottom until it tests major long-term support at the $17 level.

If you’ve acted on any of my suggestions to purchase inverse ETFs such as theProShares UltraShort Gold (GLL) and the Direxion Daily Gold Miners Bear 3x Shares (DUST)  … or even the ProShares UltraShort Silver (ZSL) for a play on silver’s downside …

Continue to hold those positions!

Best wishes,

Larry


Avoiding fake silver and counterfeit gold products

Shortages of physical Gold & Silver everywhere – Gold and silver bullion coin and bar shortages continue. Now is the time to be very careful what you are buying. 

Avoiding fake silver and counterfeit gold products

If you have followed gold and silver market news over the past few years, it is likely you have seen various reports on fake gold and silver products.

In March 2012, a 1 kilo tungsten gold bar turned up in the United Kingdom.

Then in September 2012 there were reports on a slew of 10 oz tungsten gold bars bought and sold in New York’s jewelry district.

The big problem with these news reports is that they have given little to no solution on how the public at large can avoid fake bullion products.  

We would like to raise the general awareness of this issue both with our customers, our industry, and the general gold and silver investing public at large.  With more than a year of hands on research, we have identified some of the biggest fake silver and gold counterfeit threats facing the investing public today.

This Special Report on the growing threat of fake silver and counterfeit gold products will arm you with solutions on how to best avoid being ripped off by sellers of phony bullion products.

For many years in the silver bullion industry, rebuttals downplaying counterfeit product concerns would go something like this:

It is less likely that counterfeiters will make fake silver coins if they could make fake gold products or larger fake silver bars.  It would also be very difficult to make high quality fake silver coins with exact weighting.  Also the US gov’t has very strict laws against counterfeiting making the production of private mint product fakes far more attractive for counterfeiters ( the punishment being less severe for producing private mint fake products vs gov’t mint fake products ).  Finally, there’s just not enough profit in it for crooks to make counterfeit silver coins.

None of these arguments hold water now.

The fact is high quality fake silver coins and small fake silver bars are being produced in high volumes in China.  In particular there are fake silver eagle coins being struck and distributed priced as low as 50¢ a piece ( with capacity of wholesale production lots of 100,000+ pieces ).   

“As long as China allows these manufacturers to produce these ( fake ) legal tender coins, it is an act of war when one country counterfeits another country’s legal tender currency.  So this is very, very serious.”  states Mike Maloney, author of the “Guide to Investing in Gold and Silver.”

High quality fake silver coins and bars are a serious threat to your local coin shops, online bullion dealers everywhere, and to all physical bullion investors. 

Many high quality silver fakes have exact weighting and dimensions, and to the untrained eye (or to the dealer without counterfeit proofing technologies) fake bullion products can easily be passed off (mistakenly or knowingly) as bonafide bullion products.

How bad is the counterfeiting problem?

You name the bullion product, we can most likely find a Chinese wholesaler making fake versions of them.  

  • The US Mint
  • The Canadian Mint
  • The Perth Mint
  • The Mexican Mint
  • The Austrian Mint
  • The Chinese Mint
  • The South African Mint
  • Many Private Mint products  
  • Collectable Numismatic Coins ( Fake silver morgans, walking liberties, old fake coins from Great Britain, old fake Spanish & Austrian, etc. )


Governments Cannot Protect Bullion Investors – Example: HR 5977 Hobby Protection Act 

In 2012, the Industry Council for Tangible Assets (ICTA) unsuccessfully lobbied to have HR 5977 passed in the U.S. Congress.  The proposed bill has since died (referred to committee).

How are these fake bullion products being produced?

There are basically two methods being utilized in fake gold and silver coin and bar production:

  • There are plated gold and silver coins and bars, consisting of a thin layer of gold or silver covering base metal alloys underneath.  
  • Then there are hallowed out gold and silver bars and coins with thicker covers of gold and or silver, filled with tungsten, lead, copper, and or nickel.

Fake coin

How to avoid fake bullion products!

  • Know your bullion dealer.  
  • Make certain they have counterfeit proofing measurements in place to assure they never accidentally introduce fake bullion products into their inventories.  
  • Make certain your bullion dealer guarantees the authenticity of every product they sell.


The vast majority of bullion products we sell are new, freshly struck products which move through a chain of integrity.  Meaning the bullion is moving from mints and refiners, to us, then to our customers.  

Any secondary bullion products we sell are assayed and verified authentic utilizing multiple noninvasive, proprietary counterfeit-proofing methods to verify the authenticity of evert product we buy and sell.


THEIR LOSS IS YOUR PROFIT

If California bans hydraulic fracturing, Texans are going to make a fortune.

“How can they not see how huge fracking will be for them from here on out? That’s like telling someone 3,000 years ago that indoor plumbing is gonna be big,” he said, exasperated.

I understood why my colleague was so skeptical. But a bigger thought had come to mind…

If California bans hydraulic fracturing, Texans are going to make a fortune.

When the metals markets tumbled in mid-April, The Gold Report reached out to “the original investor bug” and author of The Dines Letter, James Dines, for perspective. He predicted a crash in commodity prices two years ago based on his analysis of a weak Chinese economy. Next, he says, will be a bond market bust once interest rates start to climb. This will lead to “a stampede to get out of bonds like a herd of elephants attempting to exit through a revolving door.” How can investors protect themselves? That is Dinesism #38.

The Gold Report: What does it mean that leading stock market averages have been in Uptrends, while commodities markets are in Downtrends?

James Dines: Our “Sell” signal on China’s economy in The Dines Letter (TDL) of Sept. 16, 2011, is still stubbornly resisted by the mainstream press, which instead persists in calling for 7.5% growth by China Since we perceive China as a barometer for the commodities markets, it followed that there would be a decline in raw-materials prices.

We find it astonishing that we seem to be the only voice in the world’s mainstream press calling commodities markets in the last two years “a crash.” Cotton down 70% from its high is merely one example. It’s not in the world’s headlines yet, but we find it remarkable that virtually all commodities are down, worldwide, even including precious metals, oil, uranium and rare earths. How could leading market averages be in Uptrends, presumably forecasting a business upturn, even while commodities have plunged? After all, to market things, they need to be made, with commodities, do they not? China was the biggest consumer of commodities, so we infer China’s economy is in trouble, especially its banks and real estate, as predicted in our 2013 Annual Forecast Issue (pages 26-29; also The Dines Letter of Mar 15, 2013, page 7). So our next “Buy” signal on China will be crucial in attempting to discern the cyclical advent of the next raw-materials upturn.

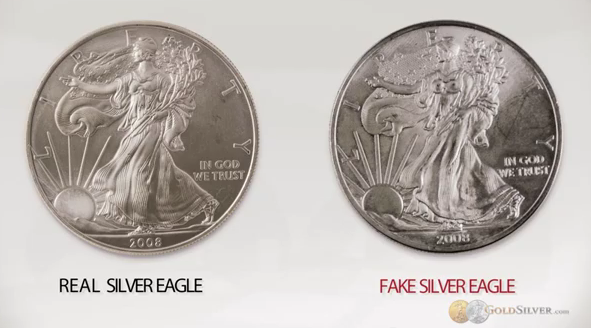
Because of excessive government interference with interest rates, those desperate for income—including pension funds—have pushed prices of virtually all secure sources to nosebleed heights. When the Fed eventually does raise interest rates, the bond bubble will be pricked and the stampede to get out of bonds should be like a herd of elephants attempting to exit through a revolving door. What to do in such a bond market crisis? Aside from TDL’s blue-chip recommendations, we always recommend dispersing assets in several “friendly” countries. Also, diversifying in golds and silvers, including Saint-Gaudens double-eagle gold coins, rather than just keeping capital entirely in fiat currencies.

The world is in what we call “The Second Great Depression,” comparable with the first one, in the 1930s. As laid out in my final business book, “Goldbug!,” doubling the money supply in 1922 to pay for World War I caused a great inflation that after 1929 was corrected by the First Great Depression, in the 1930s. The similar printing of enormous quantities of paper money, not backed by anything except more paper, has also resulted in the current Great Deflation, still deepening, worldwide. The soup kitchens of the 1930s have been replaced by food stamps, but the resemblance is not coincidental.

Realizing that Keynesian economics failed to end unemployment after the 1932 crash, until World War II began around 1940, enabled us to predict with specific clarity that it would not work these days either. Indeed. Historically, large quantities of printing-press money has failed to reduce the downward trend of Americans with jobs in recent years. Few believed our prediction of “The Coming End of the Age of Jobs,” or that it would lead to “The Coming New Social Order,” but it is already unfolding. Unemployment in Europe already ranges between 20% and 50%, depending.

It is difficult for investors to protect themselves in this situation, but we cover it as best we can. We have recommended blue-chip stocks that have a dividend yield higher than that of U.S. Treasury paper, because they are proxies for institutions seeking to park their cash in areas other than overpriced bonds. That should end when the Federal Reserve finally allows interest rates to rise, but its fanaticism in continuing to suppress rates despite the Keynesian method not working represents a triumph of hope over experience—and will not end well.

Especially shocking is the delusion that adding inflation to a deflation would somehow cancel each other out, but is in fact the futile attempt to cure a problem with its cause. Overprinting paper runs at increasing risk of an eructation of “hyperinflation”—please note it is a word not used anywhere in the mainstream press these days. Predicting a hyperinflation is so daring in today’s environment that we might be mistaken, so we will have to get closer toward the end game to be more confident of it. We hope we are mistaken.

TGR: What will be the next big sector?

JD: We refer you to Dinesism #38, of the 65 that guides our methodology: “Rich or poor it’s good to have a lot of cash.” And you may feel free to quote us on that. Also, parking some long-term capital in gold and silver, especially during pullbacks, would be useful if a hyperinflation eructs.

James Dines is legendary for having made correct forecasts that were in complete contradiction to the rest of the financial community. He is the author of five highly regarded books, including “Goldbug!,” in addition to his popular newsletter, The Dines Letter, and videotaped educational series. Dines’ highly successful investment strategies have been praised by Barron’s, Financial Times, Forbes, Moneyline and The New York Times, among others.

Want to read more Gold Report interviews like this? Sign up for our free e-newsletter, and you’ll learn when new articles have been published. To see a list of recent interviews with industry analysts and commentators, visit our Streetwise Interviews page.


DISCLOSURE: 
1) JT Long conducted this interview for The Gold Report and provides services to The Gold Report as an employee. 
2) James Dines: I was not paid by Streetwise Reports for participating in this interview. Comments and opinions expressed are my own comments and opinions. 
3) Streetwise Reports does not make editorial comments or change experts’ statements without their consent. 
4) The interview does not constitute investment advice. Each reader is encouraged to consult with his or her individual financial professional and any action a reader takes as a result of information presented here is his or her own responsibility. By opening this page, each reader accepts and agrees to Streetwise Reports’ terms of use and full legal disclaimer. 
5) From time to time, Streetwise Reports LLC and its directors, officers, employees or members of their families, as well as persons interviewed for articles and interviews on the site, may have a long or short position in securities mentioned and may make purchases and/or sales of those securities in the open market or otherwise.


Richer Than You (Must Read)

Income inequality in Canada and the United States is on the rise. Read on to learn the real reason why…

The Canadian Centre for Policy Alternatives (CCPA) analysis of income inequality data shows the richest one percent of Canadians make $180,000 more today – adjusted for inflation – than they did in 1982.

The bottom 90 percent of Canadians saw income gains of only $1,700 over the same time period. In Vancouver, Toronto, and Montreal – Canada’s three largest cities – the bottom 90 percent actually make less today than they did in 1982.

 Most Canadians living in these cities have seen drops in income of:

  • Vancouver = $4,300
  • Toronto = $1,900
  • Montreal = $224


The richest one percent of Canadians in these three cities cities saw pay increases of:

  • Vancouver = $189,000
  • Toronto = $297,000
  • Montreal = $162,000

image002

image004
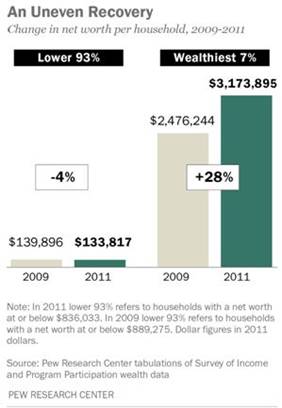
There are shocking disparities in income inequality in America…

David Cay Johnston, a Pulitzer Prize winner writing for Tax Analysts says that between 1966 and 2011, average inflation-adjusted income of the bottom 90 percent of US workers grew by just $59 while the income of the top 10 percent of workers grew by $116,071 – an astonishing, and frightening, 1,967 times the bottom 90 percent income growth rate.

The top one percent have enjoyed 81 percent of all the increased income since 2009.

The truly astonishing fact here is that it takes only $110k a year to be a top 10 percent earner in the U.S.! Getting into the top one percent is a stretch being over three times higher at $366k while joining the exclusive top .01 percent takes a whopping $8 million yearly income. In Canada, to join the top one percent club of 255,000 taxpayers, your income would have to have exceeded $200k. The threshold for the 25,475 Canadians that make up the top 0.1 percent was $685,000.00 of income.

Why such growth in income inequality?

Most would tell you, are telling you, it’s because…

Stocks and bonds are going up while the housing market remains flat. The top 10 percent have most of their wealth concentrated in stocks etc., less affluent households have their wealth in the value of their home – housing prices remain well below their 2006 peak while U.S. stock indices have all recently hit records.

Some will say falling top marginal tax rates in Canada explain part of the wealth disparity and income rise for the richest one per cent in that country.

A few will point out that the increase in inequality, in both countries, can also be attributed toinstitutional forces:

  • Declines in unionization rates
  • Stagnating minimum wage rates
  • Deregulation
  • National policies that favor the wealthy


All the reasons above show why the bottom 90 percent are getting poorer or at best have stagnating incomes but at best they explain only partially why the income gap is widening.

Consider what Stephen McNamee and Robert Miller, authors of The Meritocracy Myth have to say:

  • 20% of American households receive 50% of all available income  
  • The lowest 20% of households receive less than 4%
  • The top 5% of households receive 22% of all available income
  • The richest 1% of households account for 30% of all available net worth
  • Economic inequality in the U.S. is the highest among all industrial countries

The Wall Street Journal reported the top .01 percent (14,000 American families) hold 22.2 percent of wealth, and the bottom 90 percent (133 million families), just 4 percent of the nation’s wealth.

In 1980 the richest one percent of America took home 1 of every 15 income dollars. Now they take home 3 of every 15 income dollars. Over the last 30 odd years the share going to the richest 0.01 per cent quadrupled, from one percent to almost five percent.

Why are the rich getting so much richer? It’s obviously more of a long term trend then something that just recently started to happen, what’s going on?

image006

Executive Compensation: A New View from a Long-Term Perspective, 1936–2005

Carola Frydman, M.I.T. Sloan School of Management and NBER, Raven E. Saks Federal Reserve Board of Governors


Lavish Compensation

The super affluent have historically relied mostly on unearned income from financial assets, stocks and bonds etc., but for the last three decades that income has slowly taken a backseat to the compensation they are paid.

Canadian Centre for Policy Alternatives researcher Armine Yalnizyan found

“the income of the richest 1 per cent is due mostly to the lavish sums they are paid for the work they do.”

Paul Krugman, winner of the 2008 Nobel Prize in Economics says asset ownership by the super-rich “Is no longer the main source of elite status. These days even multimillionaires get most of their income in the form of paid compensation for their labor…Needless to say we’re not talking about wage slaves toiling for an hourly rate. If the quintessential high-income American circa 1905was an industrial baron who owned factories, his counterpart a hundred years later is a top executive, lavishly rewarded for his labors with bonuses and stock options. Even at the very top, the highest 0.01 percent of the population—the richest one in ten thousand—almost half of income comes in the form of compensation.”

USA Today’s 2012 CEO’s Compensation analysis focused on 170 S&P 500 companies that filed proxies since Jan. 1, 2013, and were processed by March 22.

The median amount CEOs took home in 2012, including cash bonuses and stock and options awarded in previous years that vested or were cashed in, was $10.2 million.

Pay and total compensation numbers listed in USA Today’s report are incredible, here’s just four of the many:

Miles White, Abbott Labs, $19 million

David Pyott, Allergan, $19.4 million

Kenneth Chenault, American Express, $28 million

Randall Stephenson, AT&T, $21 million

image008

Conclusion

It would seem the rich, in both Canada and the U.S., are getting richer while everyone else is getting poorer.

“Only twice before over the last century has 5 percent of the national income gone to families in the upper one-one-hundredth of a percent of the income distribution…Such concentration at the very top occurred in 1915 and 1916, as the Gilded Age was ending, and again briefly in the late 1920s, before the stock market crash…The great fortunes today are largely a result of the long bull market in stocks, Mr. Volcker said. Without rising stock prices, stock options would not have become a major source of riches for financiers and chief executives. Stock prices rise for a lot of reasons, Mr. Volcker said, including ones that have nothing to do with the actions of these people. The market did not go up because businessmen got so much smarter.” Louis Uchitelle, The Richest of the Rich, Proud of a New Gilded Age

The truth of, and the consequences from, such lopsided income inequality and wealth disparity should be on all our radar screens. Is it on yours?

If not, it should be.

Richard (Rick) Mills

rick@aheadoftheherd.com

www.aheadoftheherd.com

Richard is the owner of Aheadoftheherd.com and invests in the junior resource/bio-tech sectors. His articles have been published on over 400 websites, including:

WallStreetJournal, USAToday, NationalPost, Lewrockwell, MontrealGazette, VancouverSun, CBSnews, HuffingtonPost, Londonthenews, Wealthwire, CalgaryHerald, Forbes, Dallasnews, SGTreport, Vantagewire, Indiatimes, ninemsn, ibtimes, businessweek.com and the Association of Mining Analysts.

If you’re interested in learning more about the junior resource and bio-med sectors, and quality individual company’s within these sectors, please come and visit us atwww.aheadoftheherd.com

***

Legal Notice / Disclaimer

This document is not and should not be construed as an offer to sell or the solicitation of an offer to purchase or subscribe for any investment.

Richard Mills has based this document on information obtained from sources he believes to be reliable but which has not been independently verified.

Richard Mills makes no guarantee, representation or warranty and accepts no responsibility or liability as to its accuracy or completeness. Expressions of opinion are those of Richard Mills only and are subject to change without notice. Richard Mills assumes no warranty, liability or guarantee for the current relevance, correctness or completeness of any information provided within this Report and will not be held liable for the consequence of reliance upon any opinion or statement contained herein or any omission.

Furthermore, I, Richard Mills, assume no liability for any direct or indirect loss or damage or, in particular, for lost profit, which you may incur as a result of the use and existence of the information provided within this Report.


test-php-789