
Personal Finance
- Don’t chase euphoria—buy the bounce
- Where’s the next low-risk buying opportunity?
- Plus: More on gold’s recent drop
Predicting the direction of the major indexes on a day-to-day basis is an impossible feat. Attempting to play the market’s movements by the hour or minute will cause you to go insane (and lose all of your money in the process).
But if you take a step back from the intraday noise, the market paints a picture that can help you time your long-term investments and trades.
Since the broad market bottomed in mid-November, stocks have moved higher within a rising channel. It doesn’t take a lot of technical know-how to see the price extremes. The chart clearly shows where the market typically becomes overheated, and where it bounces after a pullback.
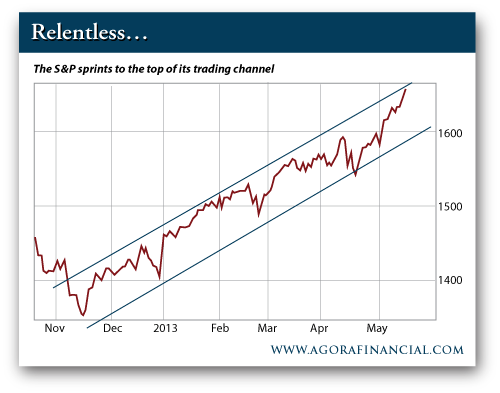
As you can see, the S&P’s May rally puts the index at the very top of its trading channel. This is the point where many investors are sucked into the euphoria of the quick move higher. But if you’ve been paying attention, you know this isn’t the best place for a low-risk buy.
Could the market sprint even higher from here? It’s possible. But a more likely outcome is a pause at the top of the channel as stocks become overextended. When the market finally does flatten out and move closer to the bottom of its channel, you’ll have an ideal buying opportunity.
Remember to keep a close eye on the technology and biotech sectors. Over the past couple of weeks, the rally has broadened and these are two groups that are trying to take the lead. When we do get that low-risk buying opportunity, this should be the first place you look for a new trade…


| Thanks to more downside action, I’ve received a lot of gold questions…
Here’s one: When do you think gold stocks are going to start rallying? Hard to say. As of last night, it doesn’t look like miners have much fight in them. Gold continues to trend lower and miners are getting crushed left and right. I’ve been searching for a snapback rally (in the miners, not the metal) for several weeks now. Nothing has triggered. I know it’s tempting to go after a position in the Market Vectors Gold Miners ETF—especially since it’s massively oversold. But “oversold” is no guarantee that higher prices are in store for us anytime soon. In short, the miners are all falling knives. They could continue to move lower from here… Here’s another: “I would like to know what you think about price of gold in the long-term (3 to 5 years). As you know, most of the Agora writers are very bullish on gold. Do you share their bullishness?” My price target for gold is $1,000 (give or take $100). I can’t tell you the exact date it will arrive at this target. All I know is that it will take more time. But in 5 years? I’m not sure. My guess is that in 5 years, the price of gold will still be below $2,000 an ounce. A lot can happen in 5 years. We’ll experience new political policies, wars, triumphs, tragedies, and technological advancements. Most importantly, we’ll have the chance to reevaluate our thinking every few months or so. After all, any prediction becomes a wild guess once it reaches far enough into the future. There are no guarantees in any market. Gold is no exception. It is not immune to selling pressure or trend changes. [Ed. Note: Send your feedback here: rude@agorafinancial.com – and follow me on Twitter: @GregGuenthner] |
Today’s Must-Read Links |

If any professional baseball player (particularly one in New York) puts up stats like that, he’s immediately booed and ridiculed. But when it comes to a particular stock market indicator, it’s actually a reason to celebrate. And guess what? It’s time to break out the bubbly.
No Batter, No Batter, Big Whiffer!
I can’t tell you how many readers routinely accuse me of being too optimistic. And I’ll readily admit that I’m a “glass half full” kind of guy. Despite my predisposition, though, I always base my bullishness on cold, hard facts. So my optimism is always justified. What’s more, when the data warrants a pessimistic stance, I have no problem embracing it. And we simply start sleuthing out attractive short-selling opportunities together.
Right now, however, there’s nothing to be bearish about. And I say that with conviction, because my “Bear Market Checklist” is a perfect 0-for-9. Not a single indicator on the list is even close to flashing a warning sign. We’ve got nothing but big whiffers.
Bear Market Warning Sign No. 1: A Tightening Fed
When Fed Chairmen — and their merry band of bankers — start tightening monetary policy, it’s time to keep an eye on the exits. Why? Because they have a tendency to overdo it, thereby creating a much more challenging environment for businesses. Or, as Richard Bernstein notes, “Historically, bull markets didn’t end when the Fed started to tighten. Rather, they ended after the Fed tightened too much.”
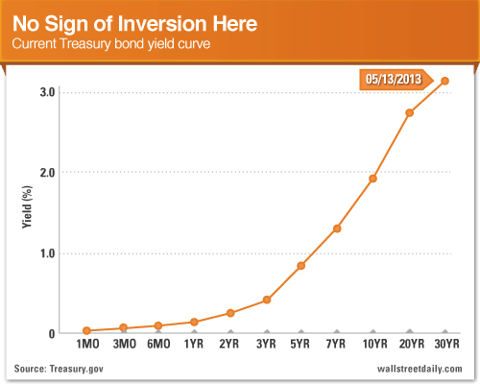
We’re in the clear now, though, since Ben Bernanke isn’t even contemplating an end to the quantitative easing efforts. If you want something specific to track, look at the yield curve. That is, the difference in short-term and long-term government bond yields. When it inverts (i.e., short-term yields rise above long-term yields), it’s a surefire indicator that the Fed has tightened too much.
As you can see, the current yield curve is nowhere near inverted.
Bear Market Warning Sign No. 2: The Incredible, Disappearing Profit
By now, I’m sure you’re tired of hearing me say that stock prices ultimately follow earnings. But it’s true. So when corporate profitability starts taking a hit, it’s only a matter of time before stock prices head south, too. Again, we’ve got nothing to worry about.
In the first quarter, S&P 500 companies reported a 3.2% increase in earnings. And analysts expect them to keep growing over the next three quarters, by 1.6%, 7.9%, and 14.2%, respectively.
Bear Market Warning Sign No. 3: A Recession Is Coming! A Recession Is Coming!
Economic activity tends to slow down long before corporate profits take a hit. So we need to be on the lookout for reliable signs of a looming recession. Note the word “reliable.” I say that because, at any given time, there are always a handful of analysts warning that a recession is coming.
Ignore the Chicken Littles — and their opinions. Instead, focus on the hard data, including the two most reliable recession indicators I shared with you in late March — Piger’s “Recession Probability Index” and the 2/10 Spread. (For the record, they aren’t flashing any warning signs.) Besides, although the economy isn’t firing on all cylinders, it’s growing nonetheless. The latest estimates call for GDP growth of about 2% this year.
Bear Market Warning Sign No. 4: A Spike in CDS Prices
With all the funny money being pumped into the market by the Federal Reserve, another banking crisis is the biggest threat to the stock market. As I’ve shared before, there’s a simple and quick way to determine if we need to be fearful. All we need to do is consult the latest prices for credit default swaps (CDS) for banks and brokers. CDS prices reflect the cost to insure against a default. So if banks are truly about to pull the stock market into the abyss, CDS prices should be rising rapidly.
Guess what? Right now, we have nothing to fear but fear itself. Or, as Bespoke Investment Group says, “Our Bank and Broker CDS Index is now at its lowest level since April 15, 2010. Over the last week alone, financial-sector default risk is down 8.5%, and it’s down 50% over the last year.”

So relax. There’s no immediate danger threatening stocks.

Some things to remember amid the volatility of the gold price…
WHEN VOLATILITY prevails in the gold market, I love seeing so many different opinions because it promotes critical thinking and healthy markets, writes Frank Holmes, CEO and chief investment officer of US Global Investors.
But because gold is unlike any other commodity, many perspectives can be extreme, such as “goldenfreudes” who take pleasure in gold bugs’ pain.
I continue to persuade readers to take a balanced and thoughtful approach to the yellow metal. With this in mind, here are four facts to remember about gold that should help neutralize those extreme bullish and bearish views.
1. You can’t print more gold
The Federal Reserve continues to print fresh, crisp stacks of US Dollars amounting to $85 billion every month, driving up the balance sheet to almost $3 trillion Dollars. If Ben Bernanke continues churning out Dollars at this rate, by 2016, the balance sheet will more than double to $7 trillion Dollars.
And research has found that the price of gold moves in near-lockstep to each increase in the Fed’s balance sheet.
Even with the incredible two-day drop in gold prices, US Global portfolio manager Ralph Aldis calculated that the correlation between the rise in gold and the US balance sheet is 0.96. Perfect correlations of 1 are extremely rare in markets, but gold and the balance sheet have moved in sync with each other since 1999, before gold’s bull run began.

2. Gold is viewed as a currency by central bankers
As gold was falling on April 15, Carl Quintanilla from CNBC asked me what I thought about how investors viewed currencies. I feel investors should look at how central banks around the world are viewing their own reserves. Although Cyprus and Italy were possibly forced to sell their gold holdings to pay down debts, take a look at the actions of emerging countries central bankers who are scooping up gold.
The World Gold Council (WGC) reported that in 2012, central banks purchased 535 tons when only a few years ago central banks were net sellers of gold. And it’s important to keep in mind that these central banks love these corrections, as they can purchase gold at cheaper prices.
Russia bought 75 tons, bringing its gold holdings to the seventh largest in the world, with about 1,000 tons. Last year, Brazil, Paraguay and Mexico purchased gold, as did South Korea, the Philippines and Iraq.
Turkey is another country that has been building reserves, though not from purchases. Rather the WGC says its growing gold reserves “reflect the increasing role that gold plays more broadly in the Turkish financial system as these reserves are substantially pledged from commercial banks as part of their required reserves.”
While the tonnage is only a fraction of the overall gold market, it is widely acknowledged that central banks are building their supplies of gold as a means to diversify their holdings away from the US Dollar and the Euro. As a percent of total reserves, many of these emerging countries mentioned above own very little gold. In fact, Pierre Lassonde, chairman of Franco-Nevada, has noted that even if emerging market central banks wanted to increase their gold reserves to 15 percent of total reserves, they’d have to buy 1,000 tons every year for the next 17 years!

3. A lack of love from the Love Trade is affecting fundamentals
Too many people focus on the Fear Trade, which is when investors buy gold coins or a gold ETF out of a fear of the fallout that may result from governments’ rising debt levels and weakening currencies.
The Love Trade, on the other hand, is the buying of gold out of an enduring love for gold. Two emerging countries that make up almost half of gold demand—China and India—have had a long relationship with the precious metal that is intertwined with their culture, religion and economy. With half of the world’s population buying gold for their friends and family, it’s important to put into context what is happening in their countries.
It was announced this week that China’s income growth slowed in the first quarter of 2013, with urban household disposable income rising only 6.7 percent on a year-over-year basis. This is down from 9.8 percent in the first quarter of 2012, and “the slowest pace since 2001,” says Sinology’s Andy Rothman.
This is very important to gold, as China’s income growth has been shown to be highly correlated to the price of the precious metal over the past decade.

4. Corrections happen, but have historically offered buying opportunities
As of mid-April, the gold price on a year-over-year percentage change basis registered a -2.6 standard deviation. While minor corrections in the gold price happen frequently, a move this severe has never occurred before over the previous 2,610 trading days.

With gold’s standard deviation drastically below the “buy signal” blue band, we consider the yellow metal to be in an extremely oversold position on a 12-month basis. The probability that gold will move higher over the next several months is high.

The entire financial management industry is a profit-skimming rentier arrangement.
According to the folks at the Motley Fool, only ten of the ten thousand actively managed mutual funds available managed to beat the S&P 500 consistently over the course of the past ten years.Consider the following: a quick glance at Yahoo Finance reveals the average expense ratio for growth and income style mutual funds is 1.29%. As a result, approximately $1,883 of every $10,000 invested over the course of ten years will go to the fund company in the form of expenses. Compare that to the Vanguard 500 fund, designed to mirror the S&P 500 index, which boasts an annual expense ratio of only 0.12%, resulting in ten-year compounded expense of $154 for every $10,000 invested.

 The great gold trader Jessie Livermore is credited with saying “The biggest profits are in your patience.” This wisdom rings true whether you are still invested in US equities which continue to rise seemingly incessantly, or you are waiting to play the downside in equity markets.
And if you’ve already exited most or all of the equity positions in your portfolio, you may find yourself feeling rather impatient while waiting for the current market euphoria to end. In a recent article I made reference to the fact that selling the very top of the market and/or buying the very bottom are just meaningless ego-based markers.
“See, look how smart I am – smarter than you!” is external validation what we are (secretly) seeking when we get too focused on getting it just perfect. At some point, “perfect becomes the enemy of excellent,” or as Jim Dines posits “Over-efforting creates counter-vailing forces.”
Perfectionism is one of many outward manifestations of a fear-based, ego-driven personality; perfectionism is an absolute killer when it comes to navigating markets. Selling the top or buying the bottom will obviously result in making maximum profits, but that comes with a big price tag – very high stress. It’s also virtually impossible to be 100% right 100% of the time.
Ultimately, what matters most is whether or not one is generating sufficient returns over the medium to longer term while protecting from major downside in the short term. Essentially it comes down to understanding how much is “enough” return to help us become or remain financially independent. Having a current, comprehensive wealth management plans as a reference makes it much easier to see this mapped out in black and white – it provides context.
When it comes to opportunities to make profits, markets usually provide two to three major opportunities each year. Similar to public transit, there’s always another bus (opportunity) coming along. No one enjoys missing that bus they were just a little too late to hop on board – the key it is not get hurt (i.e. losing money) by chasing the bus you just missed.
The bearish divergences within US stock markets continue to build, fewer stocks are making new highs and the unbridled optimism is on full display on the financial channels. So, could US equities rally another 3-5% before this ends? The answer is both “yes” and “so what?” We are never completely certain in the moment about exactly where the top or the bottom is of any trend, but we don’t need to be certain. Seeking certainty in these circumstances is thinly-disguised perfectionism.
A question we are often asked is how far markets will drop when this rise stops: 8, 10, 12 or maybe 15%? Similar to the question above, the answer is two-fold: “I don’t know,” and “it doesn’t really matter anyway.” Mid to late June MIGHT be the time for a summer low, but we’ll simply wait to see what actually develops and then take appropriate actions when fear reigns supreme. Things might also start to get very interesting around the September 22nd German elections. We’ll go with the flow when we get there.
Precious Metals seem to be behaving according to the view we published a few weeks ago; this view came directly from the work of Martin Armstrong, Bob Hoye/Ross Clark and Charles Nenner. The bounce off the April 15th lows looks like a dead-cat bounce that has already stalled and looks very vulnerable to a full rollover again. Based on these trusted research sources, we expect to see a major tradable low in the whole precious metals space by mid-June, but only time will tell.
Will key technical support in the mid $1,300’s hold this time around, or will that support fail in the midst of other market mayhem (a margin-call-led equity market sell-off?) and we see Gold test the full 61.8% Fibonacci retracement from the 2008 low to the 2011 high? If mid $1300’s support is breached, that brings $1158 into play. We don’t know in advance, but we don’t need to, either. See above.
The most prudent (and challenging) course of action is to get ego out of the way, follow what the market dictates, and when fear once again reigns supreme in markets and few people have hope for a turn-around…that will be the environment in which to take meaningful positions in beaten-down sectors with significant upside potential. Then buckle up for the upswing in the pendulum. This is where the serious profits are made – gains that can help make up for slower growth if you’ve not experienced a lot of gains recently.
Patience and Discipline are accretive to your wealth, health and happiness; Fear and Greed are destructive.
Cheers,
Andrew Ruhland, CFP, CPCA
President, Integrated Wealth Management Inc.

-
I know Mike is a very solid investor and respect his opinions very much. So if he says pay attention to this or that - I will.
~ Dale G.
-
I've started managing my own investments so view Michael's site as a one-stop shop from which to get information and perspectives.
~ Dave E.
-
Michael offers easy reading, honest, common sense information that anyone can use in a practical manner.
~ der_al.
-
A sane voice in a scrambled investment world.
~ Ed R.
Inside Edge Pro Contributors

Greg Weldon

Josef Schachter

Tyler Bollhorn

Ryan Irvine

Paul Beattie

Martin Straith

Patrick Ceresna

Mark Leibovit

James Thorne

Victor Adair