
Personal Finance
 Bubble, Bubble, Toil & Trouble.
It is almost four years after the global financial meltdown of 2008 and many parts of world are still trying to recover. Given the impact of the crisis, which rocked financial markets across the globe, it is shocking to many that Canada seems to be following many of the same lending trends as we saw in the United States in 2006. These trends were at the core of the subprime mortgage crisis, which led to the global recession of 2008.
Canadian Real Estate Report
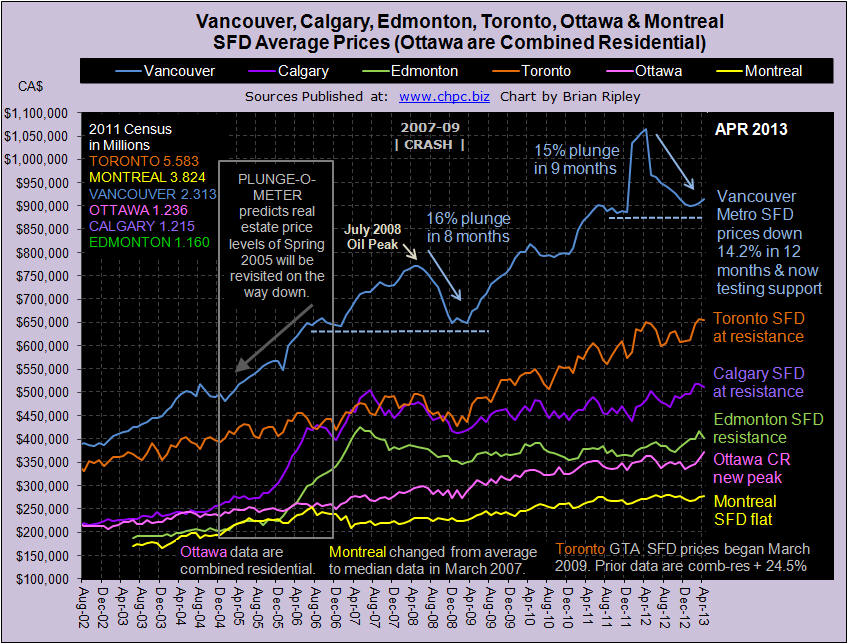
In the year and a half leading up to the crash housing prices rapidly increased in the United States, with a corresponding increase in subprime lending. We are now seeing the same trends in Canada. When analyzing the Canadian housing market, housing prices increased almost 100% since 2000, with the average home in Canada costing roughly $348,000. This is almost double our U.S. counterparts.
….for the whole analysis & charts go HERE

……just as metal Miners Mount a Powerful Reversal off Multiyear Support: (Asian gold premiums hit new highs as Europe urged to start “aggressive QE”)
Jeb Handwerger wrote nearly a month ago that “The Worse Things Were For The Mining Sector, The Better They Will Get”. This was after the first downward plunge in gold (GLD) and silver (SLV) in April due to the Goldman short (update from Jeb below:)
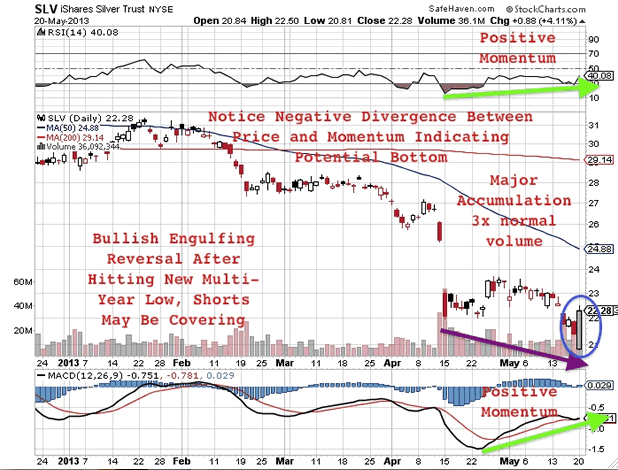
Now four weeks later, gold, silver and the miners (GDX) tested that April low and even fell below it only to reverse higher than the previous day’s selling. Across the precious metals board, we witnessed bullish engulfing patterns. We witnessed a similar reversal back in October of 2011 in the S&P500 (SPY) when we called for a bullish upturn in equities. See the video update from back then.
We saw today (Monday) gold, silver and both the large and junior miners (GDXJ) dip lower at the open and close above Friday’s high on more than triple average volume. This is a significant technical development as it means the gold bulls have regained control at a key technical low.
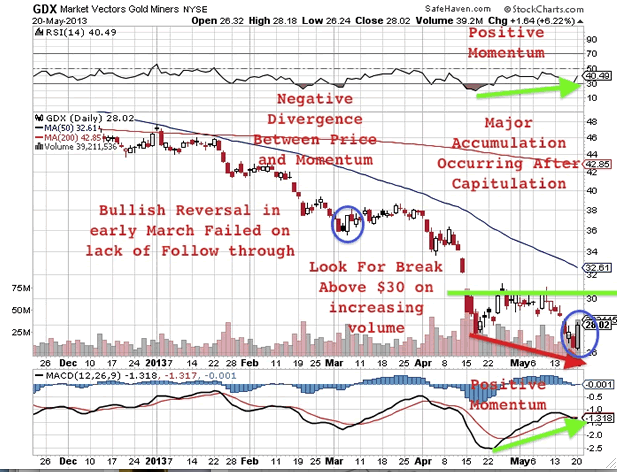
Silver hit a five year trailing average in the low 20s and gold hit a three year trailing average below $1350. Multi-year support should hold after this downturn for close to two years.
This is one of the first major bullish engulfing’s since the decline and may suggest that a low is in place and the end of the decline may be near. It at least cautions a short term reprieve of the recent downturn.
This technical occurrence happened at the same time as Moody’s threatens a credit downgrade for the United States. According to them not enough is being done in the U.S. to bring down soaring deficits. Don’t forget the downgrade from the S&P in August of 2011 sent gold soaring to $1900.
Do not be surprised to see a reemergence of sovereign debt issues in the United States. The U.S. dollar (UUP) and long-term Treasury bonds (TLT) have been direct beneficiaries of the recent Japanese yen (FXY) devaluation and may soon see topping action. This could spark a rally into the commodities (DBC), energy (XLE), precious metals and the miners which historically has a negative correlation with bonds and dollar strength.
Disclosure: Author does not own securities in article.

EU is stealing bank accts & France outlawed trading gold, er….that’s why
Long Live the Dollar
If anyone wants to know why the dollar will soar to new highs, just stop and look at Europe. The gold promoters will claim the bank crisis will make gold soar. But the dollar will soar. France is out to shut down gold sales and has outlawed buying or selling gold for cash. They are tracking every ounce. The smart Europeans will move their cash to the USA before they can’t get out or go to Asia maybe better. But the bottom line – it is the dollar that is becoming the ONLY game in town.
The banking crisis in Europe is worse that the US ever was. The US was a trading loss, this is a systemic failure that is more than $1 trillion in bad loans when the USA was $700 billion. France wants total seizure of assets to secure socialism. This is like cutting off your head because you have a headache. The denials of the Cyprus solution would ever be applied to the EU have faded into the night. The politicians cannot see for an instant what they are doing to the world economy. When I said we have a Crisis in Democracy – this was not hype. The EU will seize bank deposits to bailout the banks. The governments are unwilling to put in that money because they cannot sell it to the people. Germans are not interested in bailing out the banks in Italy or Spain.
A slowdown in British inflation sent sterling to a 7-week low on the view it could give the Bank of England more leeway to support the UK economy, and the yen lost ground after a Japanese minister rowed back on remarks suggesting the currency had weakened enough.
The Dollar is the Prettiest of the Four Ugly Sisters – Europe, UK, Japan & USA
Long Live the Dollar
http://translate.google.de/translate?sl=de&tl=en&js=n&prev=_t&hl=de&ie=UTF-8&eotf=1&u=http://www.mmnews.de/index.php/wirtschaft/13068-eu-plant-sparer-enteignung-ab-2016
Ed Note:


-
I know Mike is a very solid investor and respect his opinions very much. So if he says pay attention to this or that - I will.
~ Dale G.
-
I've started managing my own investments so view Michael's site as a one-stop shop from which to get information and perspectives.
~ Dave E.
-
Michael offers easy reading, honest, common sense information that anyone can use in a practical manner.
~ der_al.
-
A sane voice in a scrambled investment world.
~ Ed R.
Inside Edge Pro Contributors

Greg Weldon

Josef Schachter

Tyler Bollhorn

Ryan Irvine

Paul Beattie

Martin Straith

Patrick Ceresna

Mark Leibovit

James Thorne

Victor Adair