Gold & Precious Metals

5 Signs Of An Imminent Gold & Silver Price Rally

(1) Excessive speculative shorts and growing commercial longs

COT gold 24 may 2013

While the markets have been very volatile lately, hence difficult to predict, it is reasonable to expect a bounce in theprice of gold and silver. We hasten to say that nobody can predict the future, so our expectation could turn out to be wrong. To be more precise, the probability of higher prices is higher than the probability of lower prices, at least in the short run. Here is why.

Diversification Is Key to Energy Value

Calling the energy space underowned and a great value, Frank Holmes and Brian Hicks of U.S. Global Investors view shale oil plays as integral to an energy renaissance. Still, to hedge their bets, the two experts recommend diversification across the entire natural resources sector, including agriculture and food. In this interview with The Energy Report, they list opportunities in upstream oil and gas production, refining stocks, master limited partnerships and potash.

COMPANIES MENTIONED : CF INDUSTRIES HOLDINGS INC. : ENTERPRISE PRODUCTS PARTNERS L.P.   : HOLLYFRONTIER CORP. : HORNBECK OFFSHORE SERVICES INC. : KINDER MORGAN ENERGY PARTNERS L.P. : MARATHON PETROLEUM CORP. : PIONEER NATURAL RESOURCES CO. : PLAINS ALL AMERICAN PIPELINE L.P. : POTASHCORP. : SMITHFIELD FOODS INC. : THE MOSAIC CO. : TYSON FOODS INC. : WILLIAMS PARTNERS L.P.
……………


The Energy Report: Frank, you wrote a contrarian manifesto of sorts at the beginning of May titled “A Case for Owning Commodities When No One Else Is.” It showed that energy is the most underowned class by a long shot. That situation was last seen at the end of 2008, just before a major rally in natural resource stocks. Is history repeating itself?

Holmes Chart A

Frank Holmes: To a certain degree, yes. The big difference is that America, thanks to the new introduction of fracking technology, is in a different position than the rest of the world. This is positive for America’s trade deficits and its costs of manufacturing.

Holmes Chart 1

The population of the rest of the world continues to grow. China and India account for about 40% of the world’s population growth. Both countries import energy. There is not enough water in China for it to benefit from fracking.

Brian Hicks: Water is a very large constraint in fracking, along with other geologic factors. Over the last several years, the game changer has been the development of shale plays here in the U.S. We now import less oil than China because of the amount of shale oil we have.

FH: The U.S. has had huge success in drilling and exploring for natural gas, followed by all this gas coming onstream. The inverse of that was when drilling rigs slowed down because gas prices were falling. The rig count went to an all-time low.

“Very few North American natural gas plays are economic at a price below $4/Mcf.”

People do not realize that looking for energy is like being a gerbil on a wheel—you have to drill continuously to replace production. When drilling slowed down to a fraction of what it had been, gas prices went up. What are they now, Brian?

BH: They fell as low as $1/thousand cubic feet ($1/Mcf). Now we are in the $4/Mcf range. We had a clear overshoot to the downside. Now we are back to a more normal level.

We are in the shoulder months for natural gas. If we see a warm summer, the gas price could easily approach $5/Mcf. Right now, people are in a wait-and-see mode.

The natural gas market looks constructive. There is more commercial usage. The rig count is down. If we start to see more demand on the horizon, natural gas prices could go back to $5/Mcf pretty quickly.

TER: Do you agree with the Porter Stansberrys of the world, who say the U.S. will be a gas exporter within the next few years, or do you lean toward the Bill Powers‘ school of thought, that wells will be decimated a lot faster than anticipated and there is no supply glut?

BH: I do not think we have a supply glut. We have had a severe oversupply for the last few years, but that has started to change. The change is reflected in rebounding equity prices and a more normal price range for natural gas. In terms of government policy, natural gas is considered a winner, with coal losing market share.

“We have seen a pretty good lift in upstream oil and gas producers here in the U.S.” 

Very few North American plays are economic at a price below $4/Mcf. To incentivize more capital investment in natural gas drilling and build a stronger rig count, we need to see prices sustained above $4, closer to $4.50–5. If gas falls below $4/Mcf and stays in that range, the rig count will continue to erode and supply will diminish.

This year’s somewhat longer winter shored up the overall inventory picture, which is more or less back to normal. If we have typical summer weather, we could enter the heating season with inventories slightly below average.

The new wells being drilled—the shale natural gas plays—come on at very high rates and decline very quickly. For some plays, questions remain as to where their flow rates will bottom out. Despite the strong supply response of this new technology, there are still question marks as to what the normalized rates will be.

TER: Almost 19% of your Global Resources Fund is in energy stocks: 9.98% in oil and gas and 8.8% in energy infrastructure. Which is the biggest growth area: exploration, production, transportation or services?

BH: We have seen a pretty good lift in upstream oil and gas producers here in the U.S. Internationally, a number of stocks are trading at compelling valuations that could go higher. On the service side, we have seen a good bounce year-to-date.

“The expansion of the U.S. crude oil supply has prompted a massive need for pipeline infrastructure.”

Refining stocks is an area we see as an inverse derivative play of new production in shale oil plays. The refiners are the beneficiaries of all of the crude coming on-line. They can source cheaper feedstock and produce refined diesel product at lower costs than their global peers. The U.S. is exporting large quantities of refined product. The margins of refining companies have expanded, and they are generating a lot of free cash, paying dividends and buying back stock. Thematically, we have enjoyed the refining space at the larger cap level because of that competitive advantage.

We also see that competitive advantage reflected in chemicals, another source of strength. Even more broadly, this energy renaissance is helping lower manufacturing costs. It has benefited the overall U.S. economy.

More upside potential remains in services. If the North American rig count expands, I think pressure pumping and drilling stocks will improve. We have invested for a number of years in an offshore theme: infrastructure, supply, manufacturing. A lot of capital is being spent in the offshore space off Brazil and in the Gulf of Mexico. That is another area that looks compelling.

TER: What are some examples of stocks in your portfolio that have done well in each of those areas?

BH: Starting in the refining space, HollyFrontier Corp. (HFC:NYSE) had a very good 2012, as didMarathon Petroleum Corp. (MPC:NYSE). Both benefited from strong midcontinent refining margins.

In upstream oil and gas production, we own Pioneer Natural Resources Co. (PXD:NYSE), which has a lot of opportunities in the Permian Basin. It expanded its overall resource by doing some lateral drilling, and is seeing big success there.

In the services area, I mentioned the offshore theme. Hornbeck Offshore Services (HOS:NYSE) has started to gain traction with increased drilling activity in the Gulf of Mexico. It is an offshore supply boat company. You are starting to see significant earnings power generated in the Gulf of Mexico because of increased day rates and more activity after the Macondo oil spill.

TER: You have four master limited partnerships (MLPs) in your fund. What role do they play in balancing your risk exposure?

BH: Our energy infrastructure allocation comprises mostly MLPs. You might think of higher dividend-paying, higher-yielding stocks as lower growth, but that is not the case with these MLPs.

The expansion of the U.S. crude oil supply has prompted a massive need for pipeline infrastructure. In the South Texas Eagle Ford shale play, we see tangible signs of pipeline takeaway infrastructure. We like investments that pay us a dividend every quarter—some between 5–7%—and that are growing at double-digit rates because of the build out taking place in MLPs. We think that could continue for some time.

With MLPs, you get the added benefit of a strong inflation-adjusted yield that will increase along with prices for the underlying commodity, and at a faster rate than consumer price index inflation.

TER: What are some of the best performers in the MLP space?

BH: Kinder Morgan Energy Partners L.P. (KMP:NYSE) has been a strong performer for us. We have owned Plains All American Pipeline L.P. (PAA:NYSE), but sold that after a big move.

Enterprise Products Partners L.P. (EPD:NYSE) is a major name in the space. Williams Partners L.P. (WPZ:NYSE) has done well for us also.

TER: You also invest in fertilizer, in the form of potash. Why are you bullish on agriculture? What is the best way to invest in that space?

BH: We are very bullish on agriculture and food from a long-term, thematic standpoint.

The overall theme is rising income levels in emerging markets, which increases demand for protein, whether from cattle or chicken. More protein requires more feed, so you can see demand for corn strengthening. Global population growth and per-capita income growth are also driving the demand for more food.

We have chosen to play that in two ways with companies that package and produce food and protein, such as Tyson Foods Inc. (TSN:NYSE) and Smithfield Foods Inc. (SFD:NYSE).

You also have the fertilizer stocks such as PotashCorp. (POT:TSX; POT:NYSE)CF Industries Holdings Inc. (CF:NYSE), which produces nitrogen, also used in fertilizer; and The Mosaic Co. (MOS:NYSE). Those stocks have done very well over the years, and should continue to do well given the macro theme.

TER: Is that your advice for contrarians looking to profit in the energy sector—diversification?

BH: This is an unprecedented time with respect to macro policy, considering the economic conditions in Europe, the expansion of the money supply in the developing world and central banks increasing their balance sheets. There are lots of crosscurrents. We have chosen to negotiate those crosscurrents by being diversified. Our resources fund is balanced across the spectrum of natural resources.

Within the energy sector, we have an allocation in all segments of the energy value train: refining, MLPs, upstream oil and gas production, domestic and international stocks. Having our hand in all of these areas helps us navigate volatility and capitalize on mispriced stocks wherever we find them.

We try not to make large, concentrated bets in any one particular area. This strategy makes sense whether you are an institutional investor or an individual investor. We look for sustainable, long-term themes—companies that can generate cash flow in bullish commodity environments or in a commodity environment that is not quite so bullish. In other words, we look for lower-cost producers with solid management teams.

TER: Frank and Brian, thank you for your time and your insights.

FH: Thank you.

BH: It’s been a pleasure.

Frank Holmes is CEO and chief investment officer at U.S. Global Investors Inc., which manages a diversified family of mutual funds and hedge funds specializing in natural resources, emerging markets and infrastructure. The company’s funds have earned many awards and honors during Holmes’ tenure, including more than two dozen Lipper Fund Awards and certificates. He is also an adviser to the International Crisis Group, which works to resolve global conflict, and the William J. Clinton Foundation on sustainable development in nations with resource-based economies. Holmes co-authored “The Goldwatcher: Demystifying Gold Investing” (2008). Holmes is a former president and chairman of the Toronto Society of the Investment Dealers Association, and served on the Toronto Stock Exchange’s Listing Committee. A regular contributor to investor-education websites and a much-sought-after keynote speaker at national and international investment conferences, he is also a regular commentator on the financial television networks and has been profiled by Fortune, Barron’s, The Financial Times and other publications.

Brian Hicks joined U.S. Global Investors Inc. in 2004 as a co-manager of the company’s Global Resources Fund (PSPFX). He is responsible for portfolio allocation, stock selection and research coverage for the energy and basic materials sectors. Prior to joining U.S. Global Investors, Hicks was an associate oil and gas analyst for A.G. Edwards Inc. He also worked previously as an institutional equity/options trader and liaison to the foreign equity desk at Charles Schwab & Co., and at Invesco Funds Group Inc. as an industry research and product development analyst. Hicks holds a master’s degree in finance and a bachelor’s degree in business administration from the University of Colorado.

Want to read more Energy Report interviews like this? Sign up for our free e-newsletter, and you’ll learn when new articles have been published. To see a list of recent interviews with industry analysts and commentators, visit our Interviews page.

RELATED ARTICLES


DISCLOSURE: 
1) JT Long conducted this interview for The Energy Report and provides services to The Energy Reportas an employee. She or her family own shares of the following companies mentioned in this interview: None.
2) The following companies mentioned in the interview are sponsors of The Energy Report: None. Streetwise Reports does not accept stock in exchange for its services or as sponsorship payment.
3) Brian Hicks: I or my family own shares of the following companies mentioned in this interview: None. I personally am or my family is paid by the following companies mentioned in this interview: None. I was not paid by Streetwise Reports for participating in this interview. Comments and opinions expressed are my own comments and opinions. I had the opportunity to review the interview for accuracy as of the date of the interview and am responsible for the content of the interview. 
4) Frank Holmes: I or my family own shares of the following companies mentioned in this interview: None. I personally am or my family is paid by the following companies mentioned in this interview: None. I was not paid by Streetwise Reports for participating in this interview. Comments and opinions expressed are my own comments and opinions. I had the opportunity to review the interview for accuracy as of the date of the interview and am responsible for the content of the interview. 
5) The following securities mentioned were held by the Global Resources Fund as of 3/31/13: HollyFrontier Corp., Marathon Petroleum Corp., Pioneer Natural Resources Co., Hornbeck Offshore Services Inc. Kinder Morgan Energy Partners LP, Enterprise Products Partners LP, Williams Partners LP, Tyson Foods Inc., Smithfield Foods Inc., Potash Corp. of Saskatchewan Inc. (PotashCorp.), CF Industries Holdings Inc. and The Mosaic Co. 
6) Interviews are edited for clarity. Streetwise Reports does not make editorial comments or change experts’ statements without their consent. 
7) The interview does not constitute investment advice. Each reader is encouraged to consult with his or her individual financial professional and any action a reader takes as a result of information presented here is his or her own responsibility. By opening this page, each reader accepts and agrees to Streetwise Reports’ terms of use and full legal disclaimer. 
8) From time to time, Streetwise Reports LLC and its directors, officers, employees or members of their families, as well as persons interviewed for articles and interviews on the site, may have a long or short position in securities mentioned and may make purchases and/or sales of those securities in the open market or otherwise.


The Smoke of ZIRP and the Mirrors of QE…

The front pages of yesterday’s newspapers were full of good news. A strong rebound in real estate prices, they said, meant a full recovery was in the bag. From Reuters:

Home prices accelerated by the most in nearly seven years in March as the spring buying season gave the sector traction, while surging consumer confidence pointed to some resilience for the economic recovery.

The data on Tuesday also suggested the two segments could act as buffers as the broader economy faces the pinch of belt-tightening in Washington.

The S&P/Case Shiller composite index of 20 metropolitan areas climbed 10.9% year over year, beating expectations for 10.2%. This was the biggest increase since April 2006, just before prices peaked in the summer of that year.

This, along with a record stock market, was spreading cheer from coast to coast. Again, from Reuters:

Consumer confidence strengthened in May to the highest level in more than five years, suggesting Americans’ attitudes were resilient in the face of belt-tightening in Washington, a private sector report showed on Tuesday.

The Conference Board, an industry group, said its index of consumer attitudes jumped to 76.2 from an upwardly revised 69 in April, topping economists’ expectations for 71. It was the best level since February 2008.

So you see, dear reader, everything is hunky-dory, copacetic and cool.

Good News Is Bad News

But wait! What’s this? In the face of all this good news, the US stock market fell and “disaster insurance” gold rose. The Dow dropped 106 points. And the price of gold went up $12 per ounce.

Why? Because good news is bad news. Bad news is good news. Up is down and backward is forward . Nothing is what it seems… or what it ought to be.

If the economy were really doing better, the Fed would have to follow through on its promise to “normalize” monetary policy. That is, it would stop lending at zero interest rates and stop its $85 billion-per-month QE program.

But our hunch is that those hocus-pocus programs – not a genuine recovery – are what keep stock prices going up. Take them away and you also take away the boom in stocks… and real estate too. (Housing prices now depend on the lowest mortgage rates in 50 years.)

What this means is that there is no genuine recovery. It’s all the smoke of ZIRP and the mirrors of QE. When the magic show ends… so does the illusion of recovery.

40 Facts You Won’t Believe

Yesterday, we promised to tell what was really going on in the US economy. As you will see, there is no sign of a real recovery. Instead, what we see is a deepening depression disguised by a Fed-driven asset bubble. Here’s The Economic Collapse blog with “40 Statistics About the Fall of the U S Economy That Are Almost Too Crazy to Believe”

1. Back in 1980, the US national debt was less than $1 trillion. Today, it is rapidly approaching $17 trillion.

20130530drechart1

2. During Obama’s first term, the federal government accumulated more debt than it did under the first 42 US presidents combined.

3. The US national debt is now more than 23 times larger than it was when Jimmy Carter became president.

4. If you started paying off just the new debt that the US has accumulated during the Obama administration at the rate of one dollar per second, it would take more than 184,000 years to pay it off.

5. The federal government is stealing more than $100 million from our children and our grandchildren every single hour of every single day.

6. Back in 1970, the total amount of debt in the United States (government debt + business debt + consumer debt, etc.) was less than $2 trillion. Today, it is over $56 trillion.

20130530drechart

7. According to the World Bank, US GDP accounted for 31.8% of all global economic activity in 2001. That number dropped to 21.6% in 2011.

8. The United States has fallen in the global economic competitiveness rankings compiled by the World Economic Forum for four years in a row.

9. According to The Economist, the United States was the best place in the world to be born into back in 1988. Today, the United States is tied for only 16th place.

10. Incredibly, more than 56,000 manufacturing facilities in the United States have been permanently shut down since 2001.

11. There are fewer Americans working in manufacturing that there was in 1950, even though the population of the country has more than doubled since then.

12. According to The New York Times, there are now approximately 70,000 abandoned buildings in Detroit.

13. When NAFTA was pushed through Congress in 1993, the United States had a tradesurplus with Mexico of $1.6 billion. By 2010, we had a trade deficit with Mexico of $61.6 billion.

14. Back in 1985, our trade deficit with China was approximately $6 million (million with a little “m”) for the entire year. In 2012, our trade deficit with China was $315 billion.That was the largest trade deficit that one nation has had with another nation in the history of the world.

15. Overall, the United States has run a trade deficit of more than $8 trillion with the rest of the world since 1975.

16. According to the Economic Policy Institute, the United States is losing half a million jobs to China every single year.

17. Back in 1950, more than 80% of all men in the United States had jobs. Today, less than 65% of all men in the United States have jobs.

18. At this point, an astounding 53% of all American workers make less than $30,000 per year.

19. Small business is rapidly dying in America. At this point about only 7% of all non-farm workers in the United States are self-employed. That is an all-time record low.

20. Back in 1983, the bottom 95% of all income earners in the United States had 62 cents of debt for every dollar that they earned. By 2007, that figure had soared to $1.48.

21. In the United States today, the wealthiest 1% of all Americans have a greater net worth than the bottom 90% combined.

22. According to Forbes, the 400 wealthiest Americans have more wealth than the bottom 150 million Americans combined.

23. The six heirs of Wal-Mart founder Sam Walton have as much wealth as the bottom one-third of all Americans combined.

24. According to the US Census Bureau, more than 146 million Americans are either “poor” or “low income.”

25. According to the US Census Bureau, 49% of all Americans live in a home that receives direct monetary benefits from the federal government. Back in 1983, less than a third of all Americans lived in a home that received direct monetary benefits from the federal government.

26. Overall, the federal government runs nearly 80 different “means-tested welfare programs,” and at this point, more than 100 million Americans are enrolled in at least one of them.

27. Back in 1965, only one out of every 50 Americans was on Medicaid. Today, one out of every six Americans is on Medicaid, and things are about to get a whole lot worse. It is being projected that Obamacare will add 16 million more Americans to the Medicaid rolls.

28. As I wrote recently, it is being projected that the number of Americans on Medicare will grow from 50.7 million in 2012 to 73.2 million in 2025.

29. At this point, Medicare is facing unfunded liabilities of more than $38 trillion over the next 75 years. That comes to approximately $328,404 for every single household in the United States.

30. Right now, there are approximately 56 million Americans collecting Social Security benefits. By 2035, that number is projected to soar to an astounding 91 million.

31. Overall, the Social Security system is facing a $134 trillion over the next 75 years.

32. Today, the number of Americans on Social Security Disability now exceeds the entire population of Greece, and the number of Americans on food stamps now exceeds the entire population of Spain.

33. According to a report recently issued by the Pew Research Center, on average, Americans over the age of 65 have 47 times as much wealth as Americans under the age of 35.

34. US families that have a head of household who is under the age of 30 have a poverty rate of 37%.

35. As I mentioned recently, the homeownership rate in America is now at its lowest level in nearly 18 years.

36. There are now 20.2 million Americans who spend more than half of their incomes on housing. That represents a 46% increase from 2001.

37. 45% of all children are living in poverty in Miami more than 50% of all children are living in poverty in Cleveland, and about 60% of all children are living in poverty in Detroit.

38. Today, more than 1 million public school students in the United States are homeless. This is the first time that has ever happened in our history.

39. When Barack Obama first entered the White House, about 32 million Americans were on food stamps. Now, more than 47 million Americans are on food stamps.

40. According to one calculation, the number of Americans on food stamps now exceeds the combined populations of Alaska, Arkansas, Connecticut, Delaware, District of Columbia, Hawaii, Idaho, Iowa, Kansas, Maine, Mississippi, Montana, Nebraska, Nevada, New Hampshire, New Mexico, North Dakota, Oklahoma, Oregon, Rhode Island, South Dakota, Utah, Vermont, West Virginia and Wyoming.


Regards,

bbonner-sig

Bill


Can 1976 Give Us Insight Into Gold’s Price Behavior?

The Wall Street Journal ran a piece delineating the two sides of the gold debate giving five reasons why the gold bulls are right and five reasons why the gold bears are right.

Here is the 5-point gold “Bull” case:

1.    Fears that Cyprus may sell its gold have receded.

2.    The exuberance in the equities market will fade as soon as there is a major correction and investors will turn to gold.

3.    The monsoon season in India will end, the marriage season will begin and with it the traditional gold buying frenzy which will contribute to long-term demand.

4.    Banks in India count gold as part of the bank’s liquid ratio. As the asset base of banks will grow, so will demand for gold.

5.    Physical demand for gold is high.

We added a few more reasons that they didn’t think of.

6.    Central banks in various countries are buying the dollar to lower the value of their own currencies. That’s a currency war.

7.    Central banks are still net buyers of gold and we don’t see any signs of abatement.

8.    Central banks are flooding more and more fiat money into the system. The more they do, the more it loses its value. Gold cannot be printed and there is a limited amount that can be mined each year. Gold is money.

9.    Owning gold isn’t necessarily about buying low and selling high. Sometimes, it is about owning a long-term insurance policy.

10. We don’t see a balanced budget in sight. We are not buying the economic recovery and the “recession is over” story.

Here are the five-point “Bear” case.

1.    The U.S. Fed could cut the stimulus sooner than later.

2.    Investor sentiment for gold is poor, to say the least.

3.    The U.S. dollar is strong which dampens gold’s appeal for other currency holders.

4.    Indian gold demand faces risks in the near term before the wedding season begins.

5.    There could be further liquidations of gold ETFs.

Regarding the first point, comments from Ben Bernanke to Congress last week suggested the central bank may begin tapering its bond-buying program in coming months. On Wednesday morning, stocks had rallied after the release of Bernanke’s prepared remarks, in which he said that premature tightening in policy could strangle the economic recovery. However, in the question-and-answer session, Bernanke said the Fed could slow the pace of asset purchases in the “next few meetings.” That comment sent the markets gyrating downwards making for a volatile and interesting day for precious metals. The sector moved slightly higher, then soared, stayed high for several minutes and then crashed with stocks following more or less the same path. The USD Index did the opposite. The Fed’s bond-buying program is one of the major factors underpinning the stock rally. There is no denying that there was a time when it directly helped gold. In Thursday early trading gold bounced back as the dollar fell sharply and European shares dropped after weak Chinese factory activity added to concerns about a delayed recovery. According to the Market Watch report, Thursday saw safe haven gold buying, something the yellow metal has not experienced in a while.

China manufacturing data issued Thursday came in weaker than expected, which is bearish for commodities. The fact that gold rallied in the face of this news suggests there was “solid safe-haven demand for gold Thursday,” according to MarketWatch.

Last month’s savaging of the gold price no doubt has left new gold investors shaken. But the reasons that led to the bull market in gold have not changed. If anything they are stronger than ever. Unless governments suddenly start balancing budgets, or unless central bankers suddenly stop printing money, there is definitely a good case for those who side with the gold bulls. But as of now, Japan and the US have embarked on a record quantitative easing policy. The speculators have been shaken out and gold has moved into stronger hands who have been buying up the physical kind to keep and to hold.

We think that the gold bull market will resume its upward trajectory shortly. It is, however, vulnerable to further weakness in the short run.

Having discussed gold’s fundamentals, let’s move on to today’s chart section to see how the technical picture of the yellow metal looks like. We will start with the very long-term chart (charts courtesy by http://stockcharts.com.) 

Click on Chart or HERE for larger image

radomski may282013 1

Gold prices moved higher last week but from the long-term perspective the rally is really not significant. It is barely visible here as it seems to simply be the expected period of consolidation which we have written about in the May 20 Market Alert we sent to our subscribers:

[in 1976] there was a pullback in gold before it moved below the initial low. We could see this type of action shortly. If silver and mining stocks consolidate below their previous lows it will simply serve as a confirmation of the breakdown and an indication of further declines.

The very long-term cyclical turning point is now quite close and it still seems that a bottom will be formed relatively soon but it is not necessarily in just yet. The reverse parabola trading pattern remains, so the possibility of a sharp drop in price is still in place for the yellow metal. The next support level, the 38.2% Fibonacci retracement level is around $1,285 and could be close to the level where the bottom finally forms, but a sharp intra-day or intra-week drop below it, would not surprise us either.

Now let us have a look at two important ratios that show gold’s performance relative to other important groups of assets. The first one is the Dow to gold ratio chart which is a proxy for a ‘stocks to gold’ ratio.

radomski may282013 2

Little has changed in this ratio last week and it seems that the comments we made inlast week’s essay remain up-to-date:

Here, we saw an important breakout above the declining long-term resistance line. This has bearish implications for gold. (…) The next resistance level for this ratio is at 12.5 and with it currently at 11, declines in gold will surely be needed in addition to higher stock prices in order for the ratio to move this much higher (it seems that a move higher in the general stock market will not be enough for the ratio to move that high soon). The implications are, of course, bearish.

The second important ratio that we’d like to discuss today is the gold to bonds ratio. Let’s have a look then.

radomski may282013 3

In this another important ratio for gold, some strength was seen last week. Overall, however, this is not enough to change the outlook at this time and the short-term trend remains down. The next support line is the 61.8% Fibonacci retracement level, at 3.79, more than one-half a point lower than Thursday’s closing ratio level of 4.31. This is also equal to the level of the 2008 bottoms in terms of the closing prices.

Summing up, last week a pause was seen in the decline around the level of gold’s previous bottom. This is what we expected as it is very similar to what was seen way back in 1976. History does seem to rhyme here and since back then a bigger decline followed this type of move, we expect to see the same once again.

Thank you for reading. Have a great and profitable week!

Przemyslaw Radomski, CFA

Founder, Editor-in-chief

Gold Investment & Silver Investment Website – Sunshine Profits

* * * * *


Disclaimer

All essays, research and information found above represent analyses and opinions of Przemyslaw Radomski, CFA and Sunshine Profits’ associates only. As such, it may prove wrong and be a subject to change without notice. Opinions and analyses were based on data available to authors of respective essays at the time of writing. Although the information provided above is based on careful research and sources that are believed to be accurate, Przemyslaw Radomski, CFA and his associates do not guarantee the accuracy or thoroughness of the data or information reported. The opinions published above are neither an offer nor a recommendation to purchase or sell any securities. Mr. Radomski is not a Registered Securities Advisor. By reading Przemyslaw Radomski’s, CFA reports you fully agree that he will not be held responsible or liable for any decisions you make regarding any information provided in these reports. Investing, trading and speculation in any financial markets may involve high risk of loss. Przemyslaw Radomski, CFA, Sunshine Profits’ employees and affiliates as well as members of their families may have a short or long position in any securities, including those mentioned in any of the reports or essays, and may make additional purchases and/or sales of those securities without notice.


Is Real Estate Ever a Wise Investment for Retirees?

At one point in my life you might have heard me say something like, “I’ve probably made more money in real estate by accident than I have in the market on purpose.” For many years, you could buy good-quality property, as much as you could afford, and you were almost guaranteed to make money. That ended in 2008. Now folks are looking for bargains, hoping to profit from the crash.

130529image1
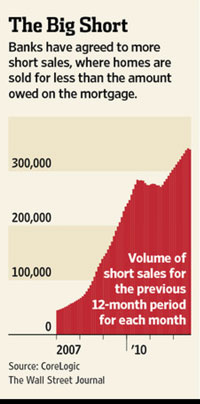
So what has changed? I don’t have to tell you that the commercial and residential real-estate markets took a huge hit in 2008 and have yet to fully recover. Many folks saw the value of their homes drop by 40% or more, and their net worth drop right along with it. In the meantime, bank short sales have skyrocketed.

Opportunities to buy may be returning, but something else has also changed. Folks on either side of the retirement cusp are in a different place in life than when they bought their McMansions. Children have fled the coop, so their needs have changed. Also, retirees and folks approaching retirement cannot afford a do-over. We no longer have time to recover from investment losses… certainly not if we plan on staying retired.

When we conducted a survey of readers last fall to see what was on their minds, investment wise I mean, real estate investing was in the top 3. The other two were annuities and income investing. We’ve covered both several times, most recently here and here.

With real estate investing a hot topic, I’d like to review theMoney Forever Five-Point Balancing Test and see how it applies to real estate. It’s the test we apply to all of our investments, not just stocks.

  1. Is it a solid company or investment vehicle?
  2. Does it provide good income?
  3. Is there good opportunity for appreciation?
  4. Does it protect against inflation?
  5. Is it easily reversible?

Some real estate may indeed meet all five criteria, but folks of retirement age must be much more selective.

My wife Jo and I moved to Fort Myers, Florida in 1985 – about the time that the new airport opened, which allowed bigger jets access to the southwest corridor of Florida. I-75 was also extended south from Sarasota down through Naples and over to Miami. Real estate in the southwest part of Florida exploded.

I had a good friend who put together several partnerships to invest in property. Twenty of us would put up 5% each, buy land, get the necessary permits, and then sell the property to a developer. We did well on several parcels.

One parcel we bought, which I thought would provide the greatest return of all, we still own over 20 years later. We’re still paying property taxes and associated costs after all these years.

The situation is almost funny. We have to pay a farmer to “rent” some cattle in order to maintain our agricultural exemption on the property. While it seemed like a good investment when I was 52, I would pass on it today at age 73. Why? Those types of partnerships do not provide income, nor are they liquid. That means they fail no. 2 and no. 5 on our Five-Point Balancing Test.

We have friends who for years bought homes and apartments, fixed them up, and then rented them out. Some resold them and some converted apartments into condominiums, often doing very well for themselves.

Today these same friends want passive investments. They are quick to remind me that being a landlord means running your own small business. Their investments demanded a big time commitment; they were anything but passive.

Ask any active landlord and he will tell you of the amazing time commitment required – of the 3 a.m. phone calls from the fire department, the plumbing leaks and electrical mishaps, and the renters who never seem to pay on time. Retirees want to make money with their capital. They are not looking for a full-time job.

That’s why most folks on either side of the cusp of retirement are likely better off with investments that meet our Five-Point Balancing Test. That does not mean that rental property or buying property for appreciation is out of the question. But we’re looking for real-estate investments that are professionally managed and liquid. We’ve recently added a real-estate investment in our portfolio that meets all five points in our balancing test. Use this link to start a 90-day risk-free trial to Money Forever and get the full report on our real-estate investment.

Making money in real estate is no easier than it is in the stock market. It requires a lot of work, patience, and in some cases a lot of luck. Retirement is not the time for a “get rich quick” scheme.

We need investments that meet our five criteria. One area of real estate that sadly many retirees have been convinced is the next best thing to a “get rich quick” scheme is reverse mortgages. While not real estate investments as most people view them, they are often portrayed as a way to make easy money during retirement. In response to so many questions from readers about reverse mortgages we’ve put together a new publication called “The Reverse Mortgage Guide” to help you better understand what a reverse mortgage can and cannot do for you and whether you might be a good candidate for one. Click here to find out how to get this report for free.

test-php-789