
Currency
Since the price dive in April, gold fought its way back to $1480 before succumbing to renewed selling as general equity indices rallied and the US Dollar took off. It has traded back close to, but above, it’s April low before regaining some traction. As this was written gold is trading in the $1380 range.
As long as gold can continue to gain the recent trading activity has the look of a double bottom. This is a strong technical formation, but it won’t be considered confirmed unless gold manages to get back above its late April/early May high. This may not be easy as we enter the traditionally weak period for physical demand but there are other factors at work.
As noted in the last issue, recent market activity for gold has been the story of ETF selling and physical buying. For all the breathless angst by mainstream journalists, the physical market has actually been absorbing selling by gold ETF holders. Nice though it is to have ETF buying adding to tailwinds during bullish periods there is little doubt that owners of GLD and other exchange traded bullion funds are the “weak hands” of the bullion market.
I still view the contrarian indicators as being supportive. It’s impressive how negative they remain, with most indicators still showing, literally, zero positive sentiment. This too is reflected in mainstream media coverage. This is also 100% negative, at least the mainstream financial sites I look at.
The same is also true of brokerage house coverage, with few exceptions. I find it interesting that so many market strategists that completely missed the gold bull market – gold is about the most successful asset class this century – suddenly feel the pressing need to have an opinion about gold. If they didn’t know it was going to go up 600% you should wonder how they are suddenly experts on what it will do next.
The negative mainstream journalists have been pointing out, correctly, that we are entering the weak seasonal period for physical gold demand. Buying out of China and India has been heavy and there has been support from some central banks. April-May is usually a good demand period but things get much slower through the summer before entering the strongest period of the year in the fall.
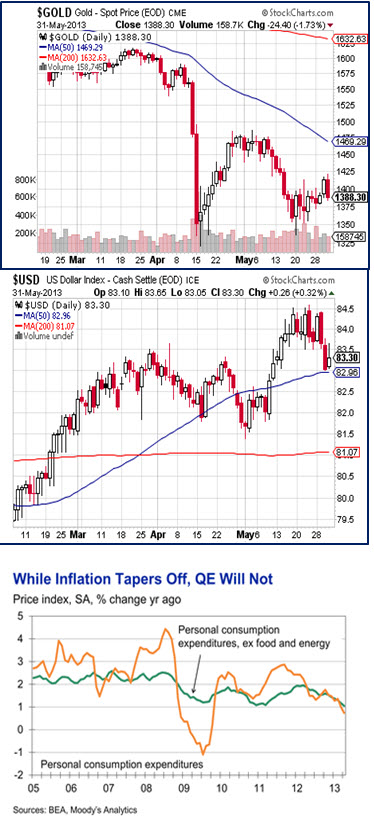
Gold’s near term performance will also depend on if and when selling in the ETF paper market slows. That in turn will depend on how other markets are doing. The charts on the following page show recent price action for gold and the US Dollar. There is little doubt that the second bottom in gold related to the incredible strength of the $US through most of May.
HRA has been telling subscribers for months that new discoveries would be a key driver for a turnaround in the junior resource market. At the same time, we have been suggesting a handful of well-financed juniors with discovery potential. And in most cases, HRA is the only publication following them.
One of those HRA focused companies, Colorado Resources, recently became a big winner for subscribers. HRA began coverage of CXO at $0.20 back in October 2012, specifically for upcoming drill programs in NW British Columbia. Since then, the stock has hit a high of $1.74 thanks to a discovery on one of those projects. HRA subscribers have seen gains of over 750% in seven months!
In recent sessions the Dollar has reached at least a short term top. This is due to some strength in the Yen, slightly better news from Europe and concerns that the US Fed would start tapering QE soon. It’s a bit odd that fear of the Fed cutting QE would lead to Dollar weakness. One would expect a currency to strengthen if there was risk that monetary expansion would slow and interest rates rise. It’s a measure of how unusual this market is that a potential end to QE would weaken the greenback. The very high volatility in the Dollar market also indicates traders with warring views.
 Bernanke’s Congressional testimony last week was a bravura performance, just the sort that gives central bankers their aura of omniscience. He managed to tell basically everyone listening what they wanted to hear without saying much of anything, really. The confusion he managed to create was obvious, with most markets swinging a percent or more in both directions in a matter of minutes.
The consensus view was that Bernanke said he plans to cut back on QE within a few months at most. That might be the case but that wasn’t what I heard. He sounded more reticent to me. Part of that is that the economy, particularly employment which is still not meeting the conditions he has set out for ending QE.
I’m not bearish on the US economy. I expect it to do better than most. For that reason I don’t want to be too optimistic about Fed money printing. That said, it’s no secret what will happen to US interest rates if the Fed is not constantly pushing bond yields down with QE buying.
10 year Treasury yields have gone up half a percent since early May. If the Fed were to announce a large cutback in bond buying yields could go even higher, and fast. Equity markets would get slaughtered in that scenario which could hurt consumer sentiment that the Fed has worked so hard to improve. It wouldn’t do the US housing market any favors either. The Fed WILL have to stop the bond buying at some point but I think Bernanke is more hesitant than some assume.
A second but related reason I think Bernanke will be cautious is inflation levels. The third chart on the previous page displays values for the Personal Consumption Expenditures (PCE) deflator index, which is the preferred inflation measure for the US Fed. The yellow line is the full index and the green line is the less volatile version that has had price changes for food and energy removed.
The PCE index has been trending lower since early 2012. It is now sitting at about 1% year-over-year change, half the range that the Fed board indicates is its comfort zone. This is the lowest level since this measure started being calculated in 1959. However optimistic consumers might be this measure shows how much slack there still is in the US economy.
Remember that Bernanke’s academic background is as a Depression scholar. He has a long held opinion that central bankers in the 1930s made the situation much worse than it needed to be by tightening monetary conditions at exactly the wrong time. He has commented on this many times in the past few years. Bernanke has made it clear he has no intention of repeating the mistakes of the 1930s.
Many that worry about QE triggering higher inflation readings and that possibility is real, eventually. I can assure you that if Bernanke is lying awake nights worrying, its deflation that’s on his mind right now. With interest rates at zero, the Fed has plenty of ammunition to defeat an inflation spike but deflation is much, much harder to reverse. Just look at Japan. Japan’s central bank is planning to double the monetary base in an attempt to get out of a deflationary spiral that has been going on for fifteen years. We all know how Japan’s economy has performed during that period.
As I said, I’m relatively bullish about the US economy so I’m not assuming disinflation will become outright deflation but the possibility can’t be ruled out. As long as that is the case I think Bernanke keeps the printing presses going. He might slow the rate of QE but I don’t see it ending until PCE has established a firm upward trend.
Market worries about QE ending may put at least a short term top on major US indices. These markets have had a very long one way run. It would be perfectly reasonable for them to correct a bit. That sort of market action might make gold ETF holders less likely to sell out. Recent volatility in equities seems to have slowed ETF sales to a trickle. If that trend continues it will be supportive of gold prices during the coming weak physical demand period.
Although gold’s move from its second bottom is hardly the stuff of legend gold miners have been showing some relative strength lately. This could be just another blip but it’s an encouraging sign. Those that wanted out of these stocks are gone and the sector could generate a good rally on any real price strength for bullion.
The juniors are faring a bit better with stronger bids on shares of companies that are actually planning to work on projects this summer. Nothing spectacular here either but also encouraging. I still expect the summer to have a positive tone though that heavily depends on a few explorers continuing to deliver good news.
The explorer holding everyone’s attention, Colorado Resources, is updated below. In addition, I have appended a transcript of an interview I recently did with Colorado CEO Adam Travis. Its good background and well worth reading and also part of the reason this Dispatch is a little late and very long. CXO has a very strong technical management group that are both well respected and well liked through the industry. Only time will tell if North ROK is a major discovery but it’s already roused the animal spirits on the Venture exchange. However things end for North ROK it’s nice to see the good guys win one for a change.
Ω
Eric Coffin, editor of HRA Advisories, recently sat down with President and CEO of Colorado Resources, Adam Travis, to discuss more about the company, its recent successes and why investors should stay tuned to this story. Click here to download Eric’s interview with Colorado Resources now!
We think there will be more discovery winners but it’s still a “show me” market. HRA understands that which is why we are offering you a chance to try out HRA for three months for only $10.00!
Published by Stockwork Consulting Ltd.
Box 85909, Phoenix AZ, 85071 Toll Free 1-877-528-3958

The only thing that’s free right now is the air that we breathe. Other than that it costs to manufacture every object and commodity in the world. It takes a certain amount of money to extract a barrel of crude in Saudi Arabia, to make a car in Detroit, or produce an iPad in China.
There is also a certain cost to producing an ounce of gold. It doesn’t grow on trees. Tiny nuggets don’t rain down from the sky. It costs to explore. It costs to extract. It costs to finance loans and it costs to pay royalties. There are additional costs such as administration, equipment, environmental remedies and others. These are called the “all-in” costs.
Mines age and get depleted and extracting the gold gets more challenging and costly over time. Average grades of ore have fallen by 30% since 1999, according to GFMS, a consulting group, making it more difficult to extract gold and from ever greater depths. Finding new deposits is becoming harder. If in 2002 gold miners spent $500 million on exploration, by 2008 they were spending $3 billion, but finding much less.
So how much does it cost to make an ounce of gold today?
That is an interesting question because just like a car manufacturer will not sell a car for less than it costs to produce it, neither will mining companies sell gold for less than it takes them to extract it from the ground. And the cost of production is rising due to lower grade ore and the rise in the costs of compliance and remediation. As gold prices soared over the past decade, production costs inched higher including the prices for equipment, materials, labour and energy.
According to a recent Forbes Magazine article both Barrick Gold and Goldcorp, the largest mining companies, project that their all-in cash costs will be between $1,000 and $1,100 an ounce for 2013. In 2012, mining companies reported all-in costs such as: GG $1,082, Barrick Gold, 1,227, Yamana Gold $1,247, IAG $1377, and Agnico-Eagle, $1,343.
According to the Forbes article, a survey of 60 gold mining companies, apparently less efficient than the giants, resulted in an average production cost of $1,391. That is uncomfortably too close to where the price of gold was at the bottom this year.
Of course, it’s possible that if the price of gold were to drop, mining companies could become more efficient and thus cuts their costs and be more profitable. It makes sense that the inverse may be true as well, that as prices were rising, mining companies expanded and perhaps operated at high capacity the mines that are the most expensive to run.
World gold production is currently around 2,500 metric tons per year. The all-time high was reached in 2001, with 2,600 metric tons of gold production worldwide. It is interesting to note that production in 1900 was around 400 metric tons per year when the price per ounce was about $19 an ounce.
A Financial Times story last month says that earnings data are confirming that the decade-long expansion in the mining services industry is all but over. The reduction in mining investment is severely affecting demand for equipment such as trucks, shovels and underground machinery. Caterpillar, the world’s largest manufacturer of earthmoving equipment, has reported a 45 per cent drop in profits in the first quarter.
Does the cost per ounce of mining an ounce of gold provide a floor for the price? One can argue that theoretically the price could go lower than the cost of manufacture, but it couldn’t stay there for long. Mining companies would have no incentive to extract the gold and it would remain buried underground. They would have to cut capital spending, defer exploration and capital development programs and probably cut dividends. There would be a decline in supply and after a while, when demand would outstrip supply, the price would climb up again.
The abovementioned facts suggest that sooner or later the price of gold (and – with it – the whole precious metals sector as well) will start to rise again, to cope with the rising costs. But these facts alone cannot help us estimate the turning point itself – let us then move on to the technical part of today’s essay to see what immediate future holds for the yellow metal.
The precious metals sector moved higher on Thursday, but the question is if the move was significant enough to change the short-term outlook for gold and silver. It has been – as we wrote in our previous articles – bearish, as far as short and medium term are concerned. Let’s examine the situation.
- There was a breakout above the declining resistance line in gold and silver – however, it was invalidated on Friday.
- The volume in GDX was significant during Thursday’s rally but it was surprisingly small in case of GLD ETF. It was average in case of the SLV ETF. Therefore, the breakout (even though it was not invalidated on Friday in case of the mining stocks) is not that reliable in our view.
- The USD Index declined quite significantly on Thursday and yet we saw a rather average move higher in gold, so we decided to analyze the relative performance (USD – precious metals) more thoroughly. USD closed approximately at the 83 level, something it had previously done on May 10. On May 10 gold, silver and the HUI Index closed at: $1,448, $23.88 and 280, respectively. This means that mining stocks are where they were back then and gold and silver are considerably lower now. This does not bode well for the precious metals in the short and medium term.
- We have previously mentioned the reverse parabola in the GLD to GDX ratio which meant that miners were declining more and more rapidly relative to gold. This parabola was broken on Thursday, which is a bullish sign – not a strong one, but still.
- The move higher in silver just ahead of the cyclical turning point is actually a bearish phenomenon. If the price is to reverse its direction shortly, then if the most recent move is up, then the reversal should take the market lower. The previous cyclical turning point in silver worked in this way and it worked only too well. Silver’s price plunged at the cyclical turning point after moving slightly higher – to the 20-day moving average. The chart below illustrates the situation (charts courtesy by http://stockcharts.com.)
Naturally, silver (and, naturally SLV ETF) moved lower on Friday, which may mean that the next downleg has already started.
Summing up, at this time we still think that the breakout in precious metals is not in and that lower values of silver will be seen before the next big rally emerges. So far the USD-gold link is a strong indication against going long and we don’t think that the odds for the decline have really changed. Not only have we seen a long-term breakout in the USD Index, but we also see that gold and silver are responding more significantly to dollar’s rallies than to its declines.
Thank you for reading. Have a great and profitable week!
Przemyslaw Radomski, CFA
Founder, Editor-in-chief
Silver Investment & Gold Investment Website – SunshineProfits.com
* * * * *
Disclaimer
All essays, research and information found above represent analyses and opinions of Przemyslaw Radomski, CFA and Sunshine Profits’ associates only. As such, it may prove wrong and be a subject to change without notice. Opinions and analyses were based on data available to authors of respective essays at the time of writing. Although the information provided above is based on careful research and sources that are believed to be accurate, Przemyslaw Radomski, CFA and his associates do not guarantee the accuracy or thoroughness of the data or information reported. The opinions published above are neither an offer nor a recommendation to purchase or sell any securities. Mr. Radomski is not a Registered Securities Advisor. By reading Przemyslaw Radomski’s, CFA reports you fully agree that he will not be held responsible or liable for any decisions you make regarding any information provided in these reports. Investing, trading and speculation in any financial markets may involve high risk of loss. Przemyslaw Radomski, CFA, Sunshine Profits’ employees and affiliates as well as members of their families may have a short or long position in any securities, including those mentioned in any of the reports or essays, and may make additional purchases and/or sales of those securities without notice.


»» Bonds sold off, and yields jumped across regions. Equity markets handled the volatility reasonably well, except Japan’s Nikkei and stocks that trade as “bond proxies.”
»» Margin Mania: One of the few objective, quantitative measures of investor sentiment rose to an all-time high. What does its trajectory usually mean for the stock market? (page 3)
»» Global Roundup: Overview of changes to EU budget deficit rules, including challenges facing France; updates on Canada, Japan, and China. (pages 3-4)
For the complete report as well as Daily Updates CLICK HERE.

“Our intermediate term systems are on a buy signal”
Todd Market Forecast for Monday June 3, 2013
Available Mon- Friday after 6:00 P.M. Eastern, 3:00 Pacific.
DOW + 138 on 450 net declines
NASDAQ COMP + 9 on 250 net advances
SHORT TERM TREND Bearish
INTERMEDIATE TERM TREND Bullish
Editor’s note. We E mailed the June newsletter earlier today. If you did not receive it, let us know.
STOCKS: The reason given for the buying on Monday was a weak manufacturing number. This, it is opined, will keep the Fed printing money. I have always believed that this is so wrong. The market would rather have a weak economy than a strong one because it keeps the Fed easy.
Actually, I think it rallied because of the very short term oversold condition which was the reason for our System 2 buy signal, but it was a poor quality uptrend because there were more declining issues than advancing ones.
GOLD: Gold had a good day. Up over $18. We’re still positive on this market, but the rally off the lows has been a bit labored.
CHART: We were non stop bullish for months because breadth was out performing the popular averages. That is no longer the case. The advance decline was negative today in spite of a rally by most indices. That shows that most stocks are not participating. We also like the fact that no one is talking about this internal weakness.

TORONTO EXCHANGE: Toronto was down another 41.
S&P\TSX Venture Comp: The Venture Comp was higher by 7.
BONDS: Bonds had a modest rebound.
THE REST: The dollar dropped. Silver, copper and crude oil had decent bounces.
BOTTOM LINE:
Our intermediate term systems are on a buy signal.
System 2 traders We bought the E-mini S&P 500 at 1633.00. We Bought the SSO at 79.63. Sell at the close on Tuesday.
System 7 traders We are in cash. Stay there on Tuesday.
Stock investors We are long Intel from 21.61 Let’s move the stop to 22.50.
NEWS AND FUNDAMENTALS:
The ISM Mfg. Index came in at 49.0, less than the expected 51.0. Any reading less than 50.0 indicates a contraction in manufacturing. Construction spending rose 0.4%. The expectation was for a rise of 1.0%. On Tuesday we get the trade deficit.
We’re on a sell for bonds as of May 10.
We’re on a sell for the dollar and a buy for the euro as of May 20.
We’re on a buy for gold as of May 20.
We’re on a sell for silver as of May 15.
We’re on a sell for crude oil as of May 29.
We’re on a buy for copper as of May 3.
We’re on a buy for the Toronto Stock exchange TSX as of April 24.
We are on a sell for the S&P\TSX Venture Comp. as of Jan. 29.
 INDICATOR PARAMETERS
Monetary conditions (+2 means the Fed is actively dropping rates; +1 means a bias toward easing. 0 means neutral, -1 means a bias toward tightening, -2 means actively raising rates). RSI (30 or below is oversold, 80 or above is overbought). McClellan Oscillator ( minus 100 is oversold. Plus 100 is overbought). Composite Gauge (5 or below is negative, 13 or above is positive). Composite Gauge five day m.a. (8.0 or below is overbought. 13.0 or above is oversold). CBOE Put Call Ratio ( Below .80 is a negative. Above 1.00 is a positive). Volatility Index, VIX (low teens bearish, high twenties bullish), VIX % single day change. + 5 or greater bullish. -5 or less, bearish. VIX % change 5 day m.a. +3.0 or above bullish, -3.0 or below, bearish. Advances minus declines three day m.a.( +500 is bearish. – 500 is bullish). Supply Demand 5 day m.a. (.45 or below is a positive. .80 or above is a negative).
No guarantees are made. Traders can and do lose money. The publisher may take positions in recommended securities.


-
I know Mike is a very solid investor and respect his opinions very much. So if he says pay attention to this or that - I will.
~ Dale G.
-
I've started managing my own investments so view Michael's site as a one-stop shop from which to get information and perspectives.
~ Dave E.
-
Michael offers easy reading, honest, common sense information that anyone can use in a practical manner.
~ der_al.
-
A sane voice in a scrambled investment world.
~ Ed R.
Inside Edge Pro Contributors

Greg Weldon

Josef Schachter

Tyler Bollhorn

Ryan Irvine

Paul Beattie

Martin Straith

Patrick Ceresna

Mark Leibovit

James Thorne

Victor Adair