
Stocks & Equities
Short term strength in most equity markets and sectors will provide an additional opportunity to reduce equity exposure. Equity markets around the world effectively peaked on May 22nd. Now they are short term oversold and showing signs of

Gold keeps crashing. Ditto for silver. So the question is: Are we near a bottom yet?
I can’t tell you precisely what the low will be.
No one can. All I can tell you is that …
1. Timing-wise, we are very close to what could be the final low for precious metals in their two-year long interim bear market.
2. Price-wise, we are also very close. As I’ve told you before, long-term support levels come into play at the $1,170 to $1,200 area in gold.
In silver, the long-term support levels are scaled in from $17.70 down to $16.33. Silver’s now lagging just behind gold, but it’s almost there now too.
 So yes, a bottom is almost here.
I say almost, because in any market, extreme movements are often the most difficult to predict. There’s a chance, for instance, that gold could fall to as low as $1,110, or even $1,060. Silver to as low as $14.
I don’t think we’ll see them get that low, but if we do, so much the better.
And if we don’t, that’s fine too. We are so close to a bottom that I can literally taste the final lows, not to mention the huge profit opportunities that lie ahead.
That said, right now, there are several steps I believe you must implement, immediately:
1. If you followed my suggestions to buy inverse ETFs on gold and silver and have not yet taken your profits, bag them now.
2. Don’t start loading up on mining shares. They most likely have not bottomed. Plus, as the stock market pulls back, mining shares will remain under pressure even if gold and silver start to rally again.
3. Build up your cash for buying precious metals for the long-term. Everyone should own some gold as insurance against the upcoming collapse of the global monetary system, which I believe will occur within the next three years. So will the governments of Europe, Japan, and the United States.
You simply must have the insurance that gold can offer you when that happens. The price of gold is bound to soar to over $5,000 an ounce.
4. Be ready to speculate in the precious metals markets with your risk capital. More money could be made in the precious metals markets in the next few years than in the last 11.
Now, some questions I’ve recently received from readers,
and my answers:
Q: Larry, gold and silver have been hit so hard, will they ever be able to get off the mat again?
A: Think of the markets like a trampoline. Not a mat. The higher the energy level and downward force during corrections, the higher the bounce.
Here are two major examples to drive my point home:
First, consider the stock market crashes of 1987 and 2008/2009.
In 1987, the crash in the Dow was the worst ever, yet it hit new highs by the end of 1989. The collapse in 2008/09 gave stocks enough energy to bounce back to the upside and ultimately hit record new highs.
Second, consider gold during its 2008 crash. The same thing happened. Gold crashed from over $1,000 down to roughly $650, and then bounced higher all the way to $1,920.
So don’t worry about the metals getting off the mat. They’re soon going to bounce off the trampoline higher again.
Q: Don’t you think the world should go back to a gold standard?
A: Absolutely not. First, the gold standard is inherently deflationary. Deflation is the worse of two evils, inflation being the other side of the coin.
Second, the gold standard did nothing to prevent boom and bust cycles. Even under the gold standard there were bubbles and imploding bubbles. There were bank failures, recessions and depressions, and periods of high inflation.
So no, I am not in the camp that believes the world needs a gold standard. A new monetary system with much less dependence upon debt as well as some type of single-world currency for trade purposes, yes. But a gold standard, no.
Q: When are the manipulators, the Fed and the big Wall Street banks, going to stop shorting gold and silver?
A: In my opinion, that’s all hogwash. No one can manipulate a market to such an extent as we’ve seen in gold and silver. Gold and silver are simply in an intermediate-term downtrend.
Those who keep conjuring up manipulation stories are those who simply cannot accept the fact that gold and silver were due for a severe correction.
As for those who have been shorting the metals, be thankful for them. They will be the ones providing the fuel to put a bottom in place and send the metals higher again. Why? Because they have to cover their shorts.
Q: Don’t you think the paper gold and silver markets are destroying the physical markets?
A: This is more nonsense spread by those who simply want to sell you gold or silver to earn a fat commission while not giving one hoot about your financial well-being and the right time and price to buy.
If it were true, that the paper market was negatively impacting the physical market, the price of physical gold and silver would not be following the paper market lockstep (or vice versa). With minor variations due to interest rates and volatility, the two markets parallel each other.
Q: Once gold bottoms, what is its next move?
A: We should soon see a strong rally back to the point of the sharp breakdown. Back up to the $1,550 to $1,600 level. Then once that is taken out, we’ll be on solid ground for new record highs in the months and years ahead.
Stay tuned and best wishes,
Larry

Stocks managed their third session higher as of Thursday June 27th and its too late to jump onto that move. Major indexes and leading stocks have rebounded into resistance along with a few key moving averages. The next 1-3 days favor a pause or pullback at the least simply because of the selling momentum and multiple resistance levels being tested. It is only natural for traders and investors to pull some money off the table or short at these levels.
Stepping back seven days and looking at the overall stock market we have seen a substantial drop in prices across the board. A Ton of stocks have formed their first impulse thrust to the downside which is typically what happens when a stock market is in a topping process (Stage 3 Distribution). The type of damage we had cannot be fixed overnight. This will be a process if it is to resolve to the upside and price action will remain wild (volatile).
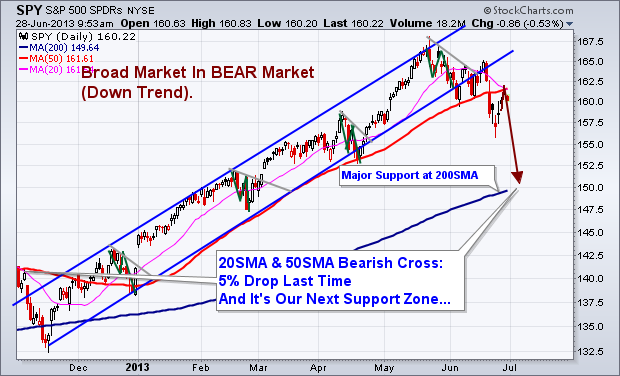
Major Points to Be Aware Of:
1. 20 Simple Moving Average is crossing below the 50SMA. Last time this took place it triggered a 5% drop in the SP500.
2. Price has bounced for three consecutive days. This typically puts the odds in favor for a pullback.
3. Price bounced and hit it’s head on the 20 and 50 moving averages on Thursday (RESISTANCE).
4. Market Time Cycles are in a decline phase meaning there will be a negative bias and seller will be actively pulling price lower on bounces.
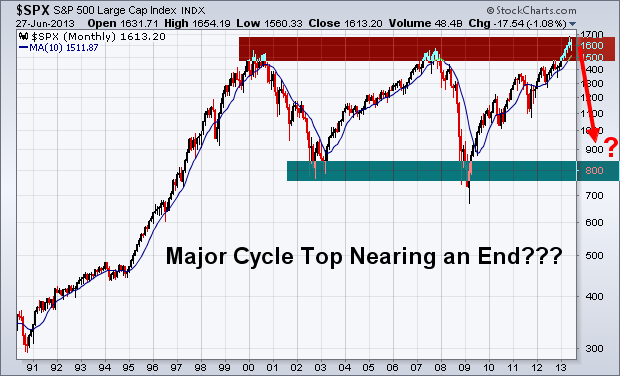
5. Major Long Term Chart looks favorable for a bear market to start which may last 12 months. If so this is just the beginning of some scary yet highly profitable potential trades in the coming year. Stocks fall 3-7 times faster than they rise…
Daily SP500 Trend & Analysis Chart:
Long Term SP500 Trend Chart:
BEARISH SP500 Price & Volume – 60 Minute Intraday Chart:
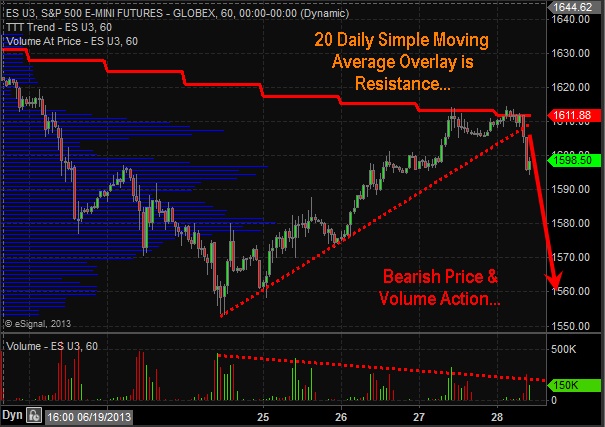
Looking at these charts from a long term, intermediate and short term basis the odds are favoring lower prices. Being short stocks or buying inverse ETF’s is the current play for the market. But analysis and trends are subject to change depending on price and volume action each week. Do not get your heart set on the BIG picture outlook of a yearlong selloff. That could prove to be dangerous. We take this market one bar or candlestick at a time and trade based on current short term analysis.
Get My Trade Alerts & Pre-Market Video Analysis Every Day: www.GoldAndOilGuy.com
Chris Vermeulen

In last weekend’s missive I discussed, at length, the initial “sell” signal that was triggered by the markets decline. I also specifically stated that:
“[The] initial ‘Sell Signal’ is a warning that a further correction is likely to come. This is a wakeup call to pay attention to your portfolio. However, this is not a signal to ‘panic sell’ and make emotional based investment mistakes. When all of these signals align it is always in conjunction with a more significant market correction. Currently, the indicators are issuing a very strong ‘warning’ and it is likely that within the next couple of weeks we will see a deeper correction occur.”
However, this past week the market rallied strongly mid-week to push the market higher by .87% for the week. As I stated last week it would take a VERY strong rally to keep the secondary sell signal from being triggered.
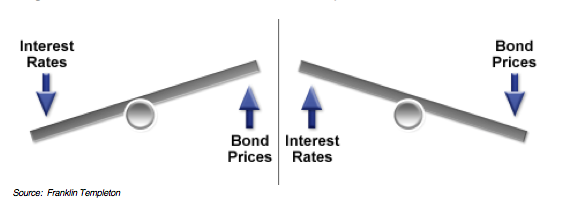 This week’s missive will cover “how bonds really work” in your portfolio, as well as, update our sell signals and portfolio instructions and recommendations.
If you missed last week’s missive I wanted to repeat last week’s updates:
– “Streettalklive.com” is merging into “STAWealth.com.” Only the look is changing – all the great features will remain the same.
– This weekly newsletter will actually become (3) different HTML documents that you will be able to print, read on your tablet and phone, share with friends and post to your social network.
-
- Portfolio Management: Market analysis & Investing Strategy
- Market/Sector Analysis: Analysis of 15 major sectors /markets
- 401k Plan Manager: Expanded and improved model/analysis
– Also, more frequent postings to the daily blog that are short reads, quick analysis or video/audio analysis of investing ideas, economics, strategies or tips.
…….read pages 2-17 HERE
First, let me say I’ve been way too early on this call. I’ve been wrong and don’t deny it. You have to own up to mistakes, learn from them and be humble. Moving along, the precious metals sector is likely days or potentially hours away from a bottom. With respect to Gold, we are targeting $1180 or slightly below with $1080 as a worst-case scenario. The stocks are a bit more instructive for several reasons. First, they have a more consistent history and second, the stocks bottomed ahead of Gold (using daily closing prices) at the major lows in 2000-2001 and 2008. Using data from the Barron’s Gold Mining Index (BGMI) and the HUI Gold Bugs Index (HUI) we put together a chart of all of the major declines in gold stocks. We also annotated the ensuing recoveries.
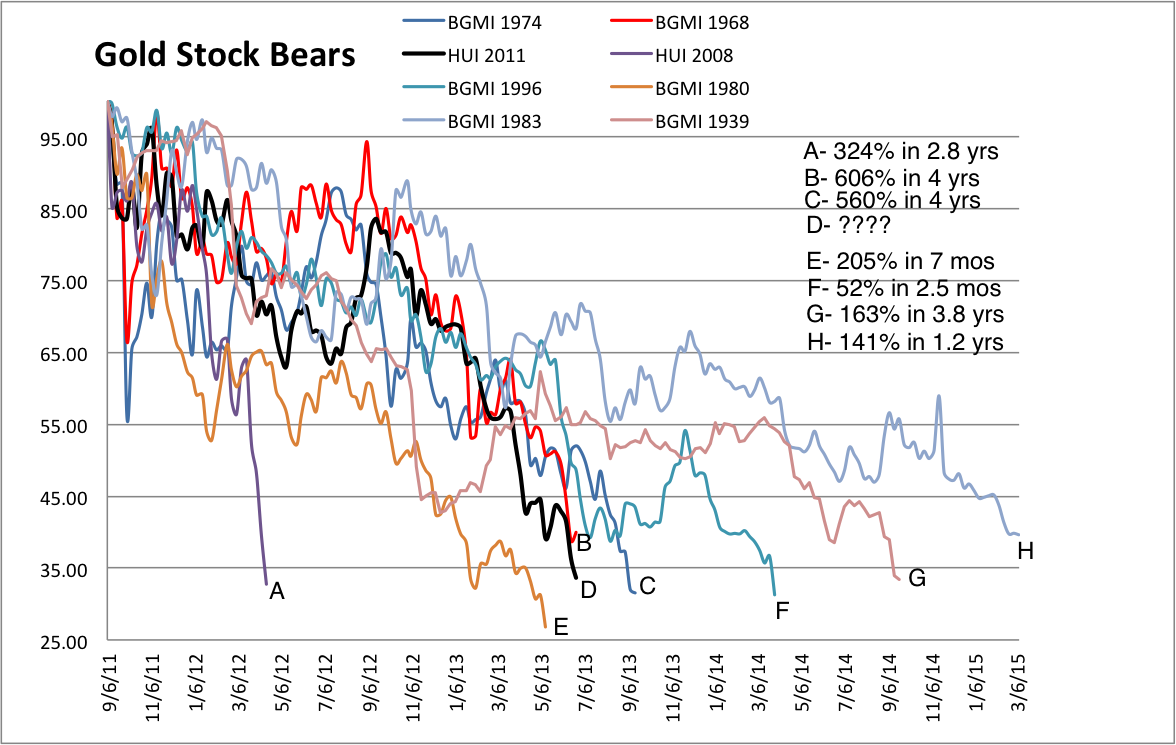
Downturns A, B and C occurred in a secular bull market while E occurred following the 1980 high. Note that the current downturn (D) is very similar to B,C, and E in terms of length and depth. A,B and C were followed by spectacular recoveries and even E resulted in a 205% rebound in only seven months. G and H also produced very strong rebounds. Also, Mebane Faber has provided some data that show how a particular market can perform after enduring 60% to 90% declines. Source Link.
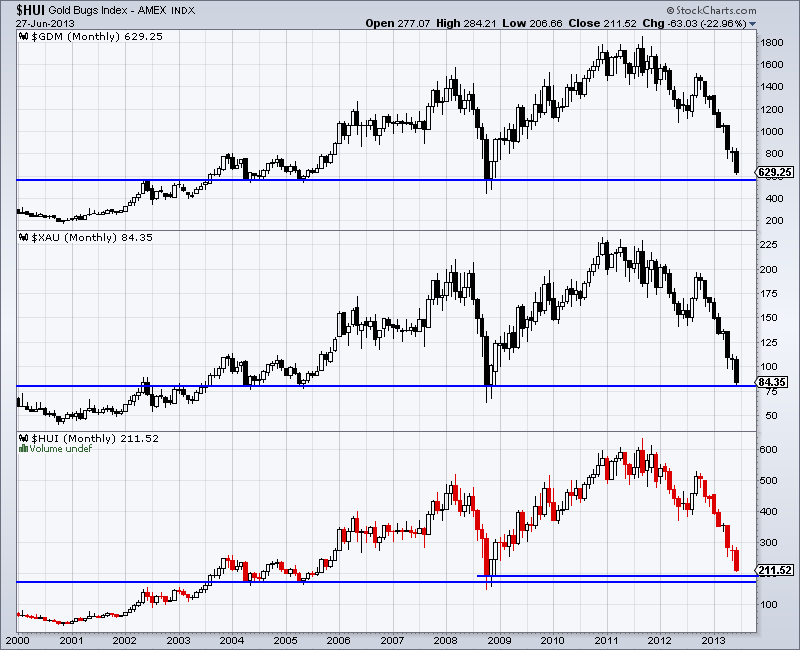
Below we plot monthly charts of GDM (GDX), XAU and HUI. The sector appears to be one more or perhaps two more down days away from touching major, multi-year support. One learning point for me is that when a market is in a severe decline, you have to wait for major support. That matters far more than negative sentiment or the secular trend.
The mainstream continues to be bearish on this sector and in some places, misinformed about the sector in general. Josh Brown is a widely read mainstream blogger who also appears on CNBC daily. I happen to agree with a fair amount of what he writes and his style is refreshing. He’s also been bearish on the gold stocks for a while and I give him credit for that, while I became bullish way too early. A few days ago he posted some very negative thoughts on the sector following a television appearance by a gold fund manager who struggled to make a positive case for gold stocks. To be fair to the manager, one shouldn’t expect to find any in-depth or long-term actionable analysis on a show known as “Fast Money,” which is far more concerned about the next two days than the next two years.
Brown’s blog post not only was devoid of any real fact-based analysis but highlights how the mainstream continues to misunderstand precious metals. Given that he blogs, appears on tv daily and has to meet with clients, he may not have the time to do exhaustive historical research. Furthermore, I was quite surprised to see his post highlighted in Seeking Alpha as if it provided any worthwhile analysis.
He disputes the fact that Gold benefits from cracks in the financial system and asserts that nobody bought Gold when the cracks appeared. He goes on to say that if the stock market crashes, gold stocks crash also.
If one is focusing on a very tiny period, then this is true. However, the cracks actually appeared in early 2007 when Gold was trading in the mid $600s. It reached $1000 in February 2009 before the bear market in stocks ended. The gold stocks didn’t perform as well but they bottomed five months before the stock market and by late 2009 had rallied back to their pre-crisis highs. (They performed even better after 1929). And this is the entire sector. Most industry insiders say it is a terrible idea to buy the entire sector. Mainstream-oriented advisors like Brown play ETFs as they may not have the time to perform the research necessary to generate better returns. Furthermore, what is this obsession with such a small period of time? I don’t know of anyone buying precious metals just to cash in on a potential immediate move. They buy because of long-term trends.
Here is Brown’s biggest mistake. While gold stocks did crash in 1929 and 2007 (but quickly recovered in both cases), gold stocks can gain fantastically when the stock market is in a cyclical bear. The correlation between the two can take many different forms but when the two are negatively correlated it can be hugely positive for gold stocks.
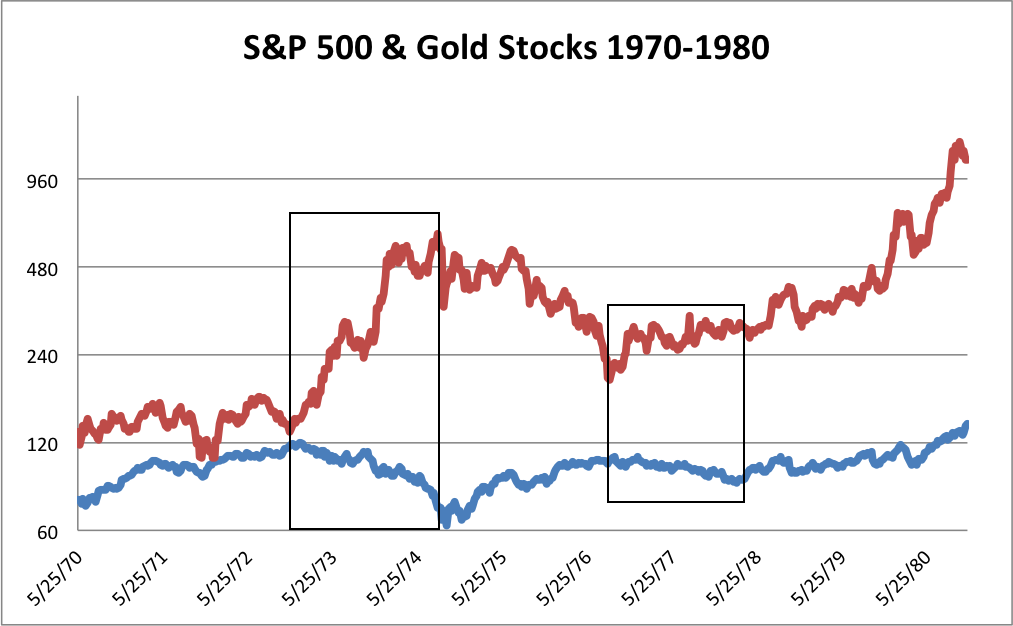
The two were negatively correlated from 1972 through 1978. The gold stocks turned down in the middle of 1972 while the S&P 500 continued to make new highs for almost six months. While the S&P had its nasty bear market, the gold stocks absolutely exploded by nearly 400%. Once the stock market bottomed, the gold stocks consolidated beneath their highs. As the recovery gained steam, the gold stocks brokedown. From 1976-1977 the gold stocks recovered as the S&P declined about 20%.
The next example is from the late 1990s until late 2002. The two markets were negatively correlated during the end of the bull market and that correlation remained well intact until late 2002. The HUI Gold Bugs Index surged roughly 600% from late 2000 to 2003.
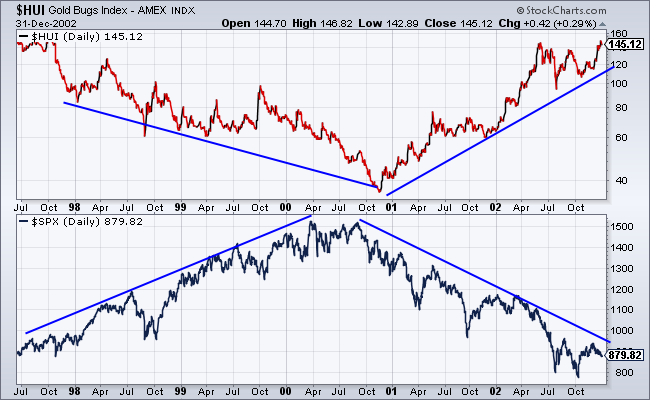
This is an extremely important point. The gold stocks were positively correlated with the stock market prior to the 1929 and 2008 crashes. That’s why they crashed with the overall market. However, prior to the cyclical bull markets which began in 1973, 1977 and 2000, the gold stocks were negatively correlated with the stock market. That’s also been the case for the past 22 months.
Brown concludes:
The game is up and all that’s left is denial what’s happening right in front of people’s faces. If your job is to run a gold fund though, what are you going to say? If you’re the strategist at a Canadian investment bank that’s doing gold miner financing and shit, what choice do you have but to be “constructive”? It’s, frankly, depressing. I hope for a huge bounce from the miners so that people who’ve made a big mistake can use that bounce to make some changes.
Had Brown studied this sector and its history (and he can quickly look at our first chart) he’d see that these types of declines are like clockwork and so too are the massive recoveries. In terms of the length and depth of this decline it is remarkably similar to both the declines that occurred within the 1960-1980 secular bull market. In terms of depth its nearly as much as the 2008 crash. Our first chart illustrates that this downturn is in-line with an overall secular bull market. It’s not the end, it’s just the start of the last run.
The game that is up or will be up shortly is the cyclical bear market in precious metals as well as the cyclical bull market in the S&P 500. When the S&P 500 and economy struggle it’s going to be glorious for precious metals. The authorities in the US and abroad will do everything they can to prevent another bear market and recession. The result will be a global currency crisis, higher inflation and stock markets won’t go up. Don’t think it can happen? You might want to review history and take a long view. Frankly, when Mom and Pop investor are stuck in stock funds for the next several years with barely any return and no exposure to precious metals- that will be depressing. I hope people don’t make that big mistake. If you’d be interested in our analysis on the companies poised to recover now and lead the next bull market, we invite you to learn more about our service.
Jordan Roy-Byrne, CMT

-
I know Mike is a very solid investor and respect his opinions very much. So if he says pay attention to this or that - I will.
~ Dale G.
-
I've started managing my own investments so view Michael's site as a one-stop shop from which to get information and perspectives.
~ Dave E.
-
Michael offers easy reading, honest, common sense information that anyone can use in a practical manner.
~ der_al.
-
A sane voice in a scrambled investment world.
~ Ed R.
Inside Edge Pro Contributors

Greg Weldon

Josef Schachter

Tyler Bollhorn

Ryan Irvine

Paul Beattie

Martin Straith

Patrick Ceresna

Mark Leibovit

James Thorne

Victor Adair