
Timing & trends
Last week the price of the white metal climbed to an over two-week high after U.S. Federal Reserve Chairman said its huge stimulus program would stay in place for some time. Investors are now focused on Ben Bernanke once again.
“The main focus is Bernanke’s testimony to the Congress, and that should really give us more guidance to whether tapering will start in September or December,” Danske Bank analyst Christin Tuxen said.
Could this above-mentioned event trigger a breakout above the important resistance level? Or maybe the worst is not behind us and we will see furtherdeclines in silver?
Recently, there has been much talk about gold’s price. This has pushed silver a little bit to the side, which we don’t think is quite fair. Because of that, we devote our today‘s analysis solely to the white metal. Let’s take a look at the charts and find out what’s the current outlook for silver.
Today we will start with the analysis of the silver long-term (charts courtesy byhttp://stockcharts.com)
Click HERE or on Chart for Larger Image

In this week’s very long-term silver chart, we have a situation somewhat similar to what we saw happen with gold last week. Silver also moved higher and attempted to move above the declining resistance line, finally closing right at it (a few cents below the $20 level) without breaking it.
Technically, at this time we have no breakout, so the situation remains bearish (even the short-term trend). The downtrend will remain in place here unless silver can increase and hold a breakout above the $20.70 price level (this is a short-term resistance level based on the intra-day highs).
In the recent days we haven’t seen such action. Therefore, in our opinion last week’s rally was nothing more than a contra-trend bounce.
Once we know the current situation in silver, we think it would be interesting to revisit the silver-to-gold ratio to see how the two are valued relative to each other.
Click HERE or on Chart for Larger Image

In the silver-to-gold ratio chart, we still see no signal of a bottom.
As we wrote in our essay on gold, stocks and the dollar on June 26, 2013:
“(…) the final bottom for the white metal is often preceded by a big underperformance of silver to gold.”
We have not seen signs of such action last week, so it seems that the final bottom is still ahead of us.
If that’s the case and the white metal is about to move lower, let’s take a look at our final chart today and find out if it confirms the bearish clues.
In this medium-term SLV ETF chart we see that silver is now slightly above the declining resistance line. We should pay attention that this level coincides with two more resistance levels.
The first is the 20-day moving average, the red slope in our chart, which has proven to be an important resistance line since it was broken in February. It has been tested a number of times since, and such is the case once again. All the previous cases were followed by downswings.
The other level is the first Fibonacci retracement level, 38.2% based on the June decline. From this point of view we can clearly see that silver did not move above these two resistance levels.
At this point, we think it’s worth to mention another bearish indication.
Last week we saw a move to the upside for silver on relatively weak volume. In the recent past, this was also seen before bigger declines. This was the case in early June, late May, early May and also in April. It seems that we have this once again (the volume we saw yesterday was exceptionally tiny).
Summing up, silver moved higher last week and rose on Thursday to its highest level since the June 28 low. Despite this growth, there was no breakout and the downtrend is still valid. We think that the next move for silver will be down and in tune with its recent and current short-term trend.
Thank you for reading. Have a great and profitable week!
Przemyslaw Radomski, CFA
Founder, Editor-in-chief
Gold Investment & Silver Investment Website – SunshineProfits.com
* * * * *
Disclaimer
All essays, research and information found above represent analyses and opinions of Przemyslaw Radomski, CFA and Sunshine Profits’ associates only. As such, it may prove wrong and be a subject to change without notice. Opinions and analyses were based on data available to authors of respective essays at the time of writing. Although the information provided above is based on careful research and sources that are believed to be accurate, Przemyslaw Radomski, CFA and his associates do not guarantee the accuracy or thoroughness of the data or information reported. The opinions published above are neither an offer nor a recommendation to purchase or sell any securities. Mr. Radomski is not a Registered Securities Advisor. By reading Przemyslaw Radomski’s, CFA reports you fully agree that he will not be held responsible or liable for any decisions you make regarding any information provided in these reports. Investing, trading and speculation in any financial markets may involve high risk of loss. Przemyslaw Radomski, CFA, Sunshine Profits’ employees and affiliates as well as members of their families may have a short or long position in any securities, including those mentioned in any of the reports or essays, and may make additional purchases and/or sales of those securities without notice.

The Biggest Government Lie in History?
Welcome to the world’s most secure vault…
Completed in 1936, it’s encased in 16,000 cubic feet of granite and 4,200 cubic yards of cement.
The vault door weighs an astounding 22 tons and is made of a 21-inch-thick material that’s resistant to drills, torches and explosives.
It comes with a bombproof roof, too.
Additional layers of physical security include: video cameras, minefields, barbed wire, electric fences, armed guards – even unmarked Apache helicopter gunships.
Oh, and it’s stationed on a 109,000-acre U.S. army post.
So what’s inside?
Well, it depends on who you ask.
The government will tell you that almost 5,000 metric tons of gold, or roughly 3% of all the gold ever refined throughout human history, is safely sealed inside the vault.
Others will tell you that the vault (the United States Bullion Depository – known as Fort Knox) is totally empty.
What if the skeptics are right? And all this protection is just an elaborate cover-up?
What if there’s actually no gold at Fort Knox?
Let’s dig a little deeper…
Send the Auditors to Fort Knox!
In light of the revelations from NSA whistle-blower, Edward Snowden, it’s even harder now to trust Washington politicians.
The government has been doing a lot of things that it said it wasn’t for years (i.e. – spying on citizens). And that naturally makes me wonder what else it might be up to.
I’m not alone, either.
Three-time presidential candidate, Ron Paul, has long questioned the amount of gold at Fort Knox. He even went as far as introducing legislation in 2011, which proposed an audit.
One thing we can all agree on is this: Lack of transparency always leads to corruption. So Paul’s audit demand seems reasonable. Especially considering that the world’s publicly traded companies must undergo annual audits. Why should the Federal government be immune?
Amazingly, though, the last audit of Fort Knox occurred in 1953, right after President Eisenhower’s inauguration. Except no outside experts were permitted, and only about 5% of the gold was tested. So there’s been no full audit in over 60 years!
Over that time, however, the government has sold its gold – reducing its holdings from about 20,000 metric tons in the 1950s, to the current level of 8,133 metric tons.
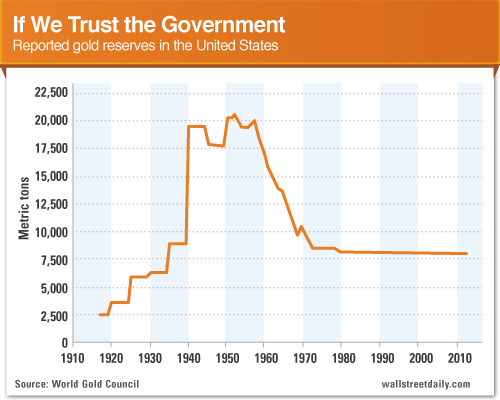
So are we just supposed to trust that the government stopped selling? In this day and age, that’s a pretty tall order!
Just ask the Germans.
In late 2012, Germany’s federal court ordered its central bank to conduct annual audits and physically inspect gold deposits worldwide – including in the United States. For decades, the Bundesbank had relied on written confirmation.
Why the sudden change of heart? It makes me wonder…
A More Fundamental Question
Let’s give the government the benefit of the doubt for a (brief) moment and ask: Why do we even have gold reserves?
The gold bars, packed tightly into a secure vault, were supposed to give us confidence in our country’s currency. But we cast off the gold standard in 1971 and stopped redeeming currency for gold. So nowadays, gold reserves are nothing more than an asset on the Fed’s balance sheet, not an integral part of our monetary system.
So what gives with clinging tightly to it?
Fed Chairman Ben Bernanke says that it’s the result of “long-term tradition.”
Mark Zandi, Chief Economist at Moody’s Analytics says, “It may lend some confidence to investors that we have large gold reserves. But it’s more symbolic than substantive.”
Meanwhile, former Fed Chairman Alan Greenspan reportedly said, we hold onto the huge reserves “just in case we need it.” (That’s comforting.)
In the end, if there’s no real purpose for the gold reserves, then why worry about an audit at all?
A Crisis of Confidence
One reason the government might not want an audit is because it would lend importance to an asset that it swears is unimportant.
Or as hedge fund manager James Rickards puts it, “An audit would give gold too much credit and start to erode the official propaganda that gold is not a monetary asset. After all, no one audits the number of acorns in the national parks… They are too unimportant.”
Makes sense. Yet, I don’t think that’s substantive enough to justify the refusal.
What’s more likely is that an audit would raise more questions than it answers. Like, if the gold is really there, does it really all belong to the government?
I say that because central banks routinely lease or lend out gold. But current reporting guidelines don’t require them to distinguish between gold owned outright and gold swapped with another party.
Instead, the U.S. Treasury simply states its holdings as “gold (including gold deposits and gold swapped).” Or in the British government’s case, “gold (including gold swapped or on loan).”
Again, such a lack of transparency opens the door to abuse. Not only could all the gold be on loan (perhaps on unfavorable terms), but banks could also be “re-loaning” that very same gold, thereby creating a “paper pyramid of gold.”
The process is known as “rehypothecation,” and it’s exactly what happened during the mortgage crisis with collateralized debt obligations. And we all know how that ended.
An audit might also reveal that the government dumped some gold on the world markets to manipulate prices. (Yes, governments have done that before.) And if the U.S. government even sold a little without telling us, trust would be irreversibly broken.
More spectacularly, an audit might reveal that Fort Knox is littered with gold-painted tungsten. Here, too, a precedent exists, ascounterfeit bars turn up from time to time. Although I doubt a government would confess to being so incredibly duped.
Fort Knox: A New Stimulus Project
It would reportedly take 400 people, working full-time for six months, to test all the gold at Fort Knox for purity. It would cost at least $15 million, too. For me, that’s not a deterrent, though.
Sounds more like an economic “stimulus” project. Lord knows we’ve squandered way more tax dollars on projects with no tangible benefits. Besides, we could use some new jobs.
Bottom line: If you believe the government routinely lies or covers up its actions, we can’t simply laugh off the idea that there’s no gold in Fort Knox. Until an audit is done, the facts provide more questions than answers.
And while I don’t believe Fort Knox is completely devoid of gold, it’s certainly possible that our gold reserves are lower than reported and/or not wholly owned by the U.S. government.
So what does that mean for the price of gold? Stay tuned for tomorrow’s column. I’ll address that question to provide a real-world, logical price target for gold.
Ahead of the tape,

Louis Basenese

For the fifth week in a row, equity market investor sentiment remains neutral. Over the past 3 weeks, the market erased the losses suffered over the prior 4 weeks and just like that we are at new highs!! Funny thing, the indicators never really unwound. Seven week’s ago The Sentimeter was extremely optimistic and just like that with everyone all in, the market struggles. We should have gotten more selling, but buyers are so conditioned to buy the dip knowing that Ben Bernanke has their backs, and as if on cue, Ben answered the bell this week. However, strong markets usually don’t bounce too high or go too far when the indicators are neutral. So we are still expecting a range bound, choppy market. The way to make money in such markets is to buy the dips and sell the rips. The SP500 has moved about 7.5% in 13 trading days. That’s .57% gain per trading day or 11.5% per trading month or 138% gain trading year. Nothing abnormal here (sic).
See the Equity Market Investor Sentimeter below, which is our most comprehensive sentiment indicator. This indicator is constructed from 10 different data series including opinion data (i.e., how do you feel about the market?) as well as money flow data (i.e., where is the money going?). This is the current state of equity market investor sentiment.
Over the past year, sell offs have been met with Federal Reserve intervention — namely QE3 and QE4. These interventions short circuited the sell offs. I believe this is not healthy bull market action, and at some point, these distortions will be corrected. At this point, it is difficult to know if the Fed has something else in its bag of tricks and what will it take to use it, but rest assured they will do whatever they can to prop up the markets. Last week, all it took was jawboning by Ben Bernanke. A neutral reading in the indicator implies that there is little predictive edge to the market action.


1. This is a very useful technical gold commentary and I agree with much of it. We need to get above (and stay there) $1,300 ASAP.

2. I think it’s wise for those interested in OLE to watch this TGZ shareholder meeting as noted in this press release
3. That’s me buying more SGC this morning. I’m a glutton for punishment and I guess always wanted to be seen on the TV show “Divorce Court”.
4. I didn’t think at age 57 I enjoy starting a new business again but it’s been “uplifting” to get the “Athletes & Business Alliance” off the ground.Here’s the raw first draft of the websitehttp://scoreforbusiness.com/preview/ There are already several new athletes to add to who you see now. Here’s the first draft brochure and appreciate any comments (good or bad) on all of this. brochure


-
I know Mike is a very solid investor and respect his opinions very much. So if he says pay attention to this or that - I will.
~ Dale G.
-
I've started managing my own investments so view Michael's site as a one-stop shop from which to get information and perspectives.
~ Dave E.
-
Michael offers easy reading, honest, common sense information that anyone can use in a practical manner.
~ der_al.
-
A sane voice in a scrambled investment world.
~ Ed R.
Inside Edge Pro Contributors

Greg Weldon

Josef Schachter

Tyler Bollhorn

Ryan Irvine

Paul Beattie

Martin Straith

Patrick Ceresna

Mark Leibovit

James Thorne

Victor Adair