
Timing & trends
 Financial circles in Hong Kong are buzzing today on the new Goldman Sachs projection that gold may drop below $1,000 an ounce.
And in merely suggesting such a death sentence for the metal, Goldman’s pronouncement pushed the paper price of gold contracts down $20+.
Many technical indicators underscore Goldman’s views. There’s very little floor for gold prices below $1,200, signaling that gold could gap down quickly.
….read it all HERE

Ruth Porat didn’t see it coming.
The Morgan Stanley (MS) banker who advised the U.S. Treasury Department on its rescue of Fannie Mae and Freddie Mac in September 2008 and thought she understood the risks to the financial system had just spent a weekend trying to save Lehman Brothers Holdings Inc. when she got a message: Would she come back to deal with American International Group Inc. (AIG)?
…read more of The risks facing Wall Street 5 years after the financial crisis HERE
A man looks up at the offices of JPMorgan Chase & Co. in London. The ability of banks to hide risk, years after Lehman Brothers Holdings Inc.’s fall, was demonstrated by JPMorgan’s $6.2 billion loss in 2012 on wrong-way derivatives bets by a trader known as the London Whale because his positions were so vast.


August Retail sales in the US came in at 0.2%, below the expected 0.5% and lower than an upward revised July of 0.4%. The US dollar index was under pressure on the news.
Drew Zimmerman
Investment & Commodities/Futures Advisor
604-664-2842 – Direct
604 664 2900 – Main
604 664 2666 – Fax
800 810 7022 – Toll Free

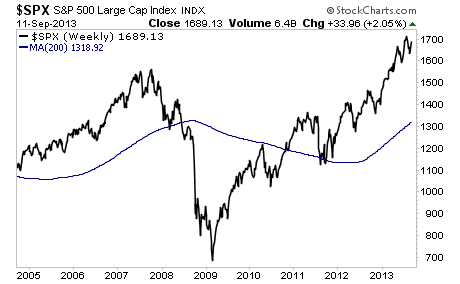 Tops never form cleanly.
I’ve made the mistake of attempting to call a top on the “dot” in the past. The reality is that anyone who attempts to do so is exercising their ego more than their judgment.
Market tops occur when investor psychology changes. But it’s not a clean shift. Investors, like any category of people, are comprised of numerous groups or sub-sects: some get it sooner than others.
In this sense there are certain tell tale signs that a top is forming. This doesn’t mean a top is “in” nor does it imply a specific timeline for a top to form (say a week vs. a few weeks).
However, there are clear signals that appear around tops. And I want to alert you that multiple ones are flashing right now.
…..read more HERE


-
I know Mike is a very solid investor and respect his opinions very much. So if he says pay attention to this or that - I will.
~ Dale G.
-
I've started managing my own investments so view Michael's site as a one-stop shop from which to get information and perspectives.
~ Dave E.
-
Michael offers easy reading, honest, common sense information that anyone can use in a practical manner.
~ der_al.
-
A sane voice in a scrambled investment world.
~ Ed R.
Inside Edge Pro Contributors

Greg Weldon

Josef Schachter

Tyler Bollhorn

Ryan Irvine

Paul Beattie

Martin Straith

Patrick Ceresna

Mark Leibovit

James Thorne

Victor Adair