
Timing & trends
I have been warning that there has been a “Club” that has been targeting market after market to make a quick buck. The LIBOR Scandal has caused the tide to turn as well as having to bail out the banks in 2008 that has fundamentally altered the course of everything. Now the Swiss regulators said they are investigating several Swiss financial institutions for possible manipulation of foreign-exchange markets, which is a dramatic expansion of the latest probe into potential rigging of widely used market benchmarks. The Swiss have come out and stated the they are now cooperating with authorities in other countries very closely. They have also stated publicly that “multiple banks around the world are potentially implicated.” The UNTOUCHABLES have started to lose their standing because they constantly blow themselves up and turn to government to save them whenever they lose money.
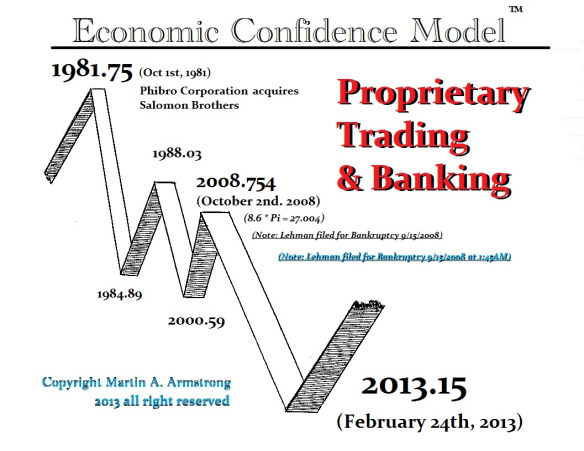
Our models on this issue of “The Club” have been spot on. The crisis came in 2008, which was 8.6 x Pi or 27.004 years from the date that Phibro took-over Salomon Brothers. That is the start date when the aggressive commodity trading culture infiltrated Wall Street. The full cycle for how long that would last should have been 31.4 years and that is when this trend came to an end idealized on February 24th, 2013. From here on out, the banks have pushed the envelope too far. We are starting to see J.P. Morgan charged criminally. When this ECM turns down again after 2015.75, the bankers will find that they are the escape-goats for politicians and will most likely be imprisoned.
The Year 1981 was truly monumental. It was the major peak on the 1981.35 Public Wave of the Economic Confidence Model. On January 20th, 1981, Ronald Reagan was sworn in as the 40th President. Iran freed the 52 hostages taken in 1979 on January 25th. By March 30th, 1981, Reagan was shot by a gunman in an attempted assassination along with his press secretary. On May 14th, 1981 Pope John Paul II was shot in an attempted assassination. On October 6th, 1981, Anwar el-Sadat was assassinated by Islamic extremists during a military parade in Cairo. Then, on December 14th, 1981, Israel annexed the disputed Golan Heights.
In 1981, seeking a larger and more permanent source of capital, Salomon Brothers agreed to its sale to Phibro for $554 million. Phibro was then one of the world’s largest commodities traders. John H. Gutfreund of Salomon Brothers became its chairman of the Salomon Brothers subsidiary and co-chief executive (along with the Philipp Brothers chairman, David Tendler) forming a new holding company, Phibro-Salomon Inc.
On September 28th, 1987, Warren E. Buffett, agreed to pay $700 million for a 12 percent stake in Salomon Inc., the parent company of Salomon Brothers Inc., Wall Street’s largest investment banking-house. That is how Buffett got into trading commodities instigated by Phibro.
This aggressive trading culture has led the world into all sorts of trading scandals and manipulations with numerous fine only prosecutions of the major players. This time, however, the LIBOR Scandal took place in London and the bankers do not control the Europeans as they do the Americans. This aggressive manipulating culture has now run its course and the cycle has changed direction.
….more from Martin Armstrong:
Manipulations & Exceptions – One-Dimensional Thinking
Death of the Euro?
France Makes it Illegal to Close Your Company

 A company’s financial statements and related disclosure documents are arguably the most important sources of information that an analyst or investor has when analyzing a company. Every quarterly period (3 months), a publicly-traded company is required to file their unaudited quarterly financial statements with audited financial statements required within 90 days of the end of the fiscal year. In addition, companies are also required to file other disclosure documents (such as the AIF, Informational Circular, certifications, etc.) throughout the year as prescribed by securities legislation. This information is intended to give the investment community reliable information for company-specific analysis and is available to the public on the government website www.SEDAR.com.
Companies are required to prepare and release quarterly and annual financial reports which include four financial statements and the associated footnotes. The financial statements are absolutely crucial for company analysis with each of the individual statements providing a different type of information.
- Balance Sheet – This is a snapshot of what we call a company’s financial position – the makeup of assets, debt, and shareholder’s equity. People, like companies, also have balance sheets whether they know it or not. Using a house as an example…the house and the property it sits on are an asset. But people don’t typically own 100% of that asset (at least not before 25 to 30 years) and use debt borrowed from a bank to partially finance their ownership. Debt is a liability and represents the portion of the asset which is owned by the creditor. The difference between assets and liabilities (assets minus liabilities) is the owner’s (or shareholder’s) equity in the asset or the company. The balance sheet will tell us how much equity the shareholders have in the business, the debt and cash levels, as well as provide insight into any impending financial risks.
- Income Statement – This statement provides a breakdown of a company’s revenue, expenses and profit over a specified period like a quarter (3 months) or a year. Investors and analysts can use the Income Statement to figure out useful information about a company’s profitability, revenue growth, margins and what specific expenses impact earnings the most. The very first step that KeyStone analysts take when looking at a new company is to go to the Income Statement and see if the business is generating revenues and profits.
- Cash Flow Statement – This financial statement is somewhat similar to the Income Statement except that instead of focusing on accounting-based profits, it focuses on actual cash flow. This is very important because profits on the Income Statement do not necessarily reflect the actual economic (cash-based) profit being generated by the company. Income statement items are often impacted by accounting assumptions and conventions (or even trickery), which do not present an accurate picture of financial performance. For this reason, many investors and analysts consider the Cash Flow Statement to be more reliable than the Income Statement.
- Statement of Shareholder’s Equity – We won’t spend any time on this financial statement as it is less commonly used by investors and analysts.
In addition to the financial statements, companies also release a number of other documents at set frequencies, some of which are required by securities law and some of which are optional.
- Annual Report – Many investors and analysts consider the Annual Report (an optional document) to be the most comprehensive document for company-specific investment analysis. In here you will typically find all of a company’s annual financial statements, the footnotes, the MD&A and generally a broader overview of the company’s ongoing strategy, progress and current situation.
- Management Discussion & Analysis (MD&A) – This is where the management of a company have the opportunity to step outside of the pure numbers and actually discuss what has been going on with the business. Here an investor may find a management outlook for financial performance or for the industry, financial metrics that are not specified in the financial statements (such as EBITDA or free cash flow), a discussion of the underlying assets, as well as many other potentially useful pieces of information. A review of the MD&A is crucial for an analysis on a company but information provided in this document is at the option of the company and some MD&As provide far more detail than others.
- Footnotes – The Footnotes are not separate documents but are included in the same document as the Financial Statements. They provide a very detailed explanation of the items inside the financial statements as well as other details on the company. Because the Footnotes are so detailed (and boring), they are often overlooked. However within the Footnotes, investors can find very crucial information such as revenue recognition policies, off balance sheet liabilities, debt maturity breakdowns, along with many other important sources of data. It is often said that if a company is trying to hide something then they will bury it deep in the financial footnotes.
- Annual Information Form (AIF) – This form (which is issued once per year) is also often overlooked by investors and analysts but can provide excellent background on the company, its industry and its products. Many questions about the structure of the business and the business model can be answered by reading through the AIF.
- Management Information Circular (or Proxy Circular) – This is yet another useful and often overlooked document. The Information (or Proxy) Circular is released in advance of the Annual General Meeting (AGM) and provides details about the issues on which shareholders will be asked to vote. A very useful feature of this document is that it discloses who the major shareholders of the company are as well as management’s compensation and compensation structure.
|
KeyStone’s Latest Reports Section |

 Showdown to Shutdown
What is going on in Washington is more of a political charade than real budget negotiations; albeit, it is a distraction from the real structural problems created from a two decade period of debt-fuelled surges in consumption.


CLICK the player for Mike’s answer

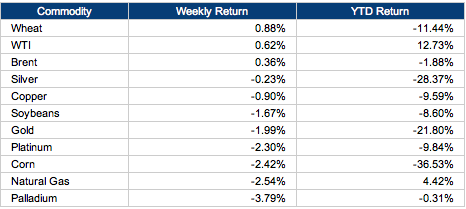
Oil and wheat outperformed, but most commodities fell this week. Stocks, as measured by the S&P 500, finished the volatile period with an overall loss of less than 1 percent. Year-to-date, the index is up 18.4 percent.
Macroeconomic Highlights
This week’s news flow was dominated by talk of the first federal government shutdown in nearly 18 years. The shutdown has dragged on for four days and counting, after beginning on Tuesday. Traders are also getting jittery about the approaching debt-ceiling deadline, which the Treasury has said is around Oct. 17.
Most government economic releases have been delayed, including the important monthly nonfarm payrolls report that was originally scheduled for today.
However, we did see a number of private sector releases and other data from around the world.
China’s manufacturing PMI edged up from 51 to 51.1 in September, slightly below the 51.6 that was expected. At the same time, the equivalent PMI gauge in the eurozone remained unchanged at 51.1 in September, remaining above the key 50 level for a third-straight month, while ISM said that its U.S. manufacturing index rose from 55.7 to 56.2, the strongest level since April 2011.
Meanwhile, payroll processor ADP said that private employers added 166K jobs in September, below the 180K that was expected.
Lastly, ISM said that its nonmanufacturing composite fell from 58.6 to 54.4 in September, below the 57 that was expected.
….read page 2 HERE

-
I know Mike is a very solid investor and respect his opinions very much. So if he says pay attention to this or that - I will.
~ Dale G.
-
I've started managing my own investments so view Michael's site as a one-stop shop from which to get information and perspectives.
~ Dave E.
-
Michael offers easy reading, honest, common sense information that anyone can use in a practical manner.
~ der_al.
-
A sane voice in a scrambled investment world.
~ Ed R.
Inside Edge Pro Contributors

Greg Weldon

Josef Schachter

Tyler Bollhorn

Ryan Irvine

Paul Beattie

Martin Straith

Patrick Ceresna

Mark Leibovit

James Thorne

Victor Adair