
Mike's Content
 Michael whacks the loose details as the Government sets up to raid your wallet….again.
{mp3}mcbuscomnov15fp{/mp3}
To read “Michael Campbell’s Money Talks” Facebook page go HERE

In our most recent article on gold, USD and Euro Indices we wrote that the outlook for the yellow metal was bearish just as the outlook for the Euro Index and just as it was bullish for the USD Index. At this time – since all of the above-mentioned markets moved in the opposite way – you might be wondering if we are sticking to the above analysis. In the medium-term, we do, but not in the short run. In fact, earlier this week we told our subscribers to cash in the profits from the short positions as the bullish correction was quite likely to be seen.
So, have metals bottomed? Not necessarily. Let’s take a look at the following charts and discuss them. After we describe them, you’ll see, why it’s not a sure bet (charts courtesy of http://stockcharts.com.) We’ll start with the USD Index.
The situation in the long-term chart hasn’t changed much recently and what we wrote in our last article is still up-to-date today.
(…) the long-term breakout above the declining long-term support line was not invalidated. Additionally, the USD Index reversed right in the middle of our target area. Therefore, from this perspective, it seems that the downward move – if it’s not already over – will be quite limited because the long-term support line will likely stop any further declines.
Now, let’s examine the weekly chart.
Looking at the above chart we see that after a sharp rally, which invalidated the move below the lower support line and the breakdown below the medium-term support line (a bold black line), the USD Index almost reached the previously-broken rising medium-term support line created by the August 2011 and January 2013 lows.
The invalidation of the breakdown is itself a bullish signal and it seems that we will still see more of its impact in the coming weeks.
Although we saw a correction in recent days, it is still shallow, which is a bullish signal for the short term – every now and then markets need to take a break from rallying – none of them can move in one direction all the time.
Let’s check the short-term outlook.
Quoting our previous article:
(…) the USD Index rallied in the previous week and moved above the previously-broken resistance line based on the June low. Additionally, (…) the U.S. dollar broke above the short-term resistance line based on the July and September highs. Looking at the above chart we see that both breakouts were confirmed.
On the above chart we clearly see that after the sharp late-October-November rally, the USD Index gave up some of the gains and corrected earlier growth in recent days. Despite this drop, the U.S. dollar still remains above the previously-broken resistance lines. Please note that as long as it stays above the short-term resistance line (marked with red), the situation will remain bullish.
Let’s now take a look at the Euro Index.
Larger view HERE or click on chart

Looking at the above chart we see that the October – November decline pushed the European currency to its lowest level since mid-September. At the beginning of the week the Euro Index bounced off the last week’s low and continued its upward move in the following days. In this way, the European currency almost reached the previously-broken 135 level. In spite of this fact, this week’s upswing didn’t change anything, because it didn’t even erase half of the recent decline. Taking this fact into account, it seems that further deterioration is quite likely in the coming week.
To see the current situation more clearly, let’s zoom in on our picture and move on to the medium-term chart.
From the medium-term point of view, the situation is a mirror image of what we saw on the short-term USD Index chart. After the Euro Index dropped below its rising support line and erased 50% of its entire July – October rally, we saw a relatively small move back up, which took the European currency to the 38.2% Fibonacci retracement level based on the October – November decline.
As mentioned earlier, although we’ve seen some improvement in the recent days, the Euro Index still remains below the level of 135. Additionally, the breakdown below the rising support line hasn’t been invalidated.
Please note that the current correction is still shallow, which means that the decline can continue. Even, if we see a move higher, to the 61.8% retracement level, the euro will still remain in a downtrend. From this point of view, the situation is bearish. But if we see a move below 131.56 the bearish implications will be even stronger. On a very short-term basis, though, we can’t rule out more strength in the European currency.
All in all, we could see further improvement in the Euro Index and weakness in the USD Index on a short-term basis. However, it seems that the bearish trend will remain in place as long as the euro remains below its short-term resistance line and the dollar stays above its short-term support line. Therefore, currently, the implications for the precious metal market are bullish but are likely to become bearish shortly. Please take a look at our Correlation Matrix for the confirmation of the above.
Correlations seem to have moved back to their default values in the case of the USD Index and the precious metals sector. This means that it’s no wonder that metals and miners are correcting – the reason could simply be the correction in the USD Index. The latter had quite a volatile run up in the recent weeks and – as mentioned earlier in today’s update – was something that one could have expected. Just as the trend remains up in case of the USD Index, the trend remains down in case of the precious metals sector.
Meanwhile, the correlation coefficients between PMs and the general stock market are rather insignificant on a short-term basis (with the exception of the mining stocks sector, which seems to be waiting for a decline in stocks in order to decline itself), so we can’t tell much about the possible impact of the current outlook for stocks for the prices of gold and silver.
Overall, with bullish implications from the currency sector (despite a very short-term correction that was likely triggered by the correction in currencies) and the unclear impact of the stock market, the precious metals sector seems to be set to decline once again after a quick move up.
What about gold itself? Let’s take a look.
HERE or Click on Chart for Larger View

Quoting our previous Premium Update:
Looking at the above chart we see that the situation hasn’t changed much from the long-term perspective. The medium-term outlook was bearish as gold had already broken below the long-term rising support line and the recent decline naturally hasn’t made the situation look bullish.
The medium-term trend remains down and from this perspective it seems that another local top has formed. Therefore, further deterioration is quite likely, if not immediately, then at least soon.
Gold is trading very close to the 38.2% Fibonacci retracement level ($1,285) based on the entire bull market, and just a bit more weakness might trigger a significant sell-off if the breakdown is confirmed.
Summing up, while gold could move higher in the following days – triggered by strength in the Euro Index and weakness in the USD Index – it will likely be just a counter trend move that will be followed by further declines.
Thank you for reading. Have a great and profitable week!
Przemyslaw Radomski, CFA
Founder, Editor-in-chief
Gold Price Prediction Website – SunshineProfits.com
* * * * *
Disclaimer
All essays, research and information found above represent analyses and opinions of Przemyslaw Radomski, CFA and Sunshine Profits’ associates only. As such, it may prove wrong and be a subject to change without notice. Opinions and analyses were based on data available to authors of respective essays at the time of writing. Although the information provided above is based on careful research and sources that are believed to be accurate, Przemyslaw Radomski, CFA and his associates do not guarantee the accuracy or thoroughness of the data or information reported. The opinions published above are neither an offer nor a recommendation to purchase or sell any securities. Mr. Radomski is not a Registered Securities Advisor. By reading Przemyslaw Radomski’s, CFA reports you fully agree that he will not be held responsible or liable for any decisions you make regarding any information provided in these reports. Investing, trading and speculation in any financial markets may involve high risk of loss. Przemyslaw Radomski, CFA, Sunshine Profits’ employees and affiliates as well as members of their families may have a short or long position in any securities, including those mentioned in any of the reports or essays, and may make additional purchases and/or sales of those securities without notice.

Today KWN is putting out a special piece discussing historic events which are literally shocking the financial world. This will give KWN readers around the globe a snapshot of these astonishing and unprecedented events which have just taken place. In addition, legendary Richard Russell weighs in at the end of the piece.
Right now there are some absolutely historic events taking place in the financial world. KWN will expose what is happening for our global readers, and also include some comments from the legendary Richard Russell at the end of this piece…..
Sotheby’s just had a 59.60-carat pink diamond sell for an all-time auction record of a staggering $83 million. The previous record for a gemstone was held by Graff from several years ago, at $45.6 million. So, the latest auction shattered the previous record. This is a trend that has been continuing around the world, where the super-wealthy are exiting fiat money for hard assets such as art, diamonds, etc.

….read more HERE

Bubbles are an important cause of economic recessions according to the popular way of thinking. The main question posed by experts is how one knows when a bubble is forming. It is held that if the central bankers knew the answer to this question they might be able to prevent bubble formations and thus prevent recessions.
On this, at the World Economic Forum in Davos Switzerland on January 27, 2010, Nobel Laureate in Economics Robert Shiller argued that bubbles could be diagnosed using the same methodology psychologists use to diagnose mental illness. Shiller is of the view that a bubble is a form of psychological malfunction. Hence the solution could be to prepare a checklist similar to what psychologists do to determine if someone is suffering from, say, depression. The key identifying points of a typical bubble according to Shiller, are,
- Sharp increase in the price of an asset.
- Great public excitement about these price increases.
- An accompanying media frenzy.
- Stories of people earning a lot of money, causing envy among people who aren’t.
- Growing interest in the asset class among the general public.
- New era “theories” to justify unprecedented price increases.
- A decline in lending standards.
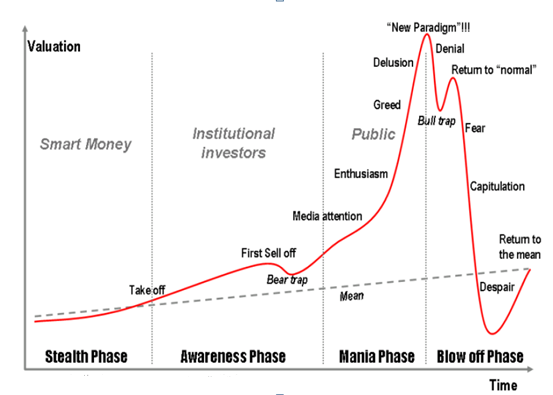
What Shiller outlines here are various factors that he holds are observed during the formation of bubbles. To describe a thing is, however, not always sufficient to understand the key factors that caused its emergence. In order to understand the causes one needs to establish a proper definition of the object in question. The purpose of a definition is to present the essence, the distinguishing characteristic of the object we are trying to identify. A definition is meant to tell us what the fundamentals or the origins of a particular entity are. On this, the seven points outlined by Shiller tell us nothing about the origins of a typical bubble. They tell us nothing as to why bubbles are bad for economic growth. All that these points do is to provide a possible description of a bubble. To describe an event, however, is not the same thing as to explain it. Without an understanding of the causes of an event it is not possible to counter its emergence.
Defining bubbles
…read more HERE

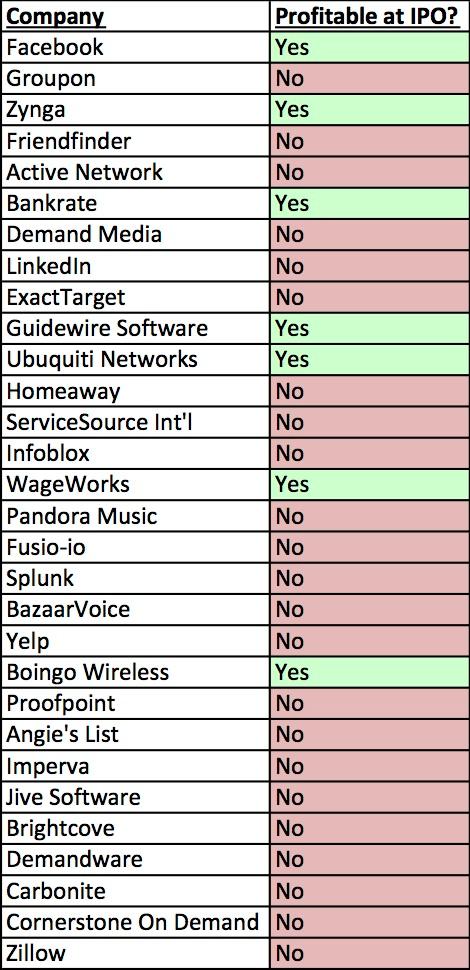
We’re in another Tech Craze, similar to the one in 2000, by the look of things
The last two years have seen a number of high profile Tech IPOs for businesses that are barely profitable or have never turned a profit. Indeed, of the tech firms that went public in 2013 so far, 73% have never turned a profit (compare that to just 27% of the tech IPOs that were unprofitable in 1999).
However, this is not to say that this Fed intervention is not creating tremendous opportunities for stock pickers. After all with the Fed juicing stocks to this degree, there is no shortage of mis-pricings in high quality companies.
To take out an annual subscription to Cigar Butts & Moats…
Best Regards
Phoenix Capital Research


-
I know Mike is a very solid investor and respect his opinions very much. So if he says pay attention to this or that - I will.
~ Dale G.
-
I've started managing my own investments so view Michael's site as a one-stop shop from which to get information and perspectives.
~ Dave E.
-
Michael offers easy reading, honest, common sense information that anyone can use in a practical manner.
~ der_al.
-
A sane voice in a scrambled investment world.
~ Ed R.
Inside Edge Pro Contributors

Greg Weldon

Josef Schachter

Tyler Bollhorn

Ryan Irvine

Paul Beattie

Martin Straith

Patrick Ceresna

Mark Leibovit

James Thorne

Victor Adair