Energy & Commodities

Charts suggest decline in crude oil may be over

174106012-resize-380x300In our previous essay, we examined the situation in crude oil in different time horizons. Back then, we wrote that the short-term situation had improved as crude oil had broken above both short-term resistance lines on relatively high volume and had come back above the previously-broken medium-term support line and the long-term one.

In the following days, crude oil extended gains and approached its 200-day moving average. What’s next? Is the worst already behind oil bulls and we will see further improvement? Before we try to answer these questions, we’ll examine three interesting ratios to see if there’s anything on the horizon that could drive crude oil higher or lower in the near future. Let’s start with the oil-to-oil-stocks ratio (charts courtesy by http://stockcharts.com).

N1-1


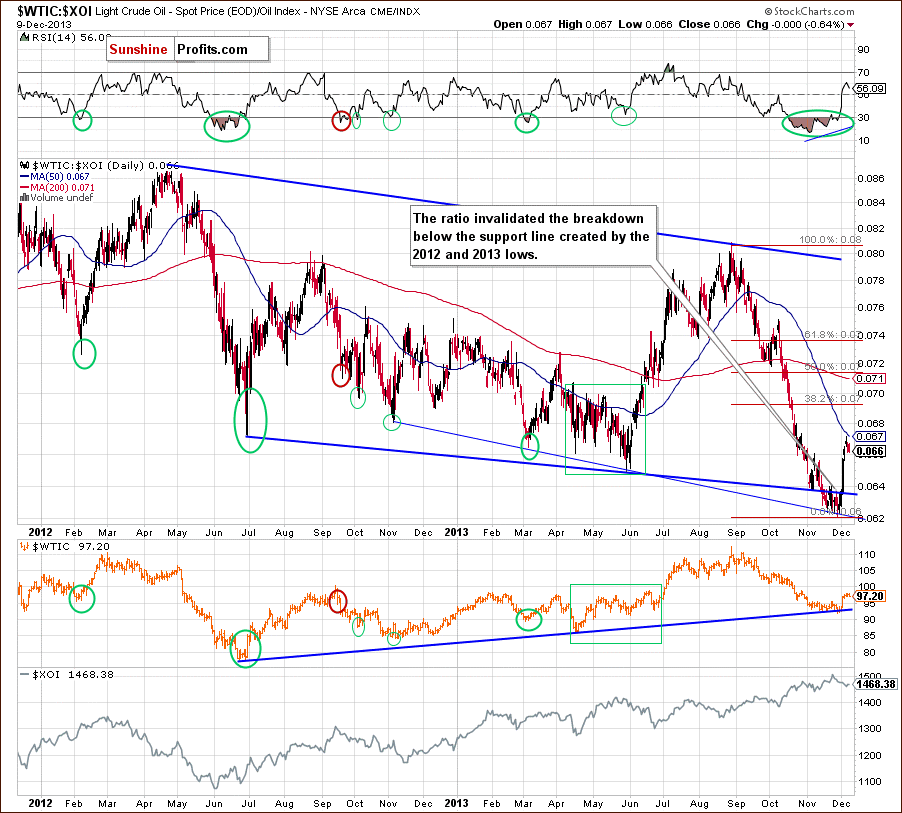
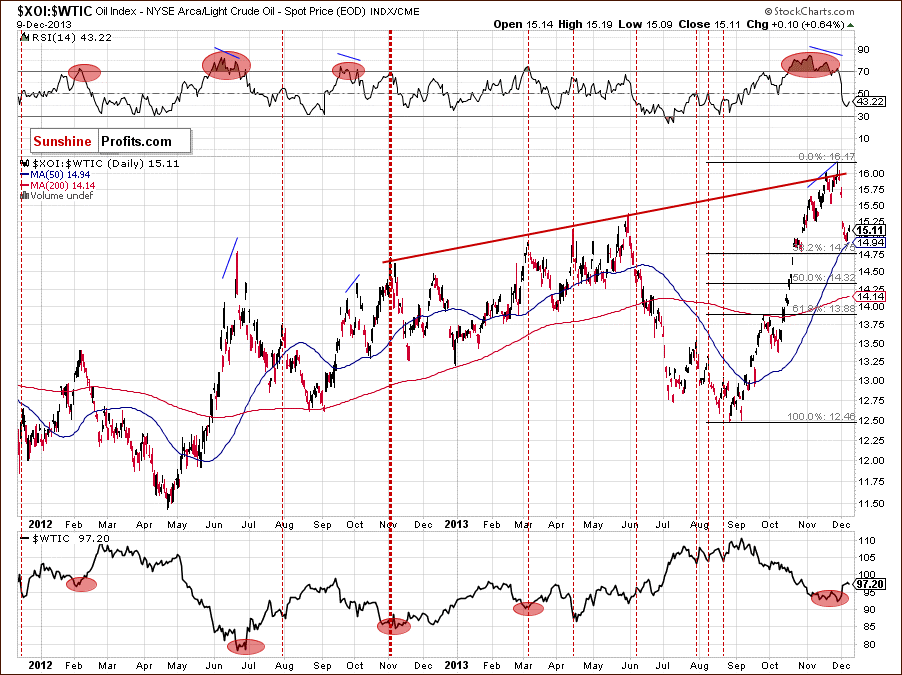
At the end of October, the ratio declined and broke below the long-term declining support line created by the 2012 and 2013 lows. Additionally, the WTIC:XOI ratio verified the breakdown, which was a strong bearish signal. In our previous Oil Investment Update we wrote that as long as the breakdown below the bold blue support line was not invalidated, another downswing couldn’t be ruled out.

Looking at the above chart, we see that the ratio reached the next long-term support line (marked with the thin blue line on the previous chart) and rebounded sharply in the previous week. In this way, the ratio invalidated the breakdown below the support line based on the 2012 and 2013 lows, which is a strong bullish sign.

Last week, the ratio reached its 50-day moving average and reversed the course – similarly to what we saw in April, May and June. However, we should keep in mind that back then, new lows in ratio didn’t trigger a fresh low in crude oil. Therefore, if history repeats itself once again, we may see lower values of light crude in near future, but another big move lower doesn’t seem likely.

Having discussed the above, we’ll examine the oil-stocks-to-oil ratio. What impact could it have on future oil moves? Let’s start with the long-term chart.

N2

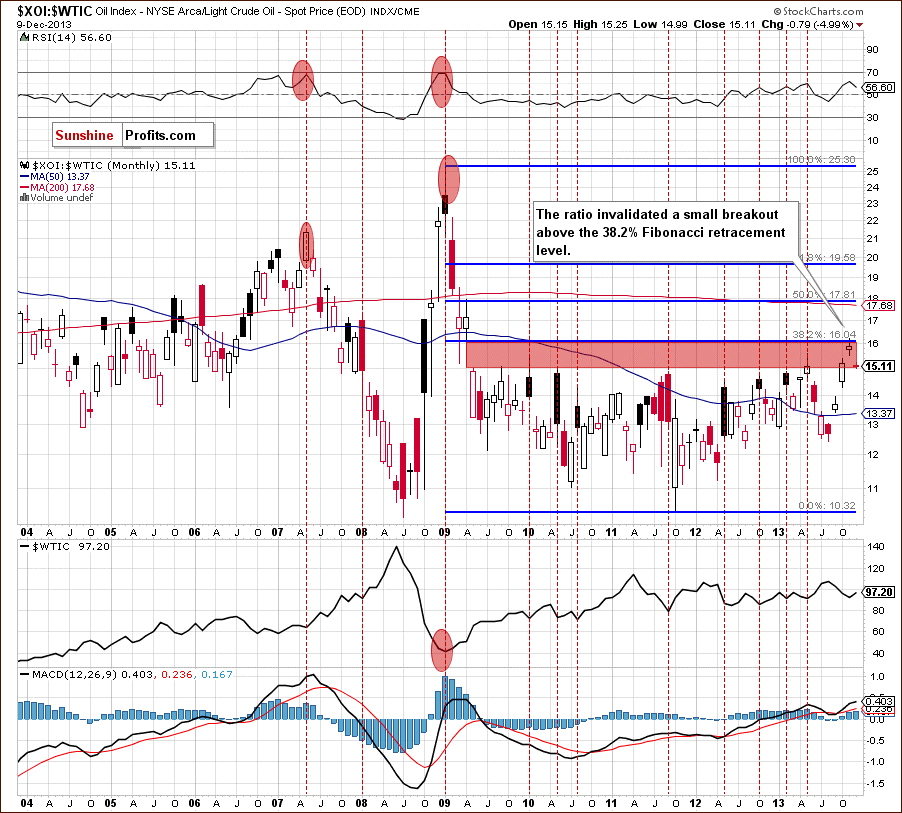
Looking at the above chart, we see that the ratio reached the 38.2% Fibonacci retracement level (based on the entire 2009-2011 decline) and invalidated a small breakout above this strong resistance level, which was a bearish signal. This circumstance triggered a downswing, which took the ratio to the lower line of the gap between the April 2009 low and May 2009 high (marked with the red rectangle), which is not supporting further growth. From this perspective, the implications for oil are bullish.

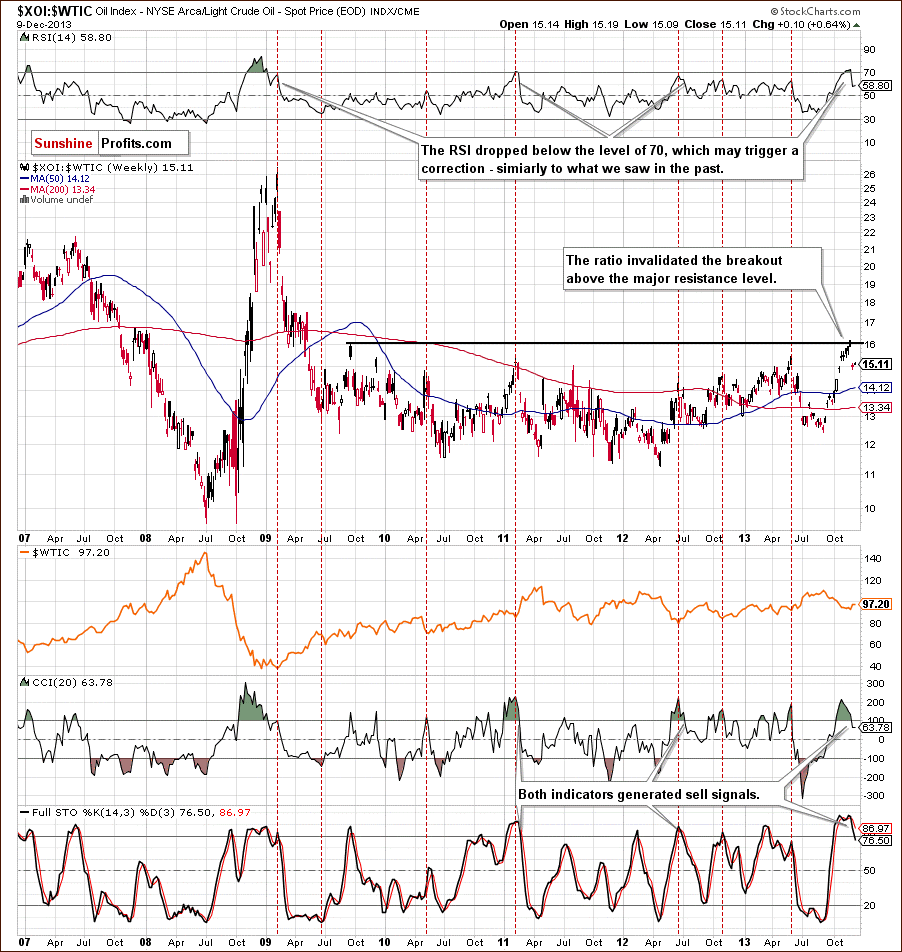
Now, let’s zoom in on our picture and examine the weekly chart.

N2

After an invalidation of the breakout above the resistance level created by the September 2009 high, which is slightly below the 38.2% Fibonacci retracement (marked on the previous chart), the ratio declined, which triggered an upswing in crude oil.  Additionally, the RSI dropped below the level of 70, which suggests further deterioration in the ratio. We saw similar situations in the past and in all previous cases such circumstances had a positive impact on the price of light crude.

When we factor in the position of the CCI and the Stochastic Oscillator, we clearly see that both indicators generated sell signals, which is another bearish signal. From this perspective, the implications for crude oil are also bullish.

Now, let’s check the short-term outlook.

N3

After an invalidation of the breakout above the resistance level created by the September 2009 high, which is slightly below the 38.2% Fibonacci retracement (marked on the previous chart), the ratio declined, which triggered an upswing in crude oil.  Additionally, the RSI dropped below the level of 70, which suggests further deterioration in the ratio. We saw similar situations in the past and in all previous cases such circumstances had a positive impact on the price of light crude.

When we factor in the position of the CCI and the Stochastic Oscillator, we clearly see that both indicators generated sell signals, which is another bearish signal. From this perspective, the implications for crude oil are also bullish.

Now, let’s check the short-term outlook.

N4

Looking at the above chart, we see that last week the ratio bounced off the medium-term rising resistance line based on the November 2012 and May 2013 highs (marked with the red line) and declined, which was in perfect tune with an upswing in crude oil.

With this downward move, the ratio reached its 50-day moving average and approached the 38.2% Fibonacci retracement level. This strong support zone triggered a corrective upswing in the recent days, which preceded a decline in light crude. Taking into account the fact that the correction is still shallow, we may see further improvement in the ratio and deterioration in crude oil.

When we take a closer look at the chart above, we notice that earlier this year we had similar situation in April. At that time, although we saw a corrective upswing in the ratio, it didn’t pushed light crude to a new low. If history repeats itself, we may see further improvement in crude oil after a corrective downswing.

Before we finish this section, we would like to focus on the oil-to-gold ratio.

N5

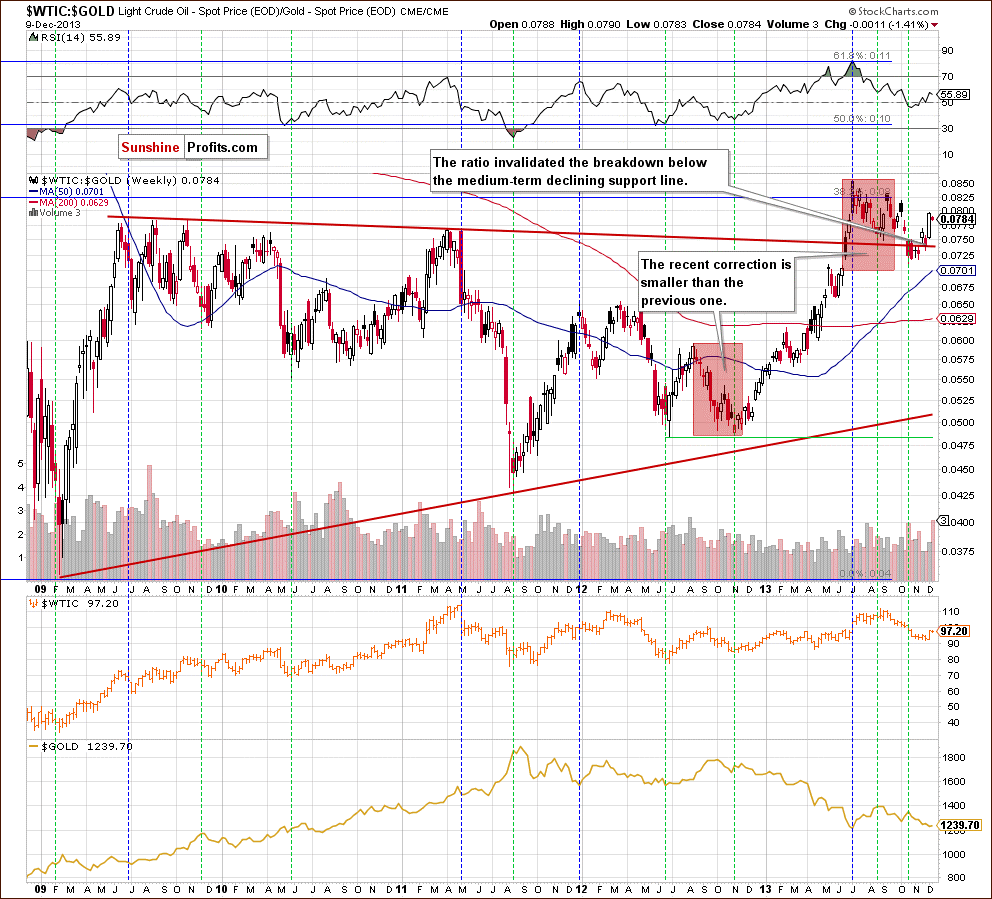
As you can see on the weekly chart, the ratio’s 2012 low was in tune with the bottom of a correction in crude oil. In November 2012, the ratio declined to its previous low, which triggered a corrective move in light crude. After that, we saw a post-double-bottom rally, which supported higher prices of crude oil.

Looking at the above chart, we see that the ratio’s 2013 top wasn’t in perfect tune with light crude’s 2013 high. However, when we take a closer look, we notice that the ratio’s September high was visibly lower than the previous one. Meanwhile, crude oil was trading near its 2013 high. This negative divergence between the ratio and the price of light crude was a negative sign and resulted in a decline in the following weeks.

With this downward move, the ratio dropped below long-term declining support line, which was a bearish sign. However, as it turned out in recent weeks, the breakdown was invalidated, which is a bullish signal for light crude.

Additionally, the recent correction is smaller than the previous one (August-November 2012), which suggests that another move to the upside is quite likely. As mentioned earlier, the rising ratio has had a positive impact on the price of crude oil since the beginning of the year. We can assume that higher values of the ratio will likely support the price of light crude.

What’ interesting, earlier this year the rising ratio had a negative impact on the price of gold. The ratio’s 2013 high was in tune with gold’s low in July. After that, this negative correlation between the ratio and gold pushed the yellow metal higher. There was a short period of time (in September), when they both dropped together, however, as it turned out, it was just a temporary phenomenon and the October decline in the ratio triggered an upward move in gold.

As you can see on the above chart, the negative correlation between the ratio and gold remains in place at the moment. Since the beginning of November the rising ratio has pushed the yellow metal lower and it seems that if this relationship remains in place in the coming days/weeks, we will likely see further deterioration in gold.

Summing up, the WTIC:XOI ratio invalidated the breakdown below the support line based on the 2012 and 2013 lows, which is a positive factor supporting the bullish case.

When we factor in the long-, medium- and the short-term XOI:WTIC charts, we clearly see that the ratio invalidated breakouts above a strong resistance zone created by the long-, medium- and short-term lines. This is another strong positive signal for oil bulls. On top of that, after discussing the situation in the oil-to-gold ratio, we can assume that the implications for crude oil are also bullish and further growth in crude oil is just around the corner.


About the Author

Nadia Simmons

Nadia is a private investor and trader, dealing in stocks, currencies, and commodities. Using her background in technical analysis, she spends countless hours identifying market trends, major support and resistance zones, breakouts and failures. In her writing, she presents complex ideas with clarity that enables you to easily understand market changes, and profit on them.

You can read Nadia’s analyses at SunshineProfits.com where she publishes her articles on gold and crude oil trading.


Introducing the Knightscope K5 Security Robot, Effective Cost $6.25 per Hour

Knightscope Inc. has introduced a crime-fighting R2D2 look-alike robot with an effective cost of $6.25 per hour. 

 Silicon Valley startup Knightscope Inc. is developing an “Autonomous Data Machine” with the potential to perform the oftentimes monotonous task of keeping watch over property more cost effectively and comprehensively than a human security guard. The company today revealed it has already started securing beta customers for its first two models, the Knightscope K5 and K10.

The robots, which share a passing resemblance to R2-D2, collect real-time data via a network of sensors. These sensors can include a 360-degree high definition video camera, high quality microphones, thermal imaging sensor, infrared sensor, radar, lidar, ultrasonic speed and distance sensors, air quality sensor, and optical character recognition technology for scanning things like license plates.

Knightscope says the K10 model is intended for vast open areas and on private roads, while the K5 robot is better suited to more space-constrained environments.

K5 vs. R2D2

K5-1

K5 Closeup

….continue reading HERE

This Unique Silver Investment Could Deliver Triple-Digit Profits

990% in four years… 

That’s how much the price of silver-dollar coins soared during the coin bull market from 1976 to 1980, according to David Hall in his 1987 book A Mercenary’s Guide to the Rare Coin Market

The value of silver dollars corrected from 1980 to 1982. Then, these particular coins soared again from 1982 to 1985 – rising 188.6%. 

In short, silver dollars can soar when a bull market gets going. I believe a new bull market in these coins could get started soon. Based on history, the right silver coins could easily soar by triple digits. It’s a trade you want to be a part of right now…

Now, it wasn’t just any old silver dollars that delivered 990% gains. They were silver dollars in MS65 grade… These coins are semi-rare – exactly the kind of coin I’m interested in today. 

I call them “hybrid” coins… They are more valuable and harder to find than standard bullion coins selling for around melt value. They also have collectible value – and trade for much more than the value of the metal they contain. But they are not one-of-a-kind… There are enough around that you can buy them with ease.

This is exactly the kind of coin I’m interested in buying today… 

You see, I spoke with my good friend Van Simmons, who knows as much about rare coins as anyone on the planet. Van is actually one of the founders of the Professional Coin Grading Service (PCGS) – the benchmark for quality in coin grading. 

I asked Van about MS65 Morgan silver dollars. He said, “Steve, you nailed it. I’ve been buying these for myself. The Morgan dollar is without question one of the most loved coins. And right now, it is just ridiculously cheap.” 

Van told me that in 1986-1987, his dealer cost on these particular coins was near $1,000 per coin. That was 27 years ago. Today, these coins retail for less than $200! 

The story is simple: The price of silver has soared since then. But the price of Morgan silver dollars in MS65 grade has barely budged, creating an incredible opportunity. 

Morgan silver dollars are near their all-time best value relative to the price of silver. 

You see, since the price of silver has gone up and the price of the coins has gone basically nowhere… the premium for the Morgan dollars has shrunk to record levels in recent years. 

Take a look…

rN-81101366 P80D5MJ43K

While these coins traded for a 1,500% premium throughout the 1990s and early 2000s, today’s premium is way below that now. Our opportunity is the best it has been in decades. 

And as the chart shows, the premium is now rising for the first time in years. As premiums continue to rise, our gains will pile up. I think premiums could double – even if silver prices go nowhere. 

Silver has been carving out a bottom over the last six months. And after a fall from grace, I believe investors have mostly given up on silver. I doubt we’ll see much lower prices. But importantly, we don’t have to see higher prices to make money on this trade. 

You see, we’ll make money in Morgan dollars as the coin’s premium-over-melt value rises up from record lows, or as silver prices rise. 

Those two circumstances aren’t just possible… they are likely. And if they happen, these MS65 Morgan silver dollars can double. 

The easiest way to make the trade is by buying the Morgan silver dollar coins in MS64 grade. While the gains I presented were based on MS65 grade coins, the MS64 coins are easier to buy. They are not as “perfect,” and they trade for around half the price. But they should still soar alongside MS65s. 

I suggest dealing with Van Simmons of David Hall Rare Coins. Keep in mind – I get nothing for recommending Van. But he has done a fantastic job for me and my readers over many years. You can reach Van at 800-759-7575 or info@davidhall.com

Two other coin dealers that have treated my readers well over the years are Dana Samuelson and his team at American Gold Exchange (800-613-9323, info@amergold.com) and Rich Checkan at Asset Strategies International (800-831-0007, rcheckan@assetstrategies.com). 

If you’re interested in silver, this is the best way I know to invest today. We have a real shot at triple-digit gains, even if silver prices go nowhere. That’s a bet I’ll happily make today. 

Good investing, 

Steve Sjuggerud

Further Reading: 

Classic interview: Casey Research’s Jeff Clark says there are three reasons he’s bullish on silver in the long term. “Based on these factors, my view is that silver can continue rising for quite some time,” he says. Learn just about everything you need to know about buying silver right here.
 
Classic interview: If you’re interested in investing in “real stuff,” like coins, art, and collectibles, you won’t want to miss this interview with Van Simmons. In it, Van reveals the benefits of adding these rare assets to your portfolio… the keys to successfully investing in them… and how to find a reputable dealer. Get all the details here.

…continue reading HERE

How Isaac Newton went flat broke chasing a stock bubble

Newton2

[Editor’s Note: Tim Price, Director of Investment at PFP Wealth Management and frequent Sovereign Man contributor is filling in for Simon today.]

For practitioners of Schadenfreude, seeing high-profile investors losing their shirts is always amusing.

But for the true connoisseur, the finest expression of the art comes when a high-profile investor identifies a bubble, perhaps even makes money out of it, exits in time – and then gets sucked back in only to lose everything in the resultant bust.

An early example is the case of Sir Isaac Newton and the South Sea Company, which was established in the early 18th Century and granted a monopoly on trade in the South Seas in exchange for assuming England’s war debt.

Investors warmed to the appeal of this monopoly and the company’s shares began their rise.

Britain’s most celebrated scientist was not immune to the monetary charms of the South Sea Company, and in early 1720 he profited handsomely from his stake. Having cashed in his chips, he then watched with some perturbation as stock in the company continued to rise.

In the words of Lord Overstone, no warning on earth can save people determined to grow suddenly rich.

Newton went on to repurchase a good deal more South Sea Company shares at more than three times the price of his original stake, and then proceeded to lose £20,000 (which, in 1720, amounted to almost all his life savings).

This prompted him to add, allegedly, that “I can calculate the movement of stars, but not the madness of men.”

20131210-image


The chart of the South Sea Company’s stock price, and effectively of Newton’s emotional journey from greed to satisfaction and then from envy and more greed, ending in despair, is shown above.

A more recent example would be that of the highly successful fund manager Stanley Druckenmiller who, whilst working for George Soros in 1999, maintained a significant short position in Internet stocks that he (rightly) considered massively overvalued.

But as Nasdaq continued to soar into the wide blue yonder (not altogether dissimilar to South Sea Company shares), he proceeded to cover those shorts and subsequently went long the technology market.

Although this trade ended quickly, it did not end well. Three quarters of the Internet stocks that Druckenmiller bought eventually went to zero. The remainder fell between 90% and 99%.

And now we have another convert to the bull cause.

Fund manager Hugh Hendry has hardly nurtured the image of a shy retiring violet during the course of his career to date, so his recent volte-face on markets garnered a fair degree of attention. In his December letter to investors he wrote the following:

“This is what I fear most today: being bearish and so continuing to not make any money even as the monetary authorities shower us with the ill thought-out generosity of their stance and markets melt up. Our resistance of Fed generosity has been pretty costly for all of us so far. To keep resisting could end up being unforgivably costly.”

Hendry sums up his new acceptance of risk in six words: “Just be long. Pretty much anything.”

Will Hendry’s surrender to monetary forces equate to Newton’s re-entry into South Sea shares or Druckenmiller’s dotcom capitulation in the face of crowd hysteria ? Time will tell.

Call us old-fashioned, but rather than submit to buying “pretty much anything”, we’re able to invest rationally in a QE-manic world by sailing close to the Ben Graham shoreline.

Firstly, we’re investors and not speculators. (As Shakespeare’s Polonius counselled: “To thine own self be true”.)

Secondly, our portfolio returns aren’t exclusively linked to the last available price on some stock exchange; we invest across credit instruments; equity instruments; uncorrelated funds, and real assets, so we have no great dependence on equity markets alone.

Where we do choose to invest in stocks (as opposed to feel compelled to chase them higher), we only see advantage in favouring the ownership of businesses that offer compelling valuations to prospective investors.

In Buffett’s words, we spend a lot of time second-guessing what we hope is a sound intellectual framework. Examples:

  • In a world drowning in debt, if you must own bonds, own bonds issued by entities that can afford to pay you back;
  • In a deleveraging world, favour the currencies of creditor countries over debtors;
  • In a world beset by QE, if you must own equities, own equities supported by vast secular tailwinds and compelling valuations;
  • Given the enormous macro uncertainties and entirely justifiable concerns about potential bubbles, diversify more broadly at an asset class level than simply across equity and bond investments;
  • Given the danger of central bank money-printing seemingly without limit, currency / inflation insurance should be a component of any balanced portfolio
  • Forget conventional benchmarks. Bond indices encourage investors to over-own the most heavily indebted (and therefore objectively least creditworthy) borrowers. Equity benchmarks tend to push investors into owning yesterday’s winners.

In the words of Sir John Templeton,

“To buy when others are despondently selling and sell when others are greedily buying requires the greatest fortitude and pays the greatest reward.”

So be long “pretty much everything”, or be long a considered array of carefully assessed and diverse instruments of value. It’s a fairly straightforward choice.


Next: 

Previous: 


Job openings in the U.S. climbed in October to the highest level in more than five years, showing employers were looking beyond the budget impasse in Washington amid growing confidence in the economic expansion.

continue reading

test-php-789