
Timing & trends
All markets go through cycles. Secular or long term bull markets are often interrupted by cyclical or short term bear markets. These short term bear markets often feel like they will never end, but they serve to refuel the bull market. The reason is bull markets are powered by new buyers. Any market that goes up too far, too fast, runs out of new buyers, and thus becomes more vulnerable as buyers are exhausted. Everyone gets excited that the market is going to the moon. But in reality too much buying has been pulled forward in time because too many people rushed in at the top. This is how markets fake out the majority of participants at the extremes. Too many people do the wrong thing at the top, leaving not enough people to keep the market going higher. The balance of power shifts to the sellers, which drives the market back down.
The chart below depicts this cycle and shows how the majority is wrong at the extremes. At the top is euphoria, where extreme buying fakes out the majority of market participants and produces a market top. Extreme buying feels good at the top, but counter-intuitively it is also what produces bear markets. Once the buyers are finally overwhelmed, sellers take control, and the market works through the bear market cycle.
After a period where anxiety turns to fear and panic, the bear cycle usually ends in capitulation, or extreme selling. At that point selling is actually pulled forward in time, sellers that would have sold in the future are suddenly flushed out of the market. But only brave buyers are stepping in to the market at this point, just enough of them to outweigh the sellers and produce a bottom. The fear at the bottom takes a while to dissipate, which is what produces the despondency and depression that really puts the floor in. The market puts in this floor or basing phase where just enough buying is keeping pace with selling, and then all of a sudden new buyers come back into the market. And wholla, the bull market cycle starts again as new buyers overwhelm the sellers.
Long term bull markets tend to go through this cycle multiple times before they eventually top. Think about what happened in the 1980 to 2000 stock bull market. Bear market cycles reset investor sentiment in 1987, 1990, 1994, and as late as 1998. These bear markets were just natural parts of the overall long term cycle. Resetting sentiment, refueling the bull market.
Now long term bull markets don’t usually top until they go into a mania. This is exactly what happened in the stock bull market when it ended. In a mania buying is so extreme it pulls forward future buying for years and even decades. The buying is so out of control once it dries up prices actually drift sideways in a long term sense. In the short term though it’s just another bear cycle and usually a vicious one after a mania. This explains why after the mania in 2000, we got a new bull market in stocks as early as 2003. But stocks still haven’t made significant progress over the 2000 high 13 years later.
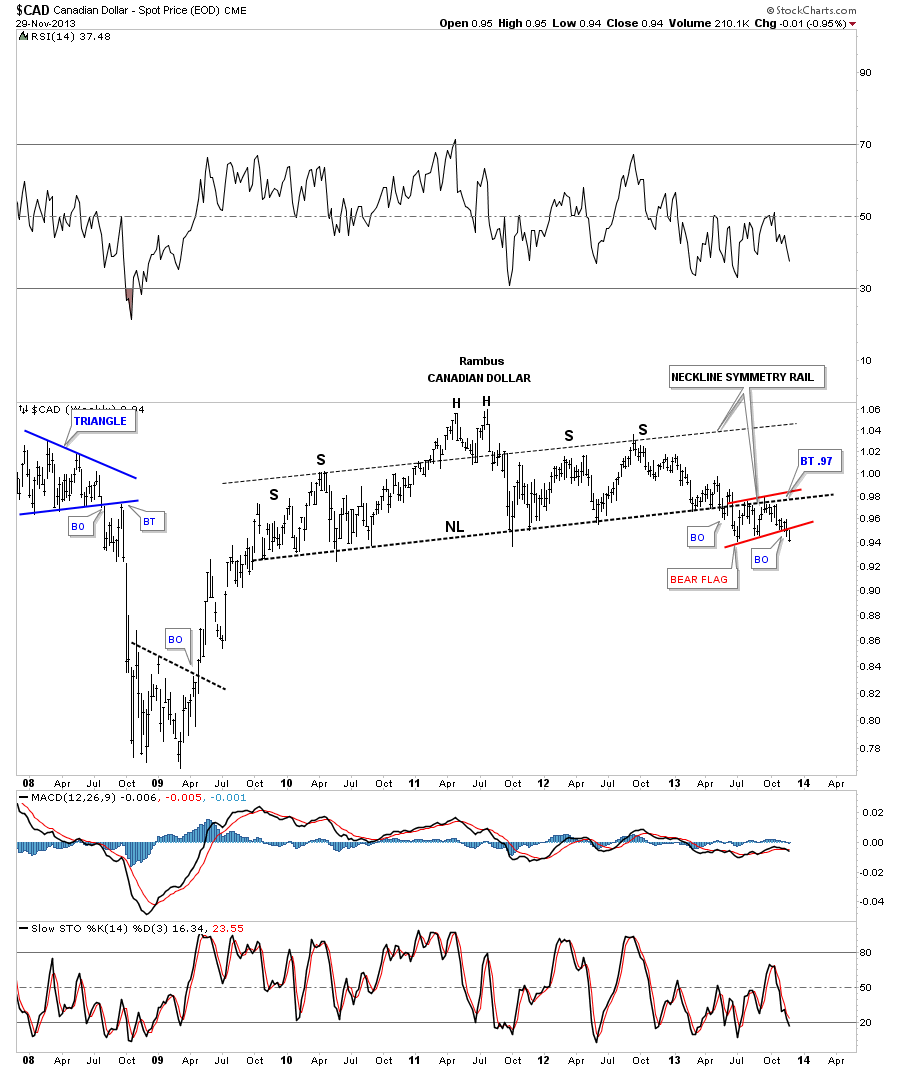
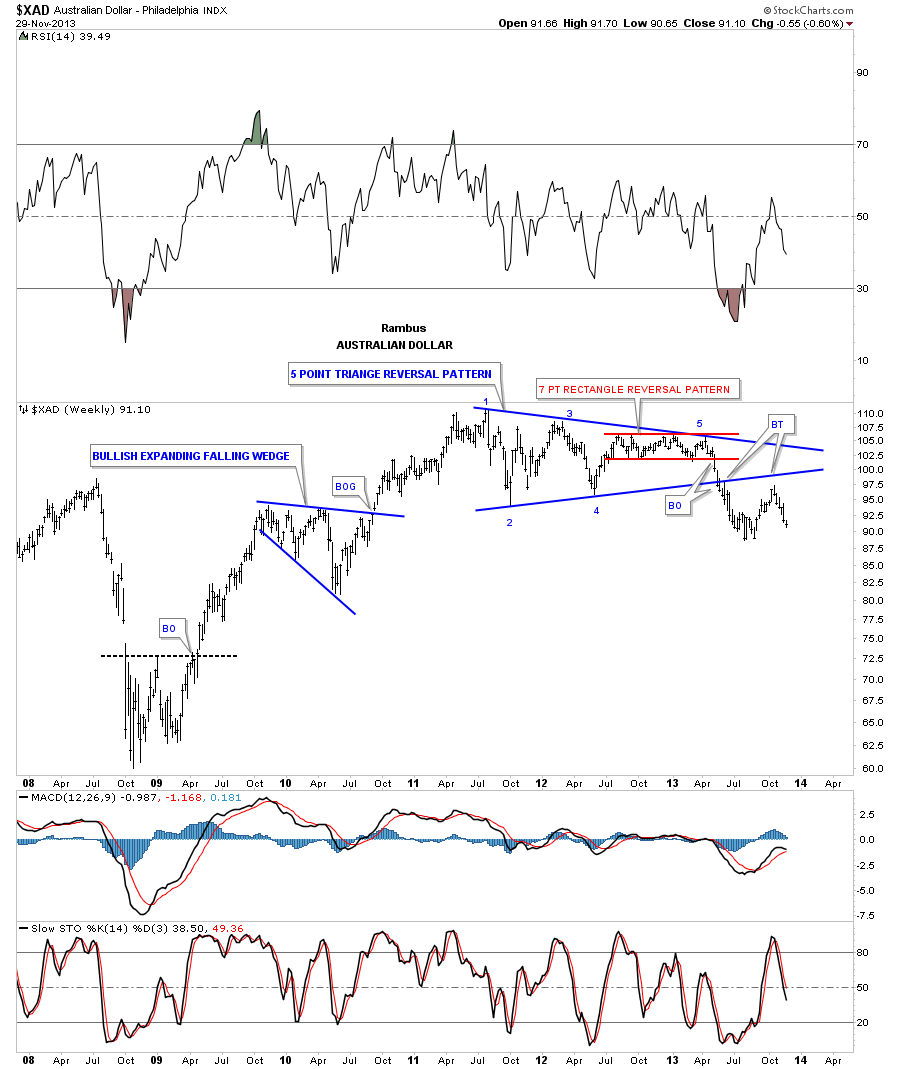
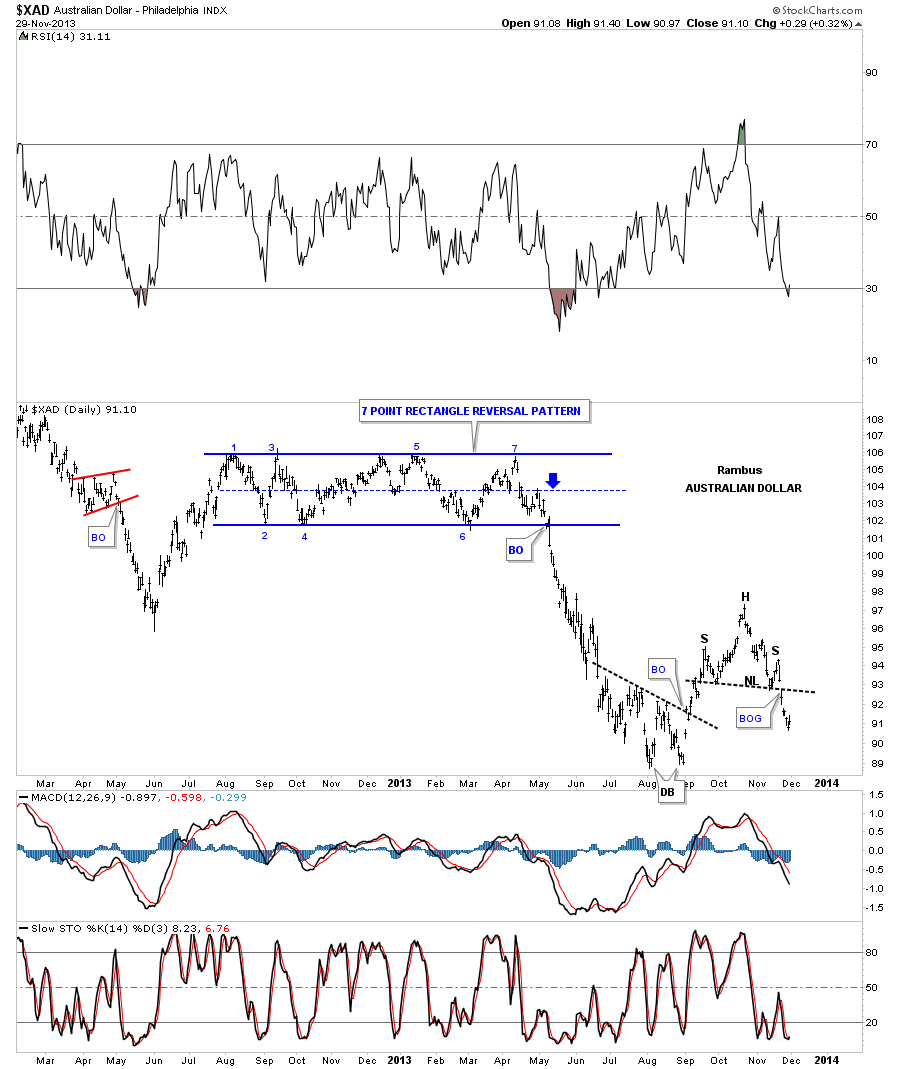
If you look at gold, it’s had two bear market cycles now, one in 2008 and one from 2011 to 2013. A good argument could be made that gold did not go into a mania in 2011 either. The hallmarks of a mania, over-ownership, over-supply, and excessive sentiment just weren’t present in 2011 for gold. Therefore once the sellers and buyers reach equilibrium in gold which is getting closer by the day, all it should take is new buying to reignite the gold bull market.
Connect with me on Twitter: @nextbigtrade
The original article and much more can be found at: http://www.nextbigtrade.com
The views and opinions expressed are for informational purposes only, and should not be considered as investment advice. Please see the disclaimer.


The Dow Jones Industrials rallied sharply with the Fed starting to taper. We have a near double top but today was a turning point and this week was also a target for a Panic Cycle which seems to be on point. However, while the market remains strong long-term, there are signs of some exhaustion starting to creep in. I the Dow cannot break to new highs and close higher tomorrow, we may still move back to retest support for Jan/Feb. A low at that time will point to a rally into the end of summer. A high in Jan/Feb in the 16650 level, could warn of a decline into that period with a rally into 2015.75. But a low, may signal the Cycle Inversion is developing now. That will warn of a very serious period between 2015.75 into 2020.05. TIMEremains constant. Events and Price are the variables.
Ed Note: I posted this chart below, not Martin, to reveal the Jan/Feb lows he is referring to:

…more from Martin: Fed Tapers Letting As Always the Lame Duck Do the Job

….”Normalization” Challenged by US Earnings.
WHOLESALE London gold sank against all currencies Thursday morning, falling 1.9% vs. the Dollar to hit 6-month lows after initially trading flat overnight despite the US Fed finally reducing its $85 billion per month in asset purchases.
Cutting next month’s quantitative easing of US mortgage and longer-term government bond rates to $75bn, the Fed pointed to “growing underlying strength in the broader economy.”
US stockmarket indices the S&P500 and the Dow surged to new all-time closing highs, while Treasury bonds fell and spot gold fell through this week’s previous low at $1230.
Besides the taper, however, the Fed revised its policy on short-term interest rates, saying it will hold the federal funds rate at zero “well past the time” that the US jobless rate falls to 6.5%, its previous line in the sand.
Overnight in Asia, Japanese shares rose but Chinese stocks fell as the People’s Bank of China broke its own rules and took to Weibo, the equivalent of Twitter, to announce a “short-term liquidity operation” after Shanghai’s interbank lending rate jump above 10%.
The PBoC usually waits a month before reporting such moves, says the Financial Times.
“It’s very clear they want to calm down market fears,” the FT quotes ANZ analyst Zhou Hao, noting the previous spike in Chinese interest rates in June, when US Fed chairman Ben Bernanke spoke about possible QE tapering.
Shanghai gold today fell 0.8% in Yuan but increased its premium over international prices from $6 to $11 per ounce.
Amongst Western investors, “More sensible minds realise,” says a note from David Govett at brokers Marex, “that on the whole [the Fed news] is not a good move for the precious complex.
“With further tapering probably to come over the course of next year, the outlook remains muted. However, I don’t subscribe to the theory that it’s all over for the bullion market [and] would be a buyer of dips if we do manage to break below $1200.”
Bids in London’s wholesale market briefly dropped below that level Thursday morning, hitting a 6-month low of $1199.75 per ounce.
Priced in Sterling and Euros, wholesale gold bullion fell to its lowest since spring 2010, down 29% and 31% respectively from the start of 2013.
Silver tracked gold in Dollars, briefly falling below $19.30 per ounce – a “key level” according to technical analysts at one bullion bank.
Fed tapering “highlights the overall positive sentiment towards the macro economy,” reckons UBS analyst Joni Teves.
“Equities are in fierce competition with gold for investor dollars, and this year’s trend of rotation away from gold into growth assets is expected to continue into 2014.”
“This is another sign of increasing normalisation for the world economy,” agrees Matthew Turner at Macquarie Bank. “Gold’s insurance function is less desirable in that environment.”
“But if the economy is accelerating as people think,” counters Albert Edwards in his latest Global Strategy Weekly for clients of French investment and London bullion bank Societe Generale, “how come Thomson Reuters has just reported the fastest pace of US earnings downgrades on record?
“If we are set for a profits-driven economic slowdown, then the low rate of core inflation will start to become a key concern. Deflationary forces are in fact stronger than even the latest [official data] suggests.”
Adrian Ash
Click HERE or on chart to choose different times

Gold price chart, no delay | Buy gold online
Adrian Ash is head of research at BullionVault, the secure, low-cost gold and silver market for private investors online, where you can fully allocated bullion already vaulted in your choice of London, New York, Singapore, Toronto or Zurich for just 0.5% commission.
(c) BullionVault 2013
Please Note: This article is to inform your thinking, not lead it. Only you can decide the best place for your money, and any decision you make will put your money at risk. Information or data included here may have already been overtaken by events – and must be verified elsewhere – should you choose to act on it.

U.S. home resales fell sharply in November to their lowest level in nearly a year, hurt by a rise in interest rates since the spring and ongoing price increases that have shut some home buyers out of the market.
The National Association of Realtors (NAR) said on Thursday that sales of previously owned homes dropped 4.3 percent last month, the third monthly fall in a row, to an annual rate of 4.90 million units.
That was the lowest annual rate since December 2012, and well below the median forecast in a Reuters poll of a 5.03 million unit pace.
“It is a clear loss in momentum for home sales,” NAR economist Lawrence Yun told reporters.
Mortgage interest rates have risen sharply since May on expectations the Federal Reserve would start winding down a bond-buying economic stimulus program. The Fed announced on Wednesday it would start tapering its monthly bond purchases next month.
Yun said the rise in mortgage rates, coupled with fast-rising prices, had made home buying less affordable for many Americans.
The data carried a hint, however, that home price gains may be cooling off. The median price nationwide rose 9.4 percent in November from the same month in 2012 to $196,300. It was the first time in a year that prices didn’t rise at a double-digit pace.
Yun said the NAR was “very concerned” about plans by the Federal Housing Finance Agency to reduce the maximum size of mortgages which can be bought by taxpayer-ownedfinance giants Fannie Mae and Freddie Mac. He said this could further impede the housing market’s recovery.

Why investors aren’t the only ones who will feel the pinch
The Federal Reserve’s funneling of trillions of dollars into the economy over the past five years has provided a shot in America’s arm. The stimulus has affected consumers more than they realize, experts say, as will the tapering.
 On Wednesday, the Fed announced it would begin to wind down the quantitative easing program known as QE3. Analysts say consumers should start to prepare now — especially those who are planning to buy a car or home within the next three to six months. “The stimulus program was supposed to boost spending going in, so it’s going to reduce spending going out,” says Peter Morici, economist and professor at the University of Maryland’s R.H. Smith School of Business.
Tapering may increase the cost of financing big-ticket items and rates on student loans. “If your furnace goes out and you only have $700 in the bank, you will either have to freeze or buy it in installments,” Morici says. “The same goes for any emergency repairs on your home.” Similarly, college students struggling under the weight of rising tuition fees may face a new challenge in 2014: rising interest rates on loans. “Colleges are already seeing concerns about this reflected in their applications,” Morici says. Law schools are facing a fall in admissions due to rising costs: 54% have reported cutting their entry law school classes for the 2013-14 academic year, according to the 2013 Kaplan Test Prep law school survey.
….read more HERE

-
I know Mike is a very solid investor and respect his opinions very much. So if he says pay attention to this or that - I will.
~ Dale G.
-
I've started managing my own investments so view Michael's site as a one-stop shop from which to get information and perspectives.
~ Dave E.
-
Michael offers easy reading, honest, common sense information that anyone can use in a practical manner.
~ der_al.
-
A sane voice in a scrambled investment world.
~ Ed R.
Inside Edge Pro Contributors

Greg Weldon

Josef Schachter

Tyler Bollhorn

Ryan Irvine

Paul Beattie

Martin Straith

Patrick Ceresna

Mark Leibovit

James Thorne

Victor Adair