Stocks & Equities

Should You Turn Bullish in 2014?

The year draws to a close. It will be one for the history books.

By the end of last week, 50 stock market records had been broken. And now the Dow pushes toward 17,000.

The overwhelming majority of investment advisors are bullish. Even longtime bears – such as Hugh Hendry, Jeremy Grantham and John Hussman – have decided to join the fun.

Here’s the Reuters report:

“I can no longer say I am bearish,” said Hendry today according to InvestmentWeek. “When markets become parabolic, the people who exist within them are trend followers, because the guys who are qualitative have got taken out.”

Speaking at the Harrington Cooper conference, Hendry argued that an ongoing currency war between the US and China will continue to force the Federal Reserve to keep monetary policy loose and easy.

“I may be providing a public utility here, as the last bear to capitulate,” he said. “You are well within your rights to say ‘sell.’ The S&P 500 is up 30% over the past year: I wish I had thought this last year.”

Hendry sounded pretty crestfallen. Here’s more from InvestmentWeek:

“I have been prepared to underperform for the fun of being proved right when markets crash. But that could be in three-and-a-half-years’ time.”

“I cannot look at myself in the mirror; everything I have believed in I have had to reject. This environment only makes sense through the prism of trends.” 

As Hendry said, he is not the first bear to “warn” that stocks are likely to go much higher from here. Here’s a roundup of some recent quotes we’ve heard from the long-time bears: 

John Hussman: “…we should neither expect, rely or be shocked by a further blowoff…”

Jeremy Grantham, GMO: “My personal guess is that the US market, especially the non-blue chips, will work its way higher, perhaps by 20% to 30% in the next year or, more likely, two years…”

Richard Russell: “I continue to think that this bull market will end in an upside explosion.”

Bob Janjuah, Nomura: “I still see end Q4 2013, through to end Q1 2014, as the window in which we see a significant risk-on top before giving way, over the last three quarters of 2014 and through 2015, to what could be a 25% to 50% sell-off in global stock markets.”

Uncharted Waters

Is there no one else? No one else? What are we? Chopped liver?

Yes, dear reader, everyone is thinking the same thing. Which means no one is thinking at all.

True, take a look at almost any stock market chart and you will see something that looks like it wants to go up further.

But who knows?

We are sailing in uncharted waters. No maps. No GPS. No road signs. No familiar landmarks. Central banks are all engaged in experimental monetary policy – on an epic scale. Now the financial markets – and perhaps the economy too – are hooked on it.

Two weeks ago, the Fed announced that it would begin scaling back its bond buying. Instead of buying $85 billion of Treasury and government-backed mortgage bonds a month, the Fed will now only buy $75 billion a month.

It was like an alcoholic who tells his wife he is cutting back on his drinking: “From now on, instead of a quart of Jameson a day, I will only drink a fifth of Wild Turkey.”

There was something insincere, too, about the Fed’s additional note – that it would keep interest rates near zero as long as it damned well pleased.

Stay on the Sidelines

Whatever comes of this, our guess is that the drinking spree is not over. In the meantime, anything can happen.

So what do you do?

Stay on the sidelines, we urge.

“But wait,” protests a family member, perhaps speaking for the majority of dear readers.

“Staying on the sidelines has been hugely costly. I don’t know if I want to stay on the sidelines while this stock market continues to go up.”

Ouch!

More and more people are asking the question. And more and more are sure of the answer: No. Which makes us wonder if there really are any buyers left… or whether the buying is a result only of the Fed’s QE.

But as far as we know, as long as the Fed keeps pumping, prices for stocks, Andy Warhol doodles and Manhattan apartments will keep going up.

But that doesn’t mean any of them are good investments.

Stocks, for example, are an option on a bigger Fed-induced bubble. But they’re not cheap.

A simple look at the 12-month “as reported” P/E for the S&P 500 will tell you that. (More on this below from Chris…)

Could this continue? Yes, of course. Or, it could blow sky-high.

Yes – 2013 was one for the history books; 2014 almost surely will be, too.

Regards,

Bill


Market Insight:

From the desk of Chris Hunter, Editor-in-Chief, Bonner & Partners

How to Shop in the ‘Bargain Basement’


A look at the price-to-earnings (P/E) ratio for the S&P on a 12-month “as reported” earnings basis reveals that the index is trading at 20.3 times earnings.

The historic average is a multiple of 15.5.

That means the S&P 500 now trades at a 31% premium to its historic average.

unnamed

What Blows Up First? Part 1: Europe

2013 was a year in which lots of imbalances built up but none blew up. The US and Japan continued to monetize their debt, in the process cheapening the dollar and sending the yen to five-year lows versus the euro. China allowed its debt to soar with only the hint of a (quickly-addressed) credit crunch at year-end. The big banks got even bigger, while reporting record profits and paying record fines for the crimes that produced those profits. And asset markets ranging from equities to high-end real estate to rare art took off into the stratosphere.

Virtually all of this felt great for the participants and led many to conclude that the world’s problems were being solved. Instead, 2014 is likely to be a year in which at least some – and maybe all – of the above trends hit a wall. It’s hard to know which will hit first, but a pretty good bet is that the strong euro (the flip side of a weakening dollar and yen) sends mismanaged countries like France and Italy back into crisis. So let’s start there.

The basic premise of the currency war theme is that when a country takes on too much debt it eventually realizes that the only way out of its dilemma is to cheapen its currency to gain a trade advantage and make its debts less burdensome. This works for a while but since the cheap-currency benefits come at the expense of trading partners, the latter eventually retaliate with inflation of their own, putting the first country back in its original box.

In 2013 the US and especially Japan cheapened their currencies versus the euro, which was supported by the European Central Bank’s relative reluctance to monetize the eurozone’s debt. The following chart shows the euro over the past six months:

Euro-dec-2013

Euro rises to more than 2-year high vs. dollar; yen falls 

The euro jumped to its strongest level against the dollar in more than two years on Friday as banks adjusted positions for the year end, while the yen hit five-year lows for a second straight session.

….continue reading HERE

Gold’s Rally and Dollar’s Decline or Vice Versa?

In our Dec. 20 commentary, we discussed the outlook for the USD Index, Euro Index, and how these currencies were likely to impact gold. We summarized the essay by writing that the situation was bullish for the USD Index, and bearish for the euro. We wrote that the implications for gold were bearish. That was 10 days ago and we haven’t seen any big price swings since then (except for an intra-day decline in the USD Index, but we will move to that in just a few paragraphs). Has anything changed? Was there any kind of confirmation or invalidation that would increase the bullishness of the situation for gold? Or, perhaps, the situation is even worse now than it was before (despite a small move higher)? Let’s take a look (charts courtesy ofhttp://stockcharts.com).

radomski december302013 1

From the long-term perspective, the outlook hasn’t changed at all and what we wrote on Dec. 20 remains up to date.

Despite a small decline that we have seen since the beginning of the month, the uptrend remains in place as the breakout above the declining long-term support line was not invalidated.

Now, let’s examine the weekly chart.

radomski december302013 2

Looking at the above chart, we see that at the end of the week we had a situation similar to those that we saw earlier in December. Like a week ago, the USD Index broke below the medium-term support line based on the February 2012, September 2012 and January 2013 lows (bold black line), but once again this deterioration was only temporary. The dollar quickly rebounded and invalidated the breakdown below this medium-term support/resistance line, which is a sign of strength and a bullish factor. At this point, it’s worth mentioning that this time the USD Index didn’t decline to the lower medium-term line based on the September 2012 and January 2013 lows (thin black line), which confirms the strength of the buyers. From this perspective, there was no true breakdown and the trend remains up.

Let’s check the short-term outlook.

radomski december302013 3

Looking at the above chart, we see that the USD Index extended its rally and moved higher breaking above both resistance lines (the horizontal support line based on the June low and the declining short-term resistance line) after our previous article was published. Although the greenback gave up the gains and declined in the following days, it confirmed the breakout above the declining short-term support/resistance line. At this point, we would like to draw your attention to the fact that although Friday’s intraday decline was sharp, it actually didn’t change much. The U.S. dollar moved below the declining short-term support/resistance line only very temporarily, without a breakdown in terms of daily closing prices, which is a positive signal. On top of that, this decline materialized right before the cyclical turning point.

This combination of factors creates a particularly bullish outlook and it could be the case that another rally in the U.S. dollar is just starting.

Let’s now take a look at the long-term Euro Index chart. HERE or the Chart for larger image:

4

The first thing that catches the eye on the above chart is the target area, which was reached once again. As you can see on the above chart, Friday’s intraday move took the Euro Index not only above the October high, but also the long-term declining resistance line based on the 2008 and the 2011 highs (in terms of weekly closing prices). However, as it turned out in the following hours, this improvement was only very temporary and finally, both breakouts were immediately invalidated. The currency index closed below these important resistance levels, which is a bearish signal and the outlook remains bearish.

What’s most interesting, gold didn’t follow that rally, which suggests that we’ll likely see further deterioration – similarly to that seen in the past.

In our previous article, we wrote the following:

(…)  a similar situation preceded a local top in precious metals. On top of that, previous tops (in 2008 and then in 2011) were followed by major declines in the precious metals sector. If history repeats itself we may see similar price action in this situation.

Please take a moment to compare the euro’s performance in the past few weeks with the performance of the precious metals sector (lower part of the above chart).

Let’s take a look at our Correlation Matrix to find out how the above may translate into precious metals and mining stock prices.

radomski december302013 5

The values of the correlation coefficients are basically unchanged from last week, so we will quote our previous comments – they are up-to-date.

Basically, the short-term numbers don’t tell us much at this time when we look at them directly, but can tell us something if we look a bit beyond them.

The correlation between the USD Index and the precious metals sector is slightly positive in the 30-day column (and even moderately significant in the case of the mining stocks), which tells us that in the past 30 days PMs and the USD Index moved on average in a similar direction. However, this was the case when they both declined – and when USD moved higher (this week), metals and miners declined even more. This is a very bearish combination – whatever USD does, the precious metals sector seems to either decline modestly or strongly.

Overall, the implications for the precious metals sector are bearish.

Having discussed the bearish impact from the currency markets (actually, even more bearish than last week because of the proximity of the cyclical turning point in the USD Index), the question remains if anything changed in case of the gold market itself. Click HERE or the image for larger view:

6

Not really. Generally, from the long-term perspective not much changed on the gold market. What we wrote in our previous article remains up-to-date as the breakdown below the rising long-term support/resistance line was not invalidated:

Gold didn’t manage to successfully climb above the rising long-term support line (not to mention staying above this line), which triggered a sharp decline. With this downward move, the yellow metal not only declined below last week’s low, but also slipped below the level of $1,200. These circumstances clearly show the weakness of the buyers and it seems that the previous 2013 low will be reached quite soon.

(…)

Please note that the exact target for gold is quite difficult to provide. In the cases of silver and mining stocks there are respectively: combinations of strong support levels, and a major support in the form of the 2008 low. In the case of gold, there are 4 support levels that could stop the decline and each of them is coincidentally located $50 below the previous one starting at $1,150: $1,150, $1,100, $1,050, and $1,000.

Summing up, looking at the current situation in both currencies, we are likely to see further deterioration in the Euro Index and improvement in the USD Index in the near future. As mentioned earlier in this section, the euro almost immediately invalidated both breakouts, which is a bearish signal. Additionally, the USD Index reversed course after a drop below the medium-term support lines (to be precise: similarly to what we saw last week, there was no true breakdown overall) and it seems that the bottom for this decline might already be in. On top of that, gold’s lack of will to really (!) react to positive news, like the dollar’s huge intra-day drop, is a bearish piece of information on its own and an indication that gold is likely to move lower in the short run – it seems that all it needs is a rally in the USD Index, which – as you can see above – will likely be seen shortly.

Thank you for reading. On behalf of the whole Sunshine Profits Team, I would also like to thank you for staying with us in 2013 and wish you a Happy and Prosperous 2014!

Przemyslaw Radomski, CFA

Founder, Editor-in-chief

Tools for Effective Gold & Silver Investments – SunshineProfits.com

Tools für Effektives Gold- und Silber-Investment – SunshineProfits.DE

* * * * *

Disclaimer

All essays, research and information found above represent analyses and opinions of Przemyslaw Radomski, CFA and Sunshine Profits’ associates only. As such, it may prove wrong and be a subject to change without notice. Opinions and analyses were based on data available to authors of respective essays at the time of writing. Although the information provided above is based on careful research and sources that are believed to be accurate, Przemyslaw Radomski, CFA and his associates do not guarantee the accuracy or thoroughness of the data or information reported. The opinions published above are neither an offer nor a recommendation to purchase or sell any securities. Mr. Radomski is not a Registered Securities Advisor. By reading Przemyslaw Radomski’s, CFA reports you fully agree that he will not be held responsible or liable for any decisions you make regarding any information provided in these reports. Investing, trading and speculation in any financial markets may involve high risk of loss. Przemyslaw Radomski, CFA, Sunshine Profits’ employees and affiliates as well as members of their families may have a short or long position in any securities, including those mentioned in any of the reports or essays, and may make additional purchases and/or sales of those securities without notice.

Gold makes people do wild things. Ancient Egyptians melted it to decorate their dead. Sir Walter Raleigh searched for alost golden city. Shiny flakes of it set off a 19thcentury rush to California and ship captains never stop looking for it at thebottom of the sea. Today’s investors are wildly selling it, with 2013 marking the first yearly gold-price drop since 2000. After jumping sevenfold during a 12-year bull market — a run matched by only a handful of assets, including U.S. Treasuries and stamps — it’s wallowing near a three-year low, down about a third from its peak. Only silver and corn performed worse among commodities in 2013.

….read more HERE

Leading Indicators from the Superstars of Resource Investing

Knowledge is money in resource investing. That is why The Gold Report reaches out to the top experts in the sector all year long to bring you their best investing ideas. For this special year-end feature, we asked some of your favorite thought leaders about the tools they use to spot trends and make those important buy-sell decisions. What are the early indicators that gold will rise, plummet or coast sideways? Is it Federal Reserve bond buying? China’s growth rate? Lipstick sales? You may be surprised by the answers.

COMPANIES MENTIONED: BHP BILLITON LTD. : FREEPORT-MCMORAN COPPER & GOLD INC.

Watch the Dollar: John Williams

The best way to predict gold is to follow its inverse indicator, the dollar. That is why ShadowStats Editor John Williams is closely watching central banks. “There has been an effort to discourage people from owning gold because a rally in the price of gold is generally taken as an indication of poor performance by the central banks,” he explains. The challenge with using central banks as an indicator, he warns, is that buying and selling by central banks is usually covert; it’s done through third parties. That can lead to a confused and dysfunctional market that ignores fundamentals and reacts with extremes to headlines.

One example is all the controversy over tapering or not tapering. When asked about the Federal Reserve’s announcement to begin tapering, Williams says, “I did not expect the Fed to back off in any meaningful way, and it did not. The minimal tapering likely was more politics in advance of the change in Fed chairmanship than anything else. The banking system remains in deep trouble, favoring ongoing quantative easing (QE3), and the economy remains weak enough to continue the needed political cover. Going forward, the Federal Open Market Committee (FOMC) allowed for expansion as well as further pull back in QE3, dependent on underlying conditions. Those conditions still favor expanded easing.”

Williams cautions that quantitative easing is bad news for the dollar relative to the rest of the currencies. “That will become very inflationary because weakness in the dollar tends to spike oil and gas prices. And that’s the number one area of cost-push inflation we’ve seen in the last couple of years. The long-term result can only be higher inflation, a much weaker U.S. dollar and, eventually, higher gold prices.”

He continues, “The dollar is the basic indicator here and I am looking for heavy selling. In fact we’ve been seeing some recent weakness in the dollar particularly against the Swiss franc.”

Williams does not see official unemployment numbers as a reliable indicator. “The employment rate today is down 0.8% from last year. Normally the drop in the unemployment rate would be good news because it means that the number of people unemployed would be declining, people are going back to work and employment is rising. But in reality, the only reason the headline number has gone down is that some of the unemployed people are no longer being counted because they’ve become discouraged. They want a job, they want to work, but nothing is available.”

When it comes to the all-important consumer confidence indicator, Williams was also careful about what statistics he uses. “The consumer tends to drive the economy so you need to look at things that drive consumer liquidity. One of the best indicators is median household income adjusted for inflation. It never recovered from the recession. In fact, as the recession supposedly ended and the economy bounced back, household income continued to plunge and is holding at its cycle low. And that cycle low is lower than median household income—adjusted for the consumer price index—was back in 1967–1970. The consumer is in terrible trouble here.”

Consumer credit, despite some public statistics, is also not recovering in a meaningful way, according to Williams. “All the growth has been in student loans, not in loans that buy dishwashers and automobiles. If that should start to pick up that would be a positive sign. As long as it stays as it is, it’s a negative sign.”

Consumer confidence, which Williams considers a coincident indicator, has been volatile and not any more positive. “The level of confidence still is at levels that are traditionally seen deep in recessions, not in economic recoveries. We are not having an economic recovery.”

He explains further, “The only reason that you see growth in the gross domestic product (GDP) is that the rate of inflation is understated. The implication there is a big negative for the dollar. Relative economic activity is always an important factor in the dollar’s strength.”

Williams is concerned that people will be shocked with downside surprises as the country enters what will be formally recognized as a new recession. “It’s bad news for the budget deficit because all the happy forecasts are based on solid 3–4% economic growth in the GDP instead of continued stagnation and contraction, which will result in lower tax revenues. Government spending in the support programs will be higher and the deficit will widen. That is what the markets are deadly misreading and that will be a big negative for the dollar.”

Williams also counsels watching presidential approval ratings, which are at a low right now. “Usually a president’s approval rating is a pretty good indicator of where the dollar is going because it indicates how the rest of the world views the U.S. government. All these factors are leading to significant downside pressure on the dollar. I think we are going to see a tremendous dollar selloff in the not-too-distant future and the biggest gainers should be gold and silver and the precious metals.

Ride the Cycles: Gary Savage

Like Williams, Gary Savage, publisher of Smart Money Tracker, watches the dollar very closely. “We will have a currency crisis,” he says. “Gold prices can’t stay where they are. They will go much higher. It often starts slowly, but it will happen.”

Savage uses cycle analysis and his charts show “a major low is coming. It happens every three years. This one will be similar to what happened in 2008. Money printing spikes inflation. It will have a severe impact on commodities,” he says. “It is too late to stop inflation after years of quantitative easing unless the government were to sell massive amounts of bonds. Tapering might have a slight impact but inflation can’t be stopped at this point.”

Indicatorschart565

“Market seasons are like emotions,” he explains. “We overdo the excitement and then get depressed. We tend to go to extremes. The first phase of inflation is already in place. We just don’t call it that because it is stored in the stock market. When that busts because it is overvalued, money will leak into commodities. Gold and silver will be the biggest beneficiaries because they were hit the hardest.”

Capitalize on Greed/Fear Indicators: James Dines

James Dines, editor of The Dines Letter, watches the psychological state of the market and likes what he sees. “Our longtime optimism has been based largely on leading market Averages in solid Uptrends. Mass Psychology is one of our key tools, and Mass Fear all the way up has confirmed the bullish outlook, according to the Dines Theory of Positive Negativism (DITPON),” he shares. Descriptions of these two measurements are included in his battery of over 200 Indicators, called the Dines Greed/Fear Oscillator (DIGFOI).

On a short-term basis, the October Dines Letter looked for some selling to enter markets in November, followed by a December rally. “In November the Advance/Decline Index indeed turned down, on schedule, and we’re now waiting for the December rally, which is late,” he acknowledges. “Whether this changes our big Annual Forecast Issue for 2014 is now being decided, but we are staying with serious winners such as Boeing, 3D Systems, Amazon, Priceline. If they begin to break their Uptrend lines, it might be a factor in calling for an admittedly overdue market ‘Sell’ signal.” Meanwhile, he observes, technology and biotechnology have been producing “killings,” and Uptrends are generally intact as of today.

In the raw materials sector, Dines sees a continuation of “a devastating crash” that includes everything from soft commodities to metals (including rare earths, uranium and even precious metals). “We appear to be the only member of the world’s press inquiring how there could be an economic upturn without using raw materials, a topic that will be covered in depth in our upcoming Annual Forecast Issue, as it is a key to unlocking the puzzle of what is really happening to the economy and how to adjust portfolios for 2014.” For the moment, he recommends “let your profits run until Uptrend lines are broken.”

Follow the Bureaucrat: Frank Holmes

U.S. Global Investors CEO Frank Holmes sees government policies as a precursor to change. “One of the big picture things we look at is a comparison of the G7 countries (the U.S., U.K., France, Germany, Italy, Canada and Japan ) and the E7 countries (the seven most populated countries in the world, China, Russia, India, Indonesia, Mexico, Brazil and Turkey),” he says. “We look at money supply and money supply growth. As money supply rises it’s usually a reflection of lending/borrowing and economic activity. The E7 countries represent 50% of the world’s population, but 25% of GDP, whereas the G7 are 50% of GDP and less than 1% of the population.

“After the 2008 crash, the Chinese increased money supply growth to 30% to jumpstart their economy and that led to a huge boom in 2009. Fiscal policies, such as deregulation, trade agreements and tax-free zone designations are very important for stock performance.” Holmes uses the example of Spain, which eased policies for Russian and Chinese tourist visas, leading to a jump of 38% in luxury goods sales. England did the same slightly later in the year and its luxury goods sales jumped 25%. The French did not and they realized a 2% drop in sales. “More regulations result in slowdowns in economic activity, and streamlining of regulations unleashes economic activity,” he says.

Holmes also follows PMIs, the Purchasing Manufactures Index. “That is one of the best indicators for commodity demand because you need commodities to manufacture things. When Bernanke was going to pull away the punch bowl for the U.S. economy, it had a huge rippling effect in emerging countries as things went into a tailspin. At the same time, the PMIs of Germany turned positive. We were long on Mercedes cars. France’s PMI turned positive, then China followed,” he observes. He compares one month to three month global PMIs because they are historically a leading indicator to the demand for commodities. “You can do regression studies going back 20 years and they are a healthy leading indicator. The world has turned positive and has been positive now for many months. This is important as a backdrop because eventually all this mineral inventory surplus will just be consumed. Then we will start seeing commodity prices start to rise.”

Not all commodities move together, however. “Domestic energy stocks are laggers,” Holmes says. He sees natural gas at $4 per thousand cubic feet as a positive sign. “Once you start seeing steel pick up and nickel pick up, that indicates activity in the automobile sector, which means demand for zinc, iron ore and met coal. It is a chain effect and copper will follow.”

Holmes doesn’t just rely on numbers. “I am a believer in the dual-knowledge model—explicit knowledge and passive knowledge.” That is why he and his team are constantly traveling and getting a sense of how people feel at ground level. Something he has seen recently is the role of private equity rather than the equity markets in driving capital formation. “Money is going from pension funds, sovereign funds and endowments into private equity with strict requirements. Several private equity firms are looking at the mining space. They are looking for up to 18% returns on their money,” he said.

Holmes also tracks gold prices as he travels. At the open market gold jewelry stores in India, 24 karat gold jewelry was trading at $1,600/ounce ($1,600/oz) when he was there in November. “That is important. Physical gold is more expensive now in places like India. Expensive luxury goods stores are packed and they’re selling, as are $100-million homes. India produces some 400,000 Ph.D.’s a year, about four times what America produces. More than 600 million people in India are under the age of 25. That is two Americas. They are all wired and looking for the American dream. That’s not going away.”

Those observations are part of the reason Holmes is still positive about the resource space despite the disappointment in the gold sector in 2013. He also thinks investors and mining companies had learned something in the last year that could make a difference in 2014. “Gold mining companies have to clean up their act and become more focused, not on growing for the sake of growth, but on margins, streamlining operations. I think you’re going to see gold production slow down. All these brownfields aren’t going to come onstream. And they have to learn how to communicate with shareholders and the public if they are going to get shelf space in portfolios. I think that’s positive longer-term for gold.”

Holmes has some favorites. “I like copper gold stocks, like Freeport-McMoRan Copper & Gold Inc. (FCX:NYSE), I think they’re important in your portfolio and I’d rather own Freeport over Newmont Mining Corp. (NEM:NYSE) in the big-cap space. Energy is going to continue to remain strong. Master limited partnerships (MLPs) are a huge competitive advantage for the formation of capital to build out the infrastructure from pipelines, ports, and facilities that take wet gas and convert it into oil. It’s going to continue to be an attractive asset class.”

And rain or shine, Holmes advocates a diversified portfolio that includes 10% weighting max in gold, rebalanced each year. “Even with the stock market at all-time highs, that 90/10 rule will ensure you don’t get caught in the fear trade. You should be long 25% including resources, energy and MLPs. You could have a very attractive portfolio in the resource sector and make dividend yields that are much greater than 5- or 10-year government bonds and get good growth opportunities. You might even look at BHP Billiton Ltd. (BHP:NYSE; BHPLF:OTCPK) and Franco-Nevada Corp. (FNV:TSX; FNV:NYSE), which pays a monthly dividend. There are still a lot of opportunities in resources,” he concludes.

Focus on Silver-to-Gold Ratio: Bob Hoye

Bob Hoye, chief financial strategist of Institutional Advisors, says the most important indicator is the silver:gold ratio. “We have found over the decade that when you’re in a bull market for gold and silver, silver will outperform gold. It always does.”

Hoye uses a Relative Strength Index (RSI), which measures momentum. “When that gets into the 70s, speculation is getting pretty irresistible. Anything above 80 is a sign of mania,” he warns. He pointed to 2011, when the RSI was 92 for the first time since 1980. That was also when a huge bubble of $850/oz gold and $60/oz silver blew out. That was when the Hunt brothers attempted to corner silver and the silver:gold ratio was pushed to 16:1. By September of 2012, the RSI on the silver:gold ratio was 84. That was dangerous territory and warned of a substantial correction. “We have been trading intermediate swings until May of this year when things got very oversold. The damage that has been done is immense,” he laments.

But Hoye forecasts some upside in 2014. “Since September 2012, the gold market has come down while the stock market has gone up. We have seen RSIs down into 33–30 and wild action in stocks and bonds. Somewhere in the next few weeks, it should reverse. The stock market is very extended.”

Hoye doesn’t think the recovery will be across the board. “Crude oil got a bit oversold over the summer and did a nice bounce from $92 to $97/barrel. That’s over and done now. We’re looking for a bottoming process in base metals and commodities. We could be past the bottom and in the new year further move up in these, which would then help out the precious metals. The opportunity in precious metals, once the turn is made, will probably last longer than the bounce in the base metals.”

Of course that will bode well for the juniors, Hoye further predicts. “When you’re at a low, it is hard to buy, but the successful juniors have terrific leverage on the gold price. The whole sector will move once it does turn.”

Dig Deeper: Jeff Clark

Jeff Clark, senior precious metals analyst at Casey Research, is a headline watcher. “The trick is to dig deeper and put statistics in a historic and global perspective,” he warns. When the headline was that central banks were buying record amounts of gold over a three-year period, he looked at the historic gold holding levels and found they were actually at all-time lows because banks had been selling for decades. When Goldman Sacks put out a “sell gold” order in Q2/13, he looked at the report released the following quarter and figured out they were actually the largest holder in SPDR Gold Shares (GLD) because they had been doing so much buying previous to the order. When rosy economic numbers are released, he asks more questions to see if the jobs are part time or if the unemployment rate shrunk because people became discouraged and dropped out of the job market. When investing demand is shown as low compared to jewelry fabrication demand, he puts that in perspective with what he knows about the culture in India where gold jewelry is not a decorative item, it is a store of wealth.

The bottom line? “The XAU:dollar ratio is at the lowest level in history right now so it is a great buying opportunity for equities, regardless of what the headlines are saying. I need to be buying gold,” he said.

Looking Forward: Rick Rule

Finally, industry veteran Sprott Global Resource Investments Founder Rick Rule takes a long-term view. He is closely monitoring all-in commodity pricing, costs and availability of development finance. He wanted to know commodity utility to users at current pricing. The indicators are whispering in his ear: “Prepare for a soft 2014 followed by a very strong 2015.”

You heard it first in The Gold Report.

Walter J. “John” Williams has been a private consulting economist and a specialist in government economic reporting for more than 30 years. His economic consultancy is called Shadow Government Statistics (shadowstats.com). His early work in economic reporting led to front-page stories in The New York Times and Investor’s Business Daily. He received a bachelor’s degree in economics, cum laude, from Dartmouth College in 1971, and was awarded a master’s degree in business administration from Dartmouth’s Amos Tuck School of Business Administration in 1972, where he was named an Edward Tuck Scholar.

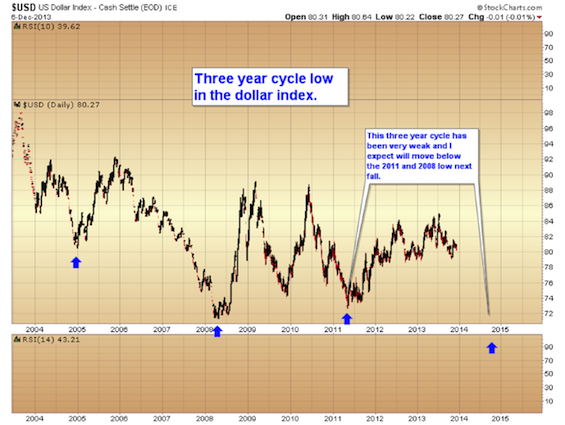
Gary Savage is the author and publisher of the Smart Money Tracker since 2007. He lives in Las Vegas and is a retired entrepreneur. Savage is also a national Judo champion and multitime national weightlifting champion, as well as the 1996 World Masters Weightlifting champion.

James Dines is legendary for having made correct forecasts that were in complete contradiction to the rest of the financial community. He is the author of five highly regarded books, including “Goldbug!,” in addition to his popular newsletter, The Dines Letter, and videotaped educational series. Dines’ highly successful investment strategies have been praised by Barron’s, Financial Times, Forbes, Moneyline andThe New York Times, among others.

Frank Holmes is CEO and chief investment officer at U.S. Global Investors Inc., which manages a diversified family of mutual funds and hedge funds specializing in natural resources, emerging markets and infrastructure. The company’s funds have earned many awards and honors during Holmes’ tenure, including more than two dozen Lipper Fund Awards and certificates. He is also an adviser to the International Crisis Group, which works to resolve global conflict, and the William J. Clinton Foundation on sustainable development in nations with resource-based economies. Holmes co-authored “The Goldwatcher: Demystifying Gold Investing” (2008). Holmes is a former president and chairman of the Toronto Society of the Investment Dealers Association, and he served on the Toronto Stock Exchange’s Listing Committee. A regular contributor to investor-education websites and a much-sought-after keynote speaker at national and international investment conferences, he is also a regular commentator on the financial television networks and has been profiled by Fortune, Barron’s, The Financial Times and other publications.

Bob Hoye is chief financial strategist of Institutional Advisors and writes Pivotal Events, a weekly market overview. His articles have been published by Barron’s, Financial Post, Financial Times and National Post.

Jeff Clark, senior precious metals analyst, Casey Research. The son of an award winning gold panner, Clark helps work his family’s placer claims in California, Nevada, and Arizona. Gold is never far from his mind or his heart. While working as a psychological counselor, Jeff invested in the IPO of Snapple, made a bundle, and discovered how very profitable speculating can be.

Rick Rule, founder and chairman of Sprott Global Resource Investments Ltd., began his career in the securities business in 1974. He is a leading American retail broker specializing in mining, energy, water utilities, forest products and agriculture. His company has built a national reputation on taking advantage of global opportunities in the oil and gas, mining, alternative energy, agriculture, forestry and water industries.

Want to read more Gold Report interviews like this? Sign up for our free e-newsletter, and you’ll learn when new articles have been published. To see a list of recent interviews with industry analysts and commentators, visit our Streetwise Interviews page.

DISCLOSURE:
1) JT Long conducted this interview for The Gold Report and provides services to The Gold Report as an employee. She or her family own shares of the following companies mentioned in this interview: None.
2) The following companies mentioned in the interview are sponsors of The Gold Report: None. Franco-Nevada Corp. is not affiliated with The Gold Report. Streetwise Reports does not accept stock in exchange for its services or as sponsorship payment.
3) The interview does not constitute investment advice. Each reader is encouraged to consult with his or her individual financial professional and any action a reader takes as a result of information presented here is his or her own responsibility. By opening this page, each reader accepts and agrees to Streetwise Reports’ terms of use and full legal disclaimer
4) From time to time, Streetwise Reports LLC and its directors, officers, employees or members of their families, as well as persons interviewed for articles and interviews on the site, may have a long or short position in securities mentioned and may make purchases and/or sales of those securities in the open market or otherwise.


test-php-789