
Personal Finance
The stock market has certainly produced its share of heroes and villains over the years. And while villains have been many, the heroes have been few.
One of the good guys (for me, at least) has always been Jesse L. Livermore. He’s considered by many of today’s top Wall Street traders to be the greatest trader who ever lived.
Leaving home at age 14 with no more than five bucks in his pocket, Livermore went on to earn millions on Wall Street back in the days when they still literally read the tape.
Long or short, it didn’t matter to Jesse.
Instead, he was happy to take whatever the markets gave him because he knew what every good trader knows: Markets never go straight up or straight down.
In one of Livermore’s more famous moves, he made a massive fortune betting against the markets in 1929, earning $100 million in short-selling profits during the crash. In today’s dollars, that would be a cool $12.6 billion.
That’s part of the reason why an earlier biography of his life, entitled Reminiscences of a Stock Operator, has been a must-read for experienced traders and beginners alike.
…Continue Reading 9 Lessons HERE

For a biography on Jesse Livermore click HERE
Here’s an interesting article by the author of NINE LESSONS FROM THE GREATEST TRADER WHO EVER LIVED
Bitcoin Is Defeating Governments (and Making Investors Rich)

After the announced “tapering” all the doubts were centered around the question, how big the “tapering” is. All trails lead us to speculation about how the so-called backing out could influence the market in the long run. First let us illustrate all the different versions of Quantitative and Qualitative Easings (episode 1, episode 2, episode 3…) that happened since 2009. Here is a graph that you’re already familiar with, depicting an immense growth in the balance sheet of the Federal Reserve since 2009. Contrary to graphs presented previously in the Market Overview, which summed up government securities and mortgage backed securities bought by the Federal Reserve and presented them in total:

Almost four trillion dollars in printing has occurred since the beginning of the crises. Naturally many mainstream economists could object and will comfortably argue that it is not really printing, but merely “stimulating”. Since we are not cranking up the press and we are not literally handing out the money to people, there is no real printing going on. If there was, the hyperinflationary bomb would probably kill the economy. Rather than that the money is created for the sole purpose of bidding up the prices of various assets (government and bank friends). Surely this is not the usual printing one could expect in Zimbabwe, but this does not change the fact that money is being created in order to sustain various financial beneficiaries associated with the current fiat money order. And this fact alone cannot be omitted.
Four trillion printing/bidding is a big thing, especially in light of the fact that before 2009 the Fed held no mortgage-backed securities, but mostly government bonds (in much, much smaller amounts than right now). Here lies the bailout aspect of the whole mechanism – a certain cocooned part of the financial market is being subsidized. In the case of the government the subsidizing is directed at all government benefactors, whereas in the case of MBS we have obvious crony capitalism at work.
Setting this issue aside, let us stipulate what exactly this taperie is all about. The tapering is not with the big “T”, not as many saw it. Is it a big cut, reversal, backing out from the previous expansionary policies? The buying program is still firmly in place and looks as expansionary as before. Actually it is more expansionary than it was in the significant part of the years 2011 and 2012, when the balance sheet was frozen.
We cannot therefore really debate how the change should affect the overall the economy simply because… There is no significant change at all.
The above is a small excerpt from our latest Market Overview report. If you would like to learn more about tapering, Fed’s approach, general trends in the monetary policies that affect virtually every market, I invite you to subscribe to my monthly Market Overview report.
Thank you.
Matt Machaj, PhD
Sunshine Profits‘ Market Overview Editor
Gold Market Overview at SunshineProfits.com
* * * * *
Disclaimer
All essays, research and information found above represent analyses and opinions of Matt Machaj, PhD and Sunshine Profits’ associates only. As such, it may prove wrong and be a subject to change without notice. Opinions and analyses were based on data available to authors of respective essays at the time of writing. Although the information provided above is based on careful research and sources that are believed to be accurate, Matt Machaj, PhD and his associates do not guarantee the accuracy or thoroughness of the data or information reported. The opinions published above are neither an offer nor a recommendation to purchase or sell any securities. Matt Machaj, PhD is not a Registered Securities Advisor. By reading Matt Machaj’s, PhD reports you fully agree that he will not be held responsible or liable for any decisions you make regarding any information provided in these reports. Investing, trading and speculation in any financial markets may involve high risk of loss. Matt Machaj, PhD, Sunshine Profits’ employees and affiliates as well as members of their families

Global FOOD PRICES to RISE, GOLD MANIPULATION, CHINA & more
 A brief summary of Rogers on Gold from the interview :
Gold has had a nice runup for over a decade now, but it has taken a beating this year. The yellow metal is currently trading at three-year lows. We reached out to commodities expert Jim Rogers for his take on what will happen next in the gold markets.
Jim Rogers: I am useless as a market timer/trader. Having said that, a 50% correction is normal in markets so why not in gold? The 12-year rise was an anomaly in markets so the correction may continue to be an anomaly. There will be rallies after big drops, but I expect another opportunity to buy gold.
JR: [1] The anomaly of the 12-year rise, for one thing. [2] India as we have discussed before. Indian politicians are blaming their problems on gold, so [they] have added special taxes, tariffs, controls, and regulations. Pakistan and Bangladesh even totally banned imports of gold at one time.
The politicians are now trying to figure out ways to force Indians to sell gold. There are staggering amounts of gold there. The politicians are now trying to hit the temples which have accumulated an unimaginable amount of gold over the centuries. I have no idea if they will succeed at either, but the effort is having an effect. If they are successful to any degree, it will have an even bigger effect. India has been the largest buyer of gold for decades. Cutting back the purchases has already had an effect. IF they can force the largest buyer to become a seller [much less a larger seller], who knows how low gold could go? [3] A lot of people leveraged themselves too which hurts on the downside. Etc., etc.
BI. Are you buying gold? If not when would you buy gold?
JR: No. Most of them are still denying reality saying it cannot happen, etc. They are also blaming it on manipulation still. They did not blame anything on manipulation on the way up, but are now finding all sorts of excuses. [I also find it interesting that I have not seen a single comment from them or anyone else about changes in India — the largest buyer in the world. The whole thing is “manipulation”.]

Black Swans, Yellow Gold
by Michael J. Kosares
(The following is the first of a five-part series on how gold performs during periods of deflation, chronic disinflation, runaway stagflation and hyperinflation. The first installment examines gold’s safe-haven role during a deflationary event like the global 1930s economic depression.)
“The inability to predict outliers implies the inability to predict the course of history. . .But we act as though we are able to predict historical events, or, even worse, as if we are able to change the course of history. We produce thirty-year projections of social security deficits and oil prices without realizing that we cannot even predict these for next summer — our cumulative prediction errors for political and economic events are so monstrous that every time I look at the empirical record I have to pinch myself to verify that I am not dreaming. What is surprising is not the magnitude of our forecast errors, but our absence of awareness of it.”
– Nicholas Taleb, The Black Swan — The Impact of the Highly Improbable, 2010
“Having been mugged too often by reality, forecasters now express less confidence about our abilities to look beyond the immediate horizon. We will forever need to reach beyond our equations to apply economic judgment. Forecasters may never approach the fantasy success of the Oracle of Delphi or Nostradamus, but we can surely improve on the discouraging performance of the past.”
– Alan Greenspan, The Map and the Territory, 2013
Introduction
This short study examines gold’s performance under the four most commonly predicted worst-case economic scenarios — a 1930s-style deflation, chronic Japanese-style disinflation, a 1970s-style runaway stagflation, and a Weimar-style hyperinflation. “That men do not learn very much from the lessons of history,” Aldous Huxley once wrote, “is the most important of all the lessons of history.” Though I agree with Huxley’s assessment when applied to contemporary policymakers and central bankers, I do not agree with it when applied to their counterparts in the private sector, i.e., the individual investors. As justification, I offer the ongoing (and long-term) success of the USAGOLD website as well as the soaring statistics of late on private gold ownership both here and abroad, most of which has been accumulated for safe-haven purposes. Individually, we can and do learn the lessons of history even if we do not always do so collectively.
Black Swans, Yellow Gold is dedicated to those who believe, like Nicholas Taleb, that it is just as important to prepare for what we cannot foresee as what we can. Some might put their money on the latest Oracle of Delphi or the contemporary reincarnation of Nostradamus — or even an all-seeing eye plug-in that can be downloaded from the internet — but in the end, such notions are the dreams of government planners and retired central bankers. For the rest of us, a solid hedge in gold coins, as your are about to read, is the more sensible and reliable alternative — a wealth haven for all seasons.
We invite you to return to these pages periodically for the second installment in this series which we plan to publish next week.

Gold as a deflation hedge (United States, 1929)
WEBSTER DEFINES DEFLATION AS A “CONTRACTION IN THE VOLUME of available money and credit that results in a general decline in prices.” Typically deflations occur in gold-standard economies when the state is deprived of its ability to conduct bailouts, run deficits and print money. Characterized by high unemployment, bankruptcies, government austerity measures and bank runs, a deflationary economic environment is usually accompanied by a stock and bond market collapse and general financial panic — an altogether unpleasant set of circumstances.
The Great Depression of the 1930s serves as a workable example of the degree to which gold protects its owners under deflationary circumstances. First, because the price of gold was fixed at $20.67 per ounce, it gained purchasing power as the general price level fell. In 1933, when the U.S. government raised the price of gold to $35 per ounce in an effort to reflate the economy through a formal devaluation of the dollar, gold gained even more purchasing power. President Franklin D. Roosevelt also confiscated gold bullion by executive order in concert with the devaluation, but exempted “rare and unusual” gold coins which later were defined by regulation simply as items minted before 1933. As a result, only those citizens who owned gold coins dated before 1933 were able to reap the benefit of the higher fixed prices. The accompanying graph illustrates those gains, as well as the gap between consumer prices and the gold price.

Gold as a deflation hedge
Second, since gold acts as a stand-alone asset that is not another’s liability, it functioned as an effective store of value prior to 1933 for those who either converted a portion of their capital to gold bullion or withdrew their savings from the banking system in the form of gold coins before the crisis struck. Those who did not have gold as part of their savings plan found themselves at the mercy of events when the stock market crashed and the banks closed their doors (many of which had already been bankrupted).
How gold might react in a deflation under today’s fiat money system is a more complicated scenario. Even deflation under a fiat money system, the general price level would be falling by definition. Economists who make the deflationary argument within the context of a fiat money economy usually use the analogy of the central bank “pushing on a string.” It wants to inflate, but no matter how hard it tries the public refuses to borrow and spend. (If this all sounds familiar, it should. This is precisely the situation in which the Federal Reserve finds itself today.) In the end, so goes the deflationist argument, the central bank fails in its efforts and the economy rolls over from recession to a full-blown deflationary depression.
How the government treats gold under a deflationary scenario will play heavily into its performance:
– If gold is subjected to price controls and restricted ownership, as it was in the 1930s deflation, it would likely perform as it did then, i.e., its purchasing power would increase as the price level fell. Under such circumstances, the ownership of “rare and unusual” gold coins might once again come into play.
– If ownership is not restricted, it would turn out to be the best of all possible worlds for gold owners. Its purchasing power would increase as the price level fell, and the price itself could rise as a result of increased demand from investors hedging systemic risks and financial market instability.
Note: That, by the way, is the primary reason governments tend to restrict gold ownership when confronted with widespread bank runs and failing financial markets. Governments seize gold not because they need the money; they seize it to cut off the escape route and force capital flows back into banks and financial markets. As an aside, that is precisely the reason why governments have an interest in controlling the price of gold. Former Fed chairman Paul Volcker, it has been copiously reported, once said, “Gold is my enemy. I’m always watching what it is doing.” Though there is no direct evidence I know of that the Fed or Treasury Department intervened directly in the gold market during Mr. Volcker’s tenure, his statement does reflect the acute interest in gold on the part of monetary policy-makers. Alan Greenspan voiced a similar interest in gold throughout his Fed chairmanship and still does today, though unlike Volcker he has always defended gold and expressed an appreciation for its use as a form of money or final payment or reconciliation. Gold, in the end, is not just competition for the dollar; it is competition for bank deposits, stocks and bonds most particularly during times of economic stress — and that is the source of enduring interest among policy-makers.
THE STOCK MARKET OUTLOOK FOR JANUARY 17, 2014
Upcoming US Events for Today:
- Housing Starts for December will be released at 8:30am. The market expects 0.985M versus 1.091M previous. Building Permits are expected to show 1.015M versus 1.007M previous.
- Industrial Production for November will be released at 9:15am. The market expects a month-over-month increase of 0.3% versus an increase of 1.1% previous. Capacity Utilization is expected to tick up to 79.1% versus 79.0% previous.
- Consumer Sentiment for January will be released at 9:55am. The market expects 83.5 versus 82.5 previous.
- Labor Department’s Job Openings and Labor Turnover Survey for November will be released at 10:00am. The market expects Job Openings to show 3.93M versus 3.925M previous.
Upcoming International Events for Today:
- Great Britain Retail Sales for December will be released at 4:30am EST. The market expects a year-over-year increase of 2.6% versus an increase of 2.0% previous.
- China GDP for the Fourth Quarter will be released on Sunday at 9:00pm EST. The market expects a year-over-year increase of 7.6% versus an increase of 7.8% previous. Industrial Production for December is expected to show an year-over-year increase of 9.8% versus an increase of 10.0% previous. Retail Sales for December is expected to show a year-over-year increase of 13.6% versus an increase of 13.7% previous.

The Markets
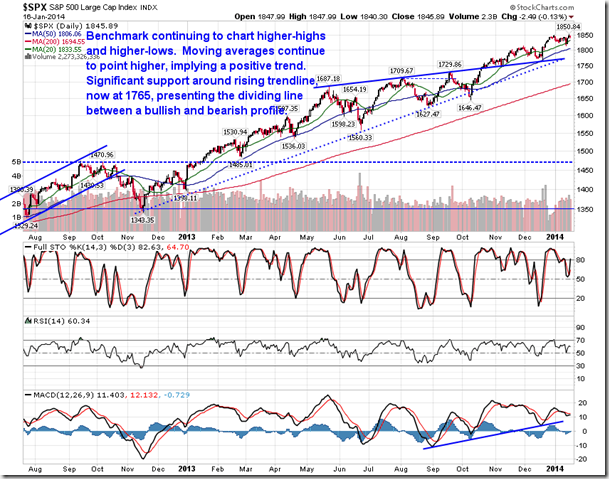
Stocks ended generally lower on Thursday as the financial sector dragged down the major benchmarks following lacklustre earnings results from Goldman Sachs and Citigroup. Shares of Citigroup and Goldman Sachs declined by 4.35% and 2.00%, respectively, falling back towards rising intermediate trendlines. Significant moving averages (20, 50, and 200-day) continue to point higher, implying positive short, intermediate, and long-term trends. Financial stocks, including Goldman Sachs and Citigroup, remain in a period of seasonal strength through to April.


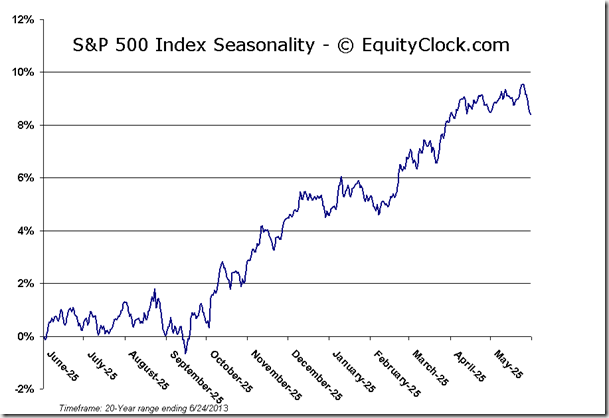

Thursday had all of the traits of a risk-off session: defensive sectors (Utilities, Health Care, and Consumer Staples) all posted gains on the day, gold posted marginally positive returns, and bonds ended higher on the day. One of the risks to the seasonal investing strategy over the next few months is that a period of risk-aversion materializes, whereby bonds, gold, and defensive equities outpace broad equity markets, forcing investor rotation from cyclical assets to alternate allocations. Seasonally, from late January through to the beginning of May, high-beta, cyclical equities typically dominate, posting gains on average and outperforming broad market benchmarks, such as the S&P 500. The iShares 20-Year Treasury Bond Fund (TLT) is giving the appearance of a significant double bottom pattern, suggesting a bounce from support may be underway, potentially drawing equity investors back to the fixed income asset class, perhaps for a brief period of time. Bond prices seasonally decline through to April as riskier assets attract investor demand, however, the path of least resistance for the bond market appears to be higher. A risk-off period doesn’t necessarily mean lower stock prices, but it could imply that some of the drivers of performance of broad market benchmarks may take a backseat role. Significant lag versus the market is already becoming apparent in the consumer discretionary sector, one of the best performing segments of the market for well over a year. The Consumer Discretionary sector remains in a period of seasonal strength that runs through to April.

And with sectors like Consumer Discretionary dragging on the broad market in the US, benchmarks outside of the US are showing signs of outperformance. The MSCI EAFE, which is essentially composed of international equities outside of North America, is starting to show signs of outperformance versus the S&P 500. Looking at a long term chart of the MSCI EAFE ETF (EFA) versus the S&P 500 ETF (SPY), the relative trend of EFA has been charting a significant base-building pattern since mid-2012, ending almost 5 years of relative declines that saw US stocks outpace the rest of the world. Opportunities outside of the US are starting to become apparent. The MSCI EAFE seasonally outperforms the S&P 500 from February through to April/May.

Seasonal charts of companies reporting earnings today:


Sentiment on Thursday, as gauged by the put-call ratio, ended bullish at 0.78.
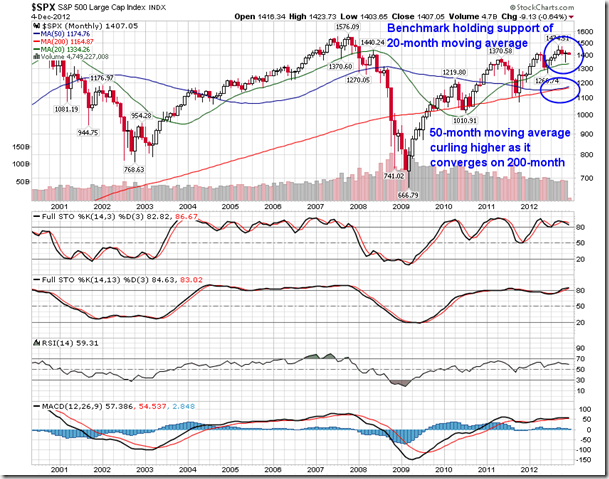
S&P 500 Index

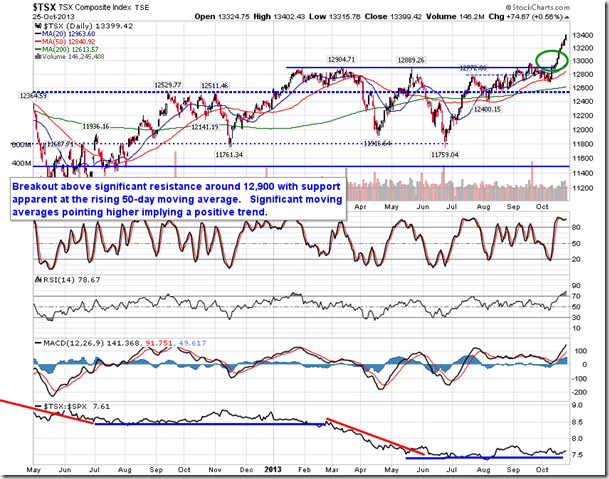
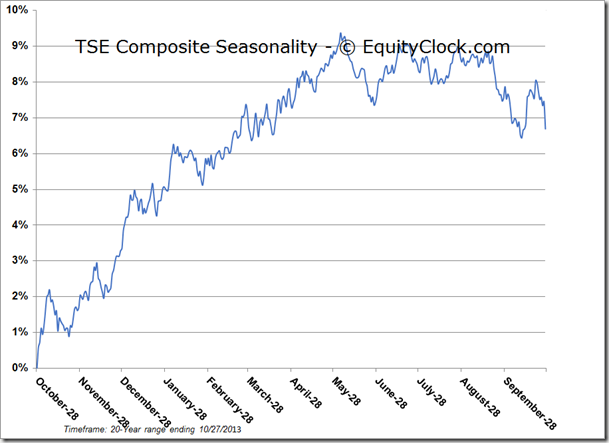
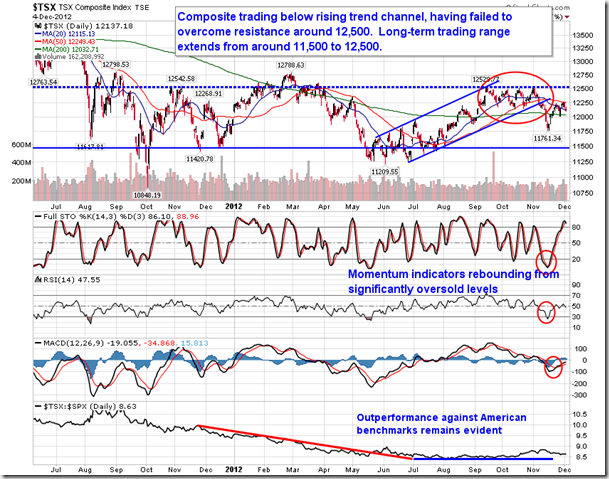
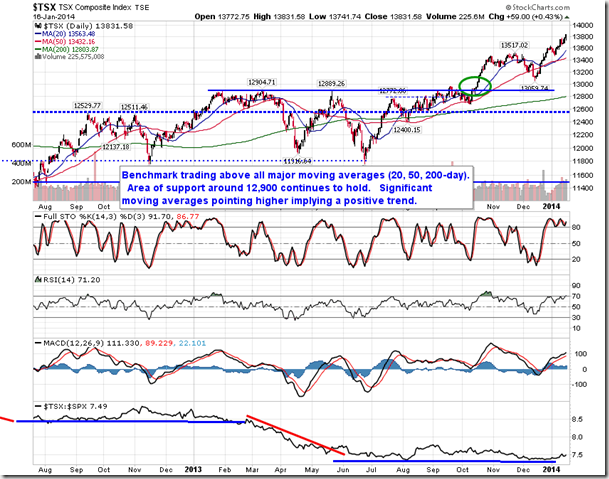
TSE Composite

Horizons Seasonal Rotation ETF (TSX:HAC)
- Closing Market Value: $14.32 (down 0.14%)
- Closing NAV/Unit: $14.33 (down 0.06%)
Click Here to learn more about the proprietary, seasonal rotation investment strategy developed by research analysts Don Vialoux, Brooke Thackray, and Jon Vialoux.

| Sponsored By… |
www.scotiabank.com/MutualFunds


-
I know Mike is a very solid investor and respect his opinions very much. So if he says pay attention to this or that - I will.
~ Dale G.
-
I've started managing my own investments so view Michael's site as a one-stop shop from which to get information and perspectives.
~ Dave E.
-
Michael offers easy reading, honest, common sense information that anyone can use in a practical manner.
~ der_al.
-
A sane voice in a scrambled investment world.
~ Ed R.
Inside Edge Pro Contributors

Greg Weldon

Josef Schachter

Tyler Bollhorn

Ryan Irvine

Paul Beattie

Martin Straith

Patrick Ceresna

Mark Leibovit

James Thorne

Victor Adair