
Currency

QUESTION: Mr. Armstrong; I understand you will be speaking in Vancouver tonight. Given the size of the audience, could you at least answer one question about the currency. You said the dollar would decline following gold’s lead. It is true that the currency has declined by more than 10%, but it did not make a new high in 2011 with gold. Can you explain the implication for that looking forward?
Thank you for always remembering Vancouver
RB
ANSWER: You have to keep in mind that cyclical forces function both INTRADAY as well as on a CLOSING BASIS. We have the same variation in gold with the intraday high forming in 2011 but 2012 was the highest yearly closing. In the case of the C$, it is true that the intraday low came 5 years from the high on a perfect bear market cycle. There was a brief reaction and a turn back down for the Greenback. However, 2011 was the reaction low but the LOWEST annual closing for the entire move was that of 2012, the same as we saw in gold. So the model was satisfied and the C$ fell 11%. The primary target resistance for the Greenback stands at the 118 level. From every perspective, the Greenback is rising in a sea of political confusion. No one can believe it and the short positions are staggering against the Greenback. Nevertheless, it has to rise to clean out the shorts that cannot grasp that CONFIDENCE establishes value – not supply.
…more from Martin: Everyone is Following You Everywhere

![]() This week’s newsletter is going to be a bit condensed and focusing solely on the “initial sell signal” and how to react to the current market conditions.
This week’s newsletter is going to be a bit condensed and focusing solely on the “initial sell signal” and how to react to the current market conditions.
Let’s jump right into the analysis.

On Friday the State Department released its environmental impact report on the Keystone XL pipeline.
In short, the report concluded that the Keystone XL pipeline, which brings Canadian crude oil to the U.S., will have a negligible effect on climate change.
This is huge news for America’s energy future.
As we’ve covered in the past, the State Dept’s report will play a huge role in Obama’s final approval/denial of the pipeline deal. Today we’ll take a look at the latest news, and show why one geographically challenged province is in for a windfall…
To make sure we’re on the same page, the Keystone XL Pipeline is a project slated to carry 800,000 barrels of crude oil from Hardisty, Alberta (Canada) to Steele City, Nebraska. From there, the oil will head south and find its way to U.S. refineries on the Gulf Coast.
“Because the northern stretch of Keystone XL, which would carry 830,000 barrels a day from Hardisty, Alberta, Canada, to Steele City, Neb., would cross a U.S. border” the LA Times reports, “it needs a so-called presidential permit from the State Department.”
Long story short, this approval has been waiting in the wings for years. And most recently, president Obama has said that his (long-awaited) decision to approve/deny the pipeline will hinge on whether or not the project will increase climate change.
That’s where Friday’s report comes in to play.
According to the Bloomberg, “In its final environmental review, the U.S. State Department found the Canada-U.S. oil pipeline would not greatly increase carbon emissions because the oil sands in Alberta will be developed anyway.”
In a nutshell, this paves the way for a presidential approval. (A good thing if you ask me!)
Whether you like Canadian oil sands and shale oil development or not, it’s much better that the oil comes through the U.S. than just bypassing us all together and heading to Asia. [What to see some common misconceptions about this pipeline project? Click here for 5 Myths About The Keystone XL]
With the approval of Keystone XL, the U.S. will be much, much, much more removed from our dependence on Middle East oil. Frankly, it’s a joke that our president wouldn’t be honored to approve this pipeline deal. But instead he tried – with tooth and nail – to stop it.
With Friday’s environmental report, an approval is looking much more inevitable. That means more abundant, secure crude will be flowing into the pipeline arteries of America.
But, of course, there’s much more to the story!
The Great Reversal
This is all part of a fantastic turnaround story here in the U.S.
For decades leading up to 2005, America’s energy future looked grim. Crude imports from the Middle East continued to edge higher, while at the same time domestic production continued to dwindle.
More imports and less production at home? It was a horrible recipe for our country’s trade balance. Not to mention, much of that oil was coming from unstable hot zones like the Middle East, Nigeria and Venezuela. Ugh.
But the tide started to change after 2005. Whispers in the U.S. oil and gas field started getting louder. And before anyone knew it oil and gas production was heading higher here in the states. America was sitting on a huge bounty of unconventional oil and gas. Energy that was once thought to be trapped in tight rock or “shale” formations, was now coming to the surface.
U.S. ingenuity, hard work, established infrastructure and two technological breakthroughs – hydraulic fracturing and horizontal drilling – changed the game here in the U.S. Oil and gas are coming to the surface at an stunning rate – and to be sure this unexpected U.S. production is changing the game.
Add it all up and we’re in the middle innings of a great reversal.
Instead of importing OPEC oil at our Houston refineries and shipping it north to the rest of the country. We’re starting to produce much more oil and gas inland – so much so that a glut of oil was being sent to a major storage center at Cushing, OK.
With a new direction for U.S. oil, it all comes back to pipelines.
A year ago, as we reported here, another pipeline (the Seaway Pipeline) made headlines when it completed a symbolic reversal. Instead of shipping oil north from Houston to Cushing – the pipeline reversed its flow and now sends 400,000 barrels per day SOUTH, from Cushing to Houston.
Another big part of America’s “new” energy direction was the southern leg of the Keystone Pipeline (noted below in the southern section of the dotted yellow line.)
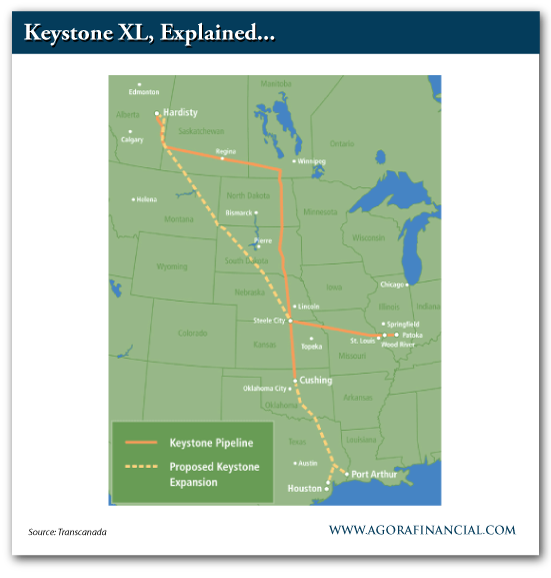
This month oil started flowing in this southern leg, which carries crude south from Cushing to Port Arthur, TX.
The southern leg of Keystone and the Seaway Pipeline are alleviating the glut of “stranded” oil from Cushing – they’re helping balance and utilize America’s new oil bounty.
And to be sure, it’s not just America that’s seeing booming oil and gas production (and the need for pipelines), which brings us back to Friday’s State Dept. report…
Big News For Our Neighbors To The North
Although the northern leg of the Keystone XL pipeline hasn’t been officially approved yet, the State Dept’s report all but paves the way for an Obama approval.
This is huge news for our neighbors to the north, especially Alberta, Canada where the Keystone pipeline begins.
Alberta, Canada is an energy rich province with one major drawback: it’s landlocked.
Without a diplomatic way to get its crude oil and natural gas to market the province was essentially out of luck. At one point several months ago the price for Alberta’s crude (since it was landlocked) had plummeted some $20-30/barrel lower than the price of most U.S. barrels.
That glut of energy spells opportunity.
With a pipeline approval Alberta’s budding oil sands and shale plays are bound to blossom. This is huge news for energy producers – oil sands and shale plays.
With the penultimate step for this pipeline approval in our rearview, now’s the time to look north for potential windfalls.
Friday’s report marks the next phase of North America’s energy boom – and it starts in Alberta.
Keep your boots muddy,
Matt Insley
P.S. We’re witnessing a sea-change in America’s energy future. With more shale oil coming from the U.S. and Canada the companies that can move the crude are set for massive growth. And remember, it’s not just pipelines you should look at. In fact, one overlooked sector has been chugging along over the past 18 months. For our favorite ways to play it, read more here.

There was no doubt about it in 2013. If the Fed were ever to cut back on its five years of massive QE bond-buying, bond prices would collapse.
It made sense. Of the $85 billion a month of QE, $40 billion was in mortgage-backed securities, and $45 billion in Treasury bonds.
If the Fed cut back its buying, say by $10 billion a month, who would pick up the slack? With such a sharp reduction in demand by a big buyer, bond prices would have to plunge.
Indeed, even when the Fed only hinted in May of last year that it might be getting close to tapering, bonds plummeted in anticipation of the impact it would have on their value.

The financial media reversed from cheerleading and stressing the virtues of bonds and the safe haven role they play in a diversified portfolio, to the notion that bonds are riskier than stocks. By mid-December, investor sentiment for U.S. Treasury bonds had plunged to its most bearish level in seven years.
However, after reaching a low at the end of the year, bonds rallied for four straight weeks in January. The rally began soon after the Fed announced in December that it would begin tapering in January. The bond rally continued this week even as the Fed confirmed it will also taper by $10 billion in February, and probably at that pace in following months.
So who is picking up the slack, not only closing the gap as the Fed buys fewer bonds, but producing enough extra buying to generate a rally?
Apparently it is investors made nervous by the stock market in January, now believing bonds are a safer haven after all.
The stock market’s unusual day-to-day volatility alone has been enough to make investors nervous. The Dow experienced a triple-digit close in one direction or the other on nine of the 20 trading days to Friday, on average of every other day. Five were to the downside, the largest of which was minus 318 points. Four were to the upside.
For the month the 30-year T’bond gained 3.9%, while the S&P 500 is down 3.3%.
Will the bond rally have legs beyond the short-term?
Bond action through the month indicates that will almost surely depend on the stock market.
It was almost spooky the way bonds moved opposite to stocks virtually on a day-to-day basis in January, rallying only on days when stocks were down, and pulling back on days when stocks were up on the day.
It is an indication that if the short-term pullback in stocks should morph into something worse, the traditional safe haven appeal of bonds will be a greater influence than concerns that the Fed is not buying bonds at its previous pace.
Given the rate investors were pulling money out of bonds last year, and pouring money into the stock market at a near record pace, there would be ample funds to support a sizable bond rally if those money flows were to reverse to any degree.
It is not an issue at this point, with the stock market probably only in a short-term correction.
However, the action of bonds in January will be important to be aware of and keep in mind if I am right in expecting the stock market to experience serious trouble in the second and third quarter.

The ISM Manufacturing PMI for January 2014 was expected to show a small slide from 57 to 56.2 points, well within growth territory. The headline figure as well as the employment component serve as a hint towards the Non-Farm Payrolls on Friday … full article


-
I know Mike is a very solid investor and respect his opinions very much. So if he says pay attention to this or that - I will.
~ Dale G.
-
I've started managing my own investments so view Michael's site as a one-stop shop from which to get information and perspectives.
~ Dave E.
-
Michael offers easy reading, honest, common sense information that anyone can use in a practical manner.
~ der_al.
-
A sane voice in a scrambled investment world.
~ Ed R.
Inside Edge Pro Contributors

Greg Weldon

Josef Schachter

Tyler Bollhorn

Ryan Irvine

Paul Beattie

Martin Straith

Patrick Ceresna

Mark Leibovit

James Thorne

Victor Adair