
The “era of getting rich quickly is over” for both stocks and bonds, so investors should lower their expectations about how much they can earn from these investments, said bond specialist Bill Gross on Tuesday. In a Bloomberg TV interview, the founder and chief investment officer of Pimco said he continues to buy Treasurys with short duration, particularly in the range of four to five years, a bet that he says will pay off if the Federal Reserve continues to keep its benchmark interest rates low for the foreseeable future. However, other big money managers have recently begun to bet that the Fed will be pressured to raise rates, putting them on the opposite side of that trade. With turmoil in emerging markets, Gross told Bloomberg TV that developing economies like Brazil and Turkey are starting to look more attractive, but that they are still a “wild card”. As markets continue to be choppy, Pimco clients say they want safety and preservation of principal in their bond investments, Gross said. He added that Mohamed El-Erian, the Pimco CEO who recently announced his departure, could take on a public policy role next.
Currency
The Australian dollar surged almost two percent on Tuesday after the country’s central bank dropped its bias towards easing interest rates and toned down its long-term call for the currency to weaken.
The dollar, yen and euro were all broadly stable, reflecting a drop in the volatility that has accompanied the flood of money out of emerging economies in search of traditional safe havens in the developed world.
The Aussie has fallen by almost a fifth in the past 12 months as a commodities boom expired, growth in China began to slow and the central bank campaigned for a weaker currency to help stir economic growth. – full article HERE

World shares slumped to a near four-month low after signs that the U.S. economy was stuttering compounded already frayed nerves following a sharp sell-off in emerging markets. Full Article


On Monday, crude oil lost 0.84% as weaker-than-expected U.S. and Chinese economic data fueled concerns over crude oil demand. Thanks to this news, light crude closed the day below $97 for the first time since Jan.27.
Data released over the weekend showed that China’s Manufacturing Purchasing Managers’ Index dropped to a six-month low, falling to 50.5 in January from 51.0 in December. This weaker-than-expected numbers raised questions about economic growth in the world’s second largest oil consumer (after the U.S.) and weighted on the price of light crude.
On top of that, yesterday’s data showed that U.S. manufacturing PMI dropped to 53.7 in January (from December’s 55.0). Additionally, the Institute for Supply Management said that its manufacturing purchasing managers index fell to 51.3 in January (a seven-month low), while analysts expected the index to moved down to 56.4. The above data added to recent worries about weakness in emerging markets and fueled concerns over crude oil demand sending crude oil below $97.
Having discussed the above, let’s move on to the technical changes in the crude oil market (charts courtesy of http://stockcharts.com).
In our last Oil Trading Alert, we wrote:
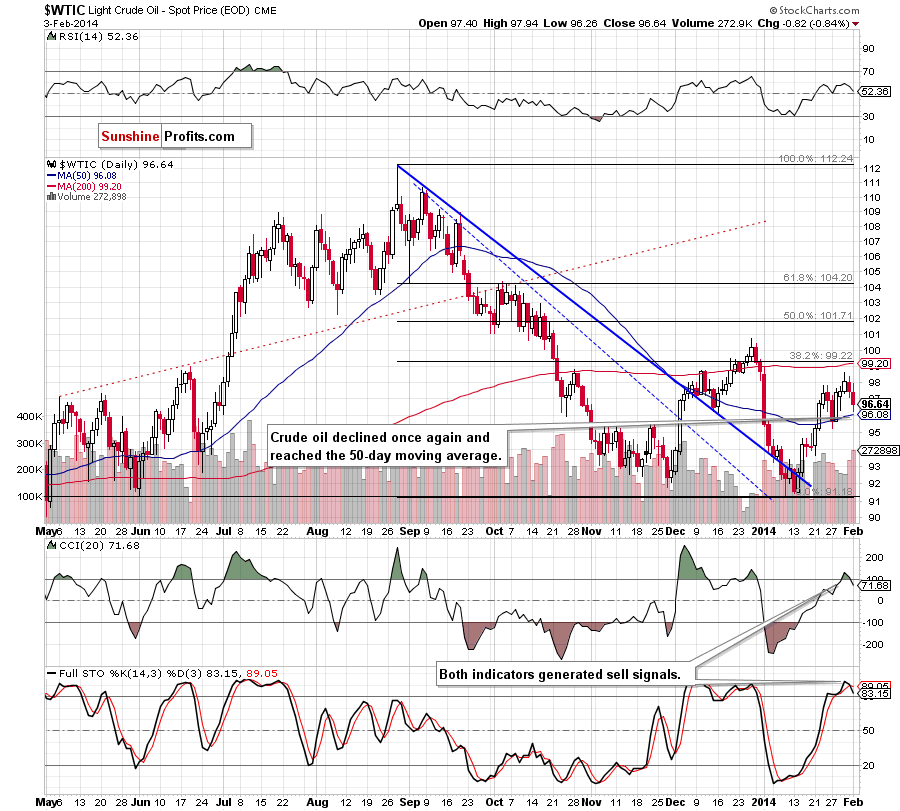
(…) crude oil extended its decline and (…) slipped below the previous high, which is not a positive signal – especially when we take into account the fact that Friday’s drop materialized on relatively large volume. On top of that, the CCI and Stochastic Oscillator are overbought and close to generating sell signals. Connecting the dots, it seems that a bigger pullback is just around the corner.
As you see on the above chart, crude oil extended losses and approached the 50-day moving once again. If this strong support encourages buyers to push the order button, we will likely see a corrective upswing in the coming days. However, if it is broken, we will see further deterioration and the next downside target will be the Jan.27 low at $95.21. At this point it’s worth noting that yesterday’s downswing materialized on large volume, which confirms the strength of the sellers. Additionally, the CCI and Stochastic Oscillator generated sell signal, which supports the latter scenario.
Having discussed the current situation in light crude, let’s take a look at WTI Crude Oil (the CFD).
Quoting our last Oil Trading Alert:
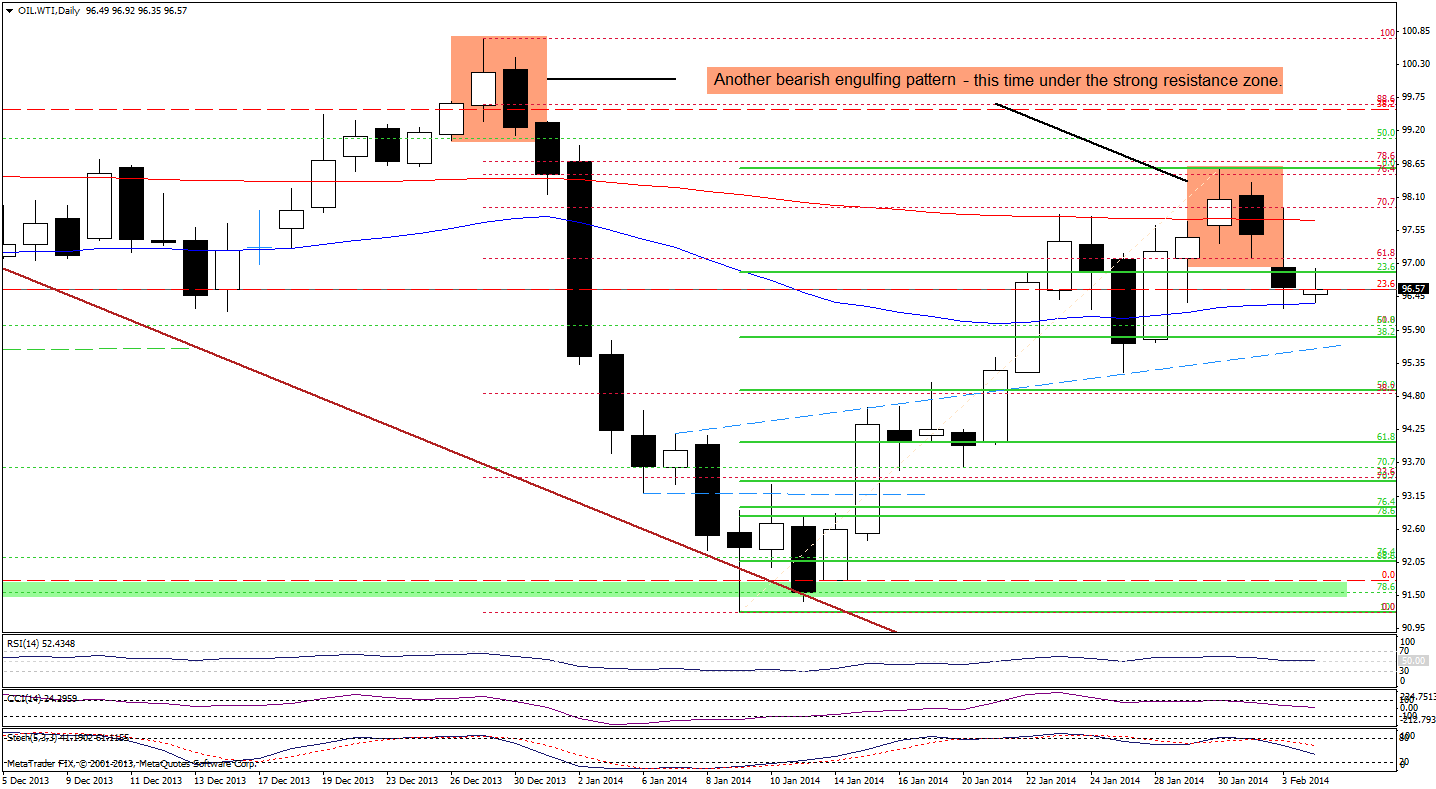
(…) the CFD formed a bearish engulfing pattern (…) such candlestick formation triggered a strong sell off at the end of December. From this perspective, it seems that if oil bulls do not manage to invalidate this bearish pattern, we may see similar price action in the coming days (…) the CCI and Stochastic Oscillator generated sell signals, which is another bearish sign (we saw similar situation in previous months and back then it had a negative impact on the price). Please note that the nearest support is the 50-day moving average (currently around $96.37), which corresponds to the Jan.29 low.
Looking at the above chart, we see that WTI Crude Oil extended its decline, dropped below the 23.6% Fibonacci retracement level and reached the 50-day moving average. As you see on the daily chart, this strong support encouraged oil bulls to act and triggered a small (at least at the moment when these words are written) corrective upswing earlier today. Despite this growth, the CFD still remains below the previously-broken 200-day moving average, which serves as resistance. Additionally, sell signals remain in play supporting the bearish case.
At this point, we should consider two scenarios. On one hand, as long as the CFD remains above the 50-day moving average, further declines are limited and we may see another attempt to move higher (even to the 200-day moving average). On the other hand, we should keep in mind that oil bears have more favorable factors on their side and if the 50-day moving average is broken, we will see a drop to (at least) the 38.2% Fibonacci retracement level based on the recent rally.
Summing up, the situation has deteriorated as the CCI and Stochastic Oscillator generated sell signals and crude oil declined (on large volume) to the 50-day moving average. As mentioned earlier, if this strong support encourages oil bulls to act, we will likely see a corrective upswing in the coming day (or days). However, if it is broken, we will see further deterioration and the next downside target will be the Jan.27 low at $95.21. Please note that the current situation in the CFD is similar to what we noticed in the case of light crude, and WTI Crude Oil doesn’t give us any particular clues about future’s moves in crude oil. Nevertheless, in both cases oil bears have more favorable factors on their side and it seems that further deterioration is just around the corner.
Very short-term outlook: mixed
Short-term outlook: bullish
MT outlook: bullish
LT outlook: mixed
Trading position (short-term): In our opinion, there were no significant changes in crude oil that justify opening short or long positions at the moment. We will keep you informed should anything change, or should we see a confirmation/invalidation of the above.
Thank you.
Nadia Simmons
Forex & Oil Trading Strategist
* * * * *
Disclaimer
All essays, research and information found above represent analyses and opinions of Nadia Simmons and Sunshine Profits’ associates only. As such, it may prove wrong and be a subject to change without notice. Opinions and analyses were based on data available to authors of respective essays at the time of writing. Although the information provided above is based on careful research and sources that are believed to be accurate, Nadia Simmons and his associates do not guarantee the accuracy or thoroughness of the data or information reported. The opinions published above are neither an offer nor a recommendation to purchase or sell any securities. Nadia Simmons is not a Registered Securities Advisor. By reading Nadia Simmons’s reports you fully agree that he will not be held responsible or liable for any decisions you make regarding any information provided in these reports. Investing, trading and speculation in any financial markets may involve high risk of loss. Nadia Simmons, Sunshine Profits’ employees and affiliates as well as members of their families may have a short or long position in any securities, including those mentioned in any of the reports or essays, and may make additional purchases and/or sales of those securities without notice.


-
I know Mike is a very solid investor and respect his opinions very much. So if he says pay attention to this or that - I will.
~ Dale G.
-
I've started managing my own investments so view Michael's site as a one-stop shop from which to get information and perspectives.
~ Dave E.
-
Michael offers easy reading, honest, common sense information that anyone can use in a practical manner.
~ der_al.
-
A sane voice in a scrambled investment world.
~ Ed R.
Inside Edge Pro Contributors

Greg Weldon

Josef Schachter

Tyler Bollhorn

Ryan Irvine

Paul Beattie

Martin Straith

Patrick Ceresna

Mark Leibovit

James Thorne

Victor Adair