
Stocks & Equities
At the end of 2013 Wall Street appeared to be convinced that the markets were enjoying the best of all possible worlds. In an interview with CNBC on Dec. 31 famed finance professor Jeremy Siegel stated that stocks would build on the great gains of 2013 with an additional 27% increase this year. So far 2014 hasn’t gone according to script. In contrast to the prevailing optimism I maintain a high degree of skepticism regarding the current rally in U.S. stocks. But opinions are cheap. To back up my gut feeling, here are six very diverse indicators that suggest U.S. stocks are overvalued. (This article is taken from the Winter 2014 EPC Global Investor Newsletter.)
1) U.S. STOCK PRICES VS. LONG-TERM EARNINGS
Currently market bulls will tell you that price to earnings ratios are well within their historic range. But they fail to mention that this statement is based on projected 2014 those earnings that won’t be known exactly until 2015. More sophisticated investors tend to rely on the Shiller S&P 500 P/E Ratio which compares U.S. stock prices to average 10year inflation-adjusted earnings. This takes a lot of the guess work out of the equation. Today the Shiller S&P 500 PE Ratio is at 26.4. But going back 100+ years, the historic mean of the index is 16.5. This means the current ratio is 61% higher than its long term average.

Past performance does not guarantee future results.
There are only four occasions in the past 100+ years in which the Shiller S&P 500 PE Ratio was higher than it is now: 1929, 1999, 2002, and 2007. In 3 of these 4 instances, U.S. stock prices saw major declines over the ensuing two years.
But even if we were to agree with the bullish pundits who argue that today’s low interest rates have created a new plateau of valuations, (and therefore can’t be compared fairly to generations-old metrics) today’s short term P/E ratio is still high. Based on the most recent year’s trailing 12-month earnings, the S&P 500 PE Ratio is at 20.14.
At first glance, this does not appear to be extremely high. However, there is an important caveat. Currently, corporate profits as a percentage of GDP are the highest they have ever been since the World War II era.

Currently profits are coming in at 11% of GDP, a level that is around 60% higher than the average of around 6% that has been seen since 1952. (It is even significantly higher than the average of the past 10 years – a period during which low interest rates pushed up financial ratios past their traditional levels). To return to a more normalized ratio either GDP would have to expand rapidly or profits would have to diminish. Given our view of the current economic prospects, we believe the latter outcome is more likely.
2) U.S. STOCK PRICES VS. CORPORATE ASSETS: TOBIN’S Q RATIO
Maybe earnings just aren’t as important as they used to be. Given all the cash that is on company balance sheets, maybe assets are more detreminative. Tobin’s Q Ratio is a popular measure that compares a company’s market value (which is a function of share price) to the amount it would cost to replace the company’s assets.
So if a company owned a factory, and the market capitalization of the company was $1 million, but the factory would cost $2 million to build today, Tobin’s Q Ratio would be 0.5. The lower the ratio, the less the investor is theoretically paying for the company’s assets.

At greater than 1, Tobin’s Q Ratio implies that stocks are overvalued. From the chart above, you can see that the Tobin’s Q Ratio for the U.S corporate sector was at 1.05 at the end of last year, which is approaching the level associated with past market declines. The historic mean over more than 100 years for the ratio is just .68 and there are only a few occasions over that time when the ratio passed 1.0. The late 1990’s was the only instance in which the ratio passed 1.1. At that time it shot up to 1.63, before eventually plunging. But should we really hold up the dotcom mania as a benchmark for sound valuations?
3) U.S. STOCK PRICES VS. GDP
The chart below compares the total market capitalization of all publicly traded U.S. companies with U.S. GDP.

Since 1950 the median figure of this ratio is .65, meaning that all public companies together were worth 65% of that year’s GDP. Currently, the ratio is nearly double that at 1.25. The only times U.S. stocks were valued higher relative to GDP were in 1999 and 2000.You know how that ended.
4) U.S. STOCK PRICES VS. MARGIN DEBT
Just as it’s possible to buy houses with debt (mortgages), people can buy stocks with debt (it’s called margin). As stocks go higher, an increased number of investors may become tempted to use credit to buy appreciating assets. This is particularly true when low interest rates push down the cost of borrowing. Not surprisingly, the chart below from the New York Times shows that stock margin debt as a percentage of GDP is approaching the higher end of its historic range:

New York Times (5/31/2014)
As we have seen in so many of the other metrics, the chart shows large spikes in 1999 and 2007. And while it’s certainly possible that margin debt could go higher from current levels of 2.27% (it reached 2.85% in 1999), it is also possible that margin debt will decrease sharply soon thereafter. When margin equity falls below a certain percentage, many investors are forced to sell stock to repay the loans, which brings downward pressure on share prices. We have seen this movie before, and it’s not a comedy.
5) U.S. STOCK PRICES VS. DIVIDEND YIELD
Of all the ways to measure stock valuations, dividend yield may be the most tangible. Dividends are what investors are paid directly to own stocks. By that metric, U.S. stocks are looking historically expensive.

Multpl.com (1/2/2014)
As you can see in the chart above, the dividend yield on the S&P 500 at the end of 2013 was the lowest it’s ever been (with the exception of the period around 1999 – there’s that year again).
6) U.S. STOCK PRICES VS. INTEREST RATES
Low interest rates have been the Holy Grail of stock market bulls. By definition, the present value of stocks is higher when interest rates are anticipated to be lower in the future (meaning that investors are willing to pay more for well-established income streams today in anticipation of lower rates).

As seen in the chart above, yields on the 10-year Treasury bond were cut in half between 1981 and 1989They were halved again by 2002, and again by 2011. From there they decline another 25% before bottoming in May 2013, at 1.5%. These historic declines helped fuel an historic rally in stocks.
Low interest rates also tend to keep corporate costs down and profits up (low rates are one of the main factors in the current profit boom), and make stocks more attractive relative to bonds. The Fed’s current open-ended commitment to zero interest rates has inspired many investors to adopt a “Don’t Fight the Fed” rallying cry. (A new variant on this may be “As long as it’s Yellen, don’t think of sellin.”)
But here’s the problem…although interest rates remain in historically low territory they have been trending upward slowly for the past year and a half. It’s unreasonable to expect this trend to reverse and interest rates to fall once again into record low territory. If the Fed goes through with its tapering campaign and diminishes the amount of Treasury bonds it buys on a monthly basis (purchases that have helped keep rates low), they are much more likely to rise.
In the first weeks of 2014, yields on 10-year Treasuries flirted with three percent for the first time since July 2011, a time in which the Dow Jones Industrial Average was about 23% below current levels.
IN CONCLUSION
While our analysis at Euro Pacific Capital is in no way exhaustive, I believe that the above metrics make a fairly solid case that U.S. stocks are likely overvalued. I believe that the current optimism is based solely on confidence in monetary policy and the belief that the U.S. has embarked on a period of sustained expansion. However, as Peter Schiff has explained many times, the economy now shows many of the over-leveraged and delusional characteristics that existed before the recessions of 2000 and 2008. Perhaps that helps to explain why today’s markets so closely resemble those periods.
Neeraj Chaudhary is an Investment Consultant in the Los Angeles branch of Euro Pacific Capital. Opinions expressed are those of the writer, and may or may not reflect those held by Euro Pacific Capital, or its CEO, Peter Schiff.

 Random thoughts about the year ahead
1) The monetary backdrop continues to be very different in the US today than it was in earlier post-bubble periods. This is slowing the corrective process and introducing new price distortions that will have to be ‘resolved’ via another devastating economic bust. When will they ever learn?
2) Economic declines will become progressively more serious and economic recoveries will become progressively weaker until there is wide recognition that the central bank is a big part of the problem as opposed to part of the solution.
3) At this time last year, we wrote: “It has become clear that the Fed’s policy of throwing new money at the economy in a horribly misguided effort to generate real growth is not only going to continue in 2013, but also going to be applied more aggressively than was the case in 2012. This money-pumping could prevent widespread recognition of recessionary economic conditions for several more months, but only at a substantial long-term cost. For an economy to function efficiently, price signals must be genuine; that is, price signals must accurately reflect sustainable consumption and production trends.“
The Fed is now beginning to slow the pace of its money-pumping, but the damage has been done. The seeds of the next economic bust have been sown.
4) The economic data will probably be OK during the first few months of 2014, but if commercial-bank credit growth continues at its present slow pace then by the third quarter of this year there will probably be enough stock market weakness and enough signs of economic deterioration to prompt the Fed to step away from its “tapering” plan.
5) At the beginning of 2013, we wrote: “China has huge economic problems, but these problems will come to the fore gradually over the space of a few years and won’t likely be the cause of big moves in global financial markets during 2013.” The same statement applies to this year.
6) At the beginning of 2013 we thought that the euro-zone’s government debt disaster would return to “Page 1” during the second half of the year. It didn’t. Another euro-zone banking/debt crisis is inevitable, but there are currently no signs that it is imminent. For example, the yield on 10-year Spanish government bonds is near a 5-year low and the EURO STOXX Banks Index recently made a 2-year high. We will monitor European bonds and bank shares in an effort to determine the timing of the inevitable crisis. All we can say right now is that it probably won’t happen during the first half of 2014.
7) Last year we thought that unexpected weakness in the US economy was an intermediate-term threat worthy of attention, but not one of the top three risks. Unexpected weakness in the US economy is now one of the top three risks, although it is a risk that probably won’t materialise until the second half of the year.
8) As 2013 got underway we considered greater instability in the Middle East to be one of the biggest intermediate-term risks facing the financial markets. We also thought that if this risk was going to materialise it was more likely to do so during the second half than the first half of the year. Our reasoning was that the US government (by far the greatest threat to world peace) would be more inclined towards aggressive military intervention in the Middle East after it became clear that the US economy had sunk into recession, something that was unlikely to happen prior to the second half of 2013. To further explain, governments tend to view external threats as useful distractions during periods of economic weakness. Additionally, in a world dominated by “Keynesian” policy-makers and political advisors, large-scale military action can be perceived as a convenient excuse for more government spending and more monetary inflation.
The threat that the pot of territorial disputes, religious hatreds, political grievances and economic problems known as the Middle East will boil over is ever-present. However, with a deal now in the works regarding Iran’s nuclear program, with the start of the next US recession still lying more than 6 months into the future and with US mid-term elections scheduled for this November, the next Middle East ‘boil over’ of global importance is probably not going to happen in 2014.
9) Last year we wrote: “There’s a new big intermediate-term risk facing the financial world as 2013 gets underway: the risk that the government bond bubble will burst. The bursting of the government bond bubble is a more pressing concern today than it was, say, 6 months ago due to the immense political pressure being put on the Bank of Japan (BOJ) to reduce the purchasing power of the Yen.“
The government bond bubble probably did burst last year, but the other financial markets took the first phase of the new secular bond bear in stride. Furthermore, despite the actions taken by the BOJ to bring about higher “inflation” in Japan, the JGB market recovered from a sharp April-May sell-off to end the year with a gain. That is, the JGB yield was lower at the end of the year than at the start of the year.
Even though a secular bond bear has probably begun, for the reasons outlined in our 20th January commentary we don’t perceive much intermediate-term downside risk for US Treasury bonds. In fact, we suspect that the T-Bond market will end 2014 with a gain.
There is a lot more risk in Japanese Government Bonds. This is mostly because they have a much higher valuation (lower yield), but it is also because the JGB market is much further along in its long-term topping process.
10) Due to the downward trend in the US monetary inflation rate and the valuation-related downside potential in the US stock market, a US deflation scare is a realistic possibility for the second half of the year.
11) For speculators in commodities and commodity-related equities it will be much easier to make money on the ‘long’ side during 2014 than it was during 2012 and 2013. This is especially so for the year’s first half (the second half could contain a deflation scare) and for speculators in gold and gold-related equities.
The above is excerpted from a commentary originally posted at www.speculative-investor.com. To view their services go HERE

U.S. Federal Reserve Chairman Janet Yellen will speak on monetary policy and the outlook for the U.S. economy tomorrow for the first time after being sworn in as the central bank’s head on Feb. 3. The Fed chairman will testify before the House Financial Services Committee in a semi-annual report. The Fed has already decided to slow the pace of its asset-purchase program twice, reducing its monthly buying of bonds to $65 billion from $85 billion in 2013.
….more on economic data HERE

Trading position (short-term): In our opinion no positions are justified from the risk/reward perspective.
(Oil Trading Alert originally published on Feb 10, 2014, 10:26 AM)
On Friday, crude oil gained 2.27% as the U.S. dollar weakened against major currencies after a monthly U.S. employment report came in weaker than expected. Thanks to these circumstances, light crude extended gains and rose above $100 per barrel for the first time in more than a month.
The U.S. Labor Department showed that the U.S. economy added 113,000 jobs in January (well below expectations for a 185,000 increase). It’s worth noting that it was the weakest two-month stretch of job creation in three years as inclement weather contributed to a slowdown in hiring. Friday’s report also showed that 142,000 jobs were added in the U.S. private sector last month, below the 189,000 that economists had expected.
These lower-than-expected numbers have helped push the price of light crude higher by weakening the dollar, making crude oil cheaper for buyers using foreign currencies. Thanks to the recent increases, light crude climbed 2.78% in the previous week and it was the fourth consecutive weekly gain.
Having discussed the above, let’s move on to the technical changes in crude oil (charts courtesy of http://stockcharts.com).
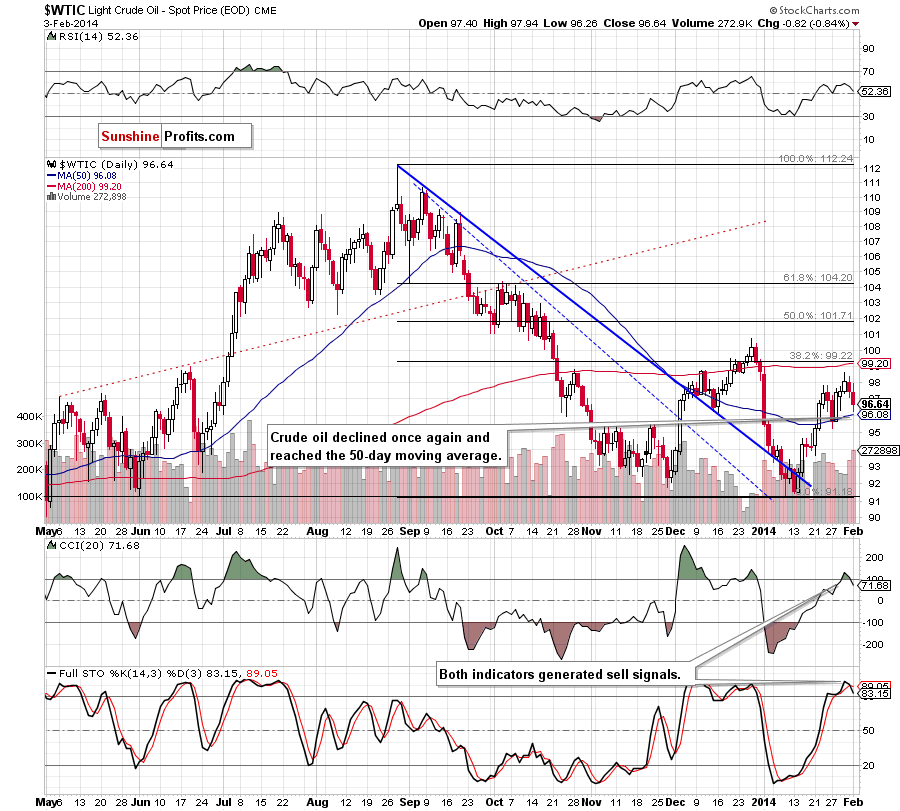
Looking at the above chart, we see that the situation has improved significantly as crude oil broke above the strong resistance zone (created by the 200-day moving average, the 38.2% Fibonacci retracement level based on the entire Aug.-Jan. decline and the upper border of the rising trend channel), which is a strong bullish signal. According to theory, if the breakout is not invalidated, we may see further improvement and the upside target would be the 50% Fibonacci retracement. Nevertheless, we should keep in mind that although crude oil climbed above $100, it still remains below the December high, which serves as the nearest resistance at the moment. Additionally, when we take a closer look at the indicators, we see that there are negative divergences between the CCI, Stochastic Oscillator and light crude. On top of that, both indicators are overbought, which suggests caution.
Having discussed the current situation in light crude, let’s take a look at WTI Crude Oil (the CFD).
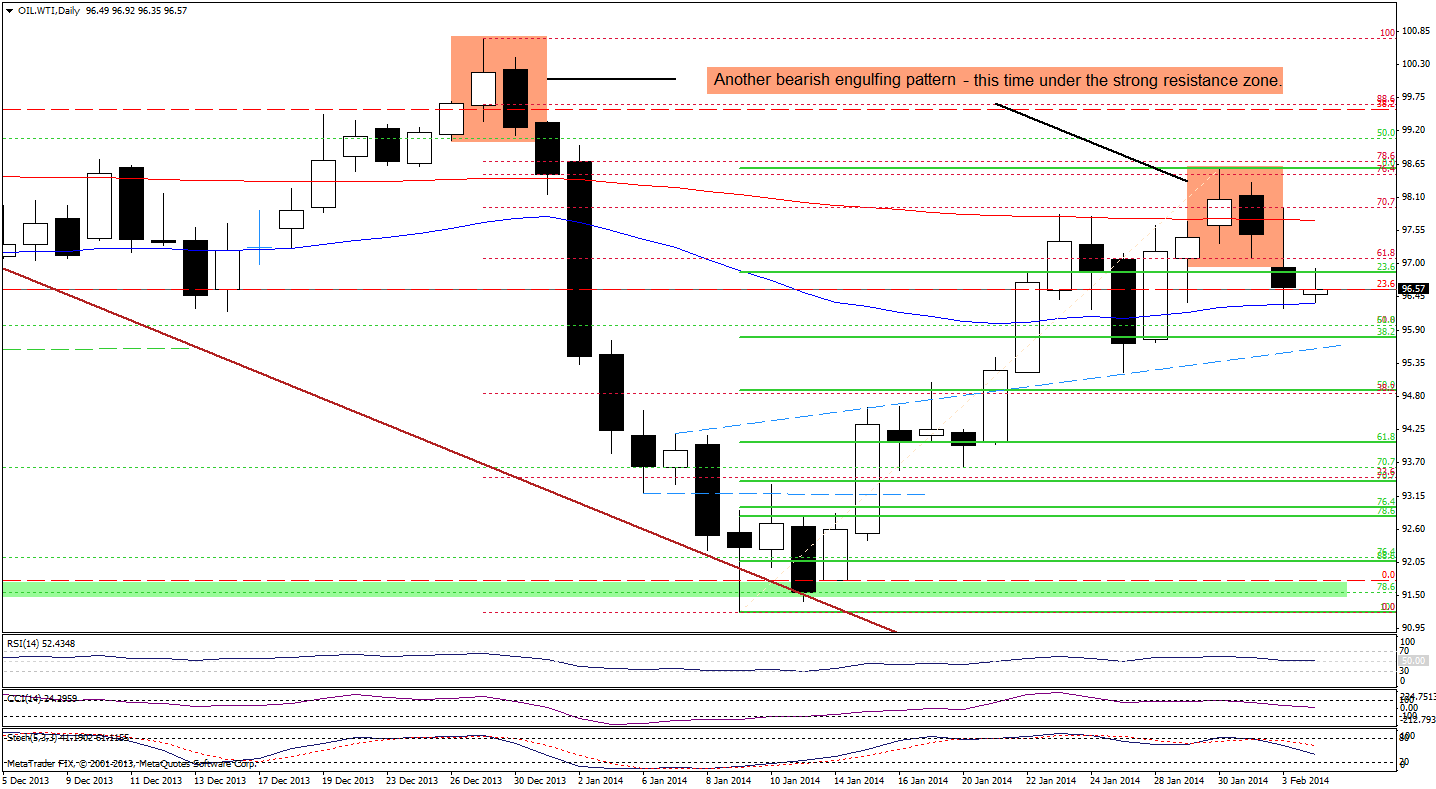
Looking at the above chart, we see that the CFD extended gains and hit a fresh monthly high of $100.18. With this upswing, WTI Crude Oil broke not only above the previous high, but also above the strong resistance zone created by 38.2% Fibonacci retracement level based on the entire Aug.-Jan. decline, the upper blue line (which is also the upper border of the rising trend channel) and the 173.2% Fibonacci projection.
Similarly to what we wrote in the case of crude oil, this is a strong bullish signal. However, despite this growth, the CFD still remains below the December high (which is reinforced by a bearish engulfing candlestick pattern). As you see on the daily chart, earlier today, this resistance level encouraged oil bears to act and we saw first attempt to invalidate the breakout above the upper border of the rising trend channel. If the buyers fail and the CFD closes the day below this support line, it will be a strong bearish signal that will likely trigger further deterioration. At this point it’s worth noting that the CCI and Stochastic Oscillator are overbought, which may encourages sellers to act. Nevertheless, as long as WTI Crude Oil remains above the upper border of the rising trend channel, another attempt to move higher can’t be ruled out.
Summing up, the situation has improved significantly as crude oil broke above the strong resistance zone and climbed above $100 on relative high volume. With this upswing, light crude (and also the CFD) approached the December high. If this resistance level is broken and the breakout above the upper border of the rising trend channel is not invalidated, we may see further improvement and the upside target would be the 50% Fibonacci retracement. On the other hand, taking into account negative divergences between indicators and light crude, an attempt to return to the trend channel can’t be ruled out.
Very short-term outlook: bullish
Short-term outlook: bullish
MT outlook: bullish
LT outlook: mixed
Trading position (short-term): In our opinion, there were no changes in crude oil that justify opening short or long positions at the moment. We will keep you informed should anything change, or should we see a confirmation/invalidation of the above.
Thank you.
Nadia Simmons
Forex & Oil Trading Strategist
* * * * *
Disclaimer
All essays, research and information found above represent analyses and opinions of Nadia Simmons and Sunshine Profits’ associates only. As such, it may prove wrong and be a subject to change without notice. Opinions and analyses were based on data available to authors of respective essays at the time of writing. Although the information provided above is based on careful research and sources that are believed to be accurate, Nadia Simmons and his associates do not guarantee the accuracy or thoroughness of the data or information reported. The opinions published above are neither an offer nor a recommendation to purchase or sell any securities. Nadia Simmons is not a Registered Securities Advisor. By reading Nadia Simmons’s reports you fully agree that he will not be held responsible or liable for any decisions you make regarding any information provided in these reports. Investing, trading and speculation in any financial markets may involve high risk of loss. Nadia Simmons, Sunshine Profits’ employees and affiliates as well as members of their families may have a short or long position in any securities, including those mentioned in any of the reports or essays, and may make additional purchases and/or sales of those securities without notice.


-
I know Mike is a very solid investor and respect his opinions very much. So if he says pay attention to this or that - I will.
~ Dale G.
-
I've started managing my own investments so view Michael's site as a one-stop shop from which to get information and perspectives.
~ Dave E.
-
Michael offers easy reading, honest, common sense information that anyone can use in a practical manner.
~ der_al.
-
A sane voice in a scrambled investment world.
~ Ed R.
Inside Edge Pro Contributors

Greg Weldon

Josef Schachter

Tyler Bollhorn

Ryan Irvine

Paul Beattie

Martin Straith

Patrick Ceresna

Mark Leibovit

James Thorne

Victor Adair