
Stocks & Equities
Lelde Smits: Hello, I’m Lelde Smits for Australia’s Finance News Network and joining me today is Marc Faber, author of ‘The Gloom, Boom & Doom Report’. Marc, thank you for joining us from Thailand.
 Marc Faber: It’s my pleasure.
 Marc Faber is an international investor known for his uncanny predictions of the stock market and futures markets around the world.Dr. Doom also trades currencies and commodity futures like Gold and Oil.

 Warren Buffett (Trades, Portfolio) has famously said the following statement:
“If I was running $1 million today, or $10 million for that matter, I’d be fully invested. Anyone who says that size does not hurt investment performance is selling. The highest rates of return I’ve ever achieved were in the 1950s. I killed the Dow. You ought to see the numbers. But I was investing peanuts then. It’s a huge structural advantage not to have a lot of money. I think I could make you 50% a year on $1 million. No, I know I could. I guarantee that.”
I am sure every investor wants to find out how would he make 50% a year guaranteed. A logical starting point is his rates of return as well as portfolio details in the 1950s. Unfortunately there is extremely limited information out there with regards to his return and portfolio composition. Therefore, I was delighted to find the following information from Andrew Kilpatrick’s book “Of Permanent Value.” The following information was contained in a letter Warrren Buffett wrote to Andrew Kilpatrick in 2001. This table shows the details of his investment from 12/31/1950 to 12/31/1951. Let’s take a look:
Ed Note: Be sure to read Warren’s observations toward the end of this article
12/31/50
Buffett & Co. $591.20
Selected Industries (1200@3 1/8) 3,750.00
U.S & International Securities (700 @ 4 1/8) 2,887.50
Parkersburg Rig & Reel ( 200 @13) 2,600.00
Total $9,828.70
Less Loss on Interest in Marshall Wells (12 ½ @198) 25.00
Net Assets $9,803.70
12/31/51
Buffett-Falk & Co. $292.63
Dividends receivable 140.00
Government Employees Insurance (350 @ 37 ½) 13,125.00
Timely Clothes (200@13) 2,600
Baldwin Co. (100@22) 2,200.00
Greif Brothers Cooperage “A” (200@18 ¼) 3,650.00
Des Moines Railway 5’s -1955 (2000@33) 330.00
Thor Corp. (200 @12 ¾) 2,550.00
Total: $24,876.63
Less Bank Loans : $5,000.00
Loss on interest in Cleveland Worsted Mills (25@95) 150.00
Total Deductions : $5,150.00
Net Assets: 19,737.63
Net Increase in Investment Account $9,933.93
Less: Capital Additions 2,500.00
Net Gain from Investments: 7,433.93
Percentage Gain on 12/31/50 Net Assets : 75.8%
Dow-Jones Industrials 12/31/51: 269.23
Dow-Jones Dividends – 1951: 16.34
Total:285.57
Less: Dow-Jones Industrials 12/31/50: 235.41
Gain in Dow-Jones Industrials:50.16
Percentage Gain on 12/31/50 Dow-Jones Industrials 21.3%
Wow! Buffett did kill the Dow in 1951 with a return of a mind-blowing 75.8% versus the Dow’s 21.3%.
Here are a few observations:
- Buffett put more than half of his net assets in GEICO after he found out that Ben Graham was heavily invested in it and after he spent a few hours with Lorimer Davidson.
- His next four largest positions such as Thor Corp and Timely Clothes made up 9% to 15% of his portfolio.
- Together, his five largest holdings accounted for a whopping 97% of his portoflio.
- Buffett’s 75.8% return is leveraged as he borrowed $5,000 in 1951, probably to finance the Geico purchase.
- None of the year-end 1950 holdings were included in the year-end 1951 holdings, implying that Buffett flipped them within a year.
- This doesn’t include his short position in Kaiser-Frazer, which you can find more detailes in Alice Shroeder’s “Snowball.”
I think the following lessons offer some foods for thought:
- Bet big when the odds are extremely in your favor, such as Buffett’s investment in GEICO. But only if you have done enough scuttlebutt work on your own and the investment is within your circle of competence. A related topic, which will require another full article, is the concept of expected return.
- This may sound controversial, but It is okay to use some leverage when the odds are good. Both Buffett and Munger used leverage in their early investment life. Especially when you are still young and have nothing to lose. But his lesson only applies to intelligent investing, not to speculation and gambling alike.
- You don’t have to hold a stock for five to 10 years just to prove you are long-term oriented. Mohnish Pabrai (Trades, Portfolio) once said something like for most of us, the stocks that can make us 50% a year will likely not take that long to get us the results. Of course if you prefer quality and are satisfied with a 10% to 15% annual compounded return, a longer time horizon may work better.


The key resistance in gold on a nearest futures basis stands at the 1400 zone on a technical basis the weekly level. On our model, A Daily Bullish Reversal stands at 1344 nearby while on the weekly level the major barrier overhead remains at the 1420-1425 level. Of course, the gold promoters always proclaim a bull market and quickly forget every decline. Often they seem just like politicians always preaching their own self-interests with little regard for the financial survival of their victims. They act as if you will miss the ENTIREbull market unless you buy immediately today.
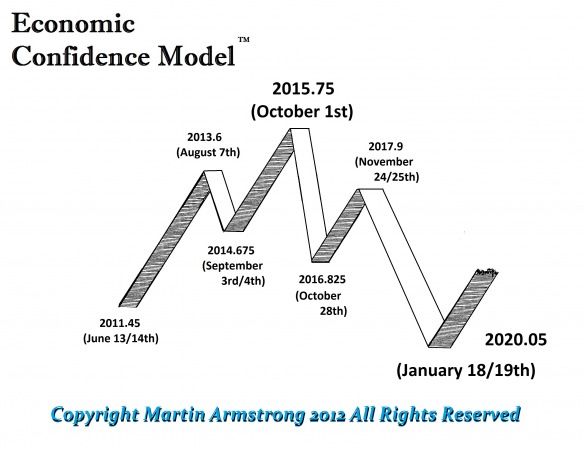
Timing wise, it still looks like the major SUSTAINABLE rally comes AFTER the turn in the ECM 2015.75. From a broader perspective, we really want to see a low with the top of the ECM into early 2016 for that would set the stage for a serious rally thereafter that may at last really breakout above the 1980 high in real terms – not simply nominal terms.
However, the gold promoters never look at the long-term and how the market plays a role within the entire global perspective. The crisis in Ukraine and the LIKELIHOOD that we will see Russian intervention can cause a spike rally in gold. We are not going to be out of the woods on this crisis at least until the after the week of April 7th. That seems to be the real target in time.
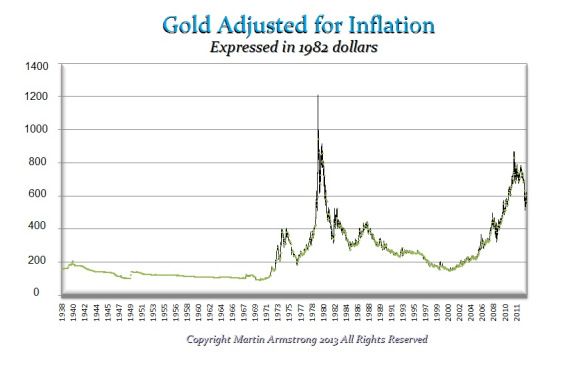
Gold will not look impressive unless we see it exceed the 1425 level on a Weekly Closing Basis. Remaining beneath that level into April only warns that we can still see new lows into next year before the whole thing goes nuts starting in 2016. Keep in mind that a crisis in Ukraine with a Russian invasion will send the dollar higher. Russia is already saying the overthrow of the Viktor Yanukovych was illegal despite the fact the people did so in great mass without ANY weapons from the West. The future rally we see for gold hasNOTHING to do with hyperinflation, the Fed or other nonsense. This is now in the hands of geopolitical uncertainty and that is where gold comes in – it is as I have always stated – a hedge against governments not inflation as clearly demonstrated with the above chart.
also:
US Military Spending Bottoming with the Cycle of War low – Amazing

“Peak Oil” has been the theory that the US, in particular and the World, in general would run out of oil reserves. Such theories depend upon supply/demand analysis that for centuries market forces have demonstrated as inadequate. The dynamics of financial history move faster than fundamental research can deal with.
Peak Oil is not the only example. The “Coal Question” was a serious concern in the 1860s. Growing population and expanding industry made a shortage of coal inevitable. Stanley Jevons was England’s leading economist and had a personal revelation that coal reserves would soon run out. Civilization, as appreciated then, would collapse.
What is fascinating is that an era of soaring prices prompted fanciful theories about permanent shortages and charismatic leaders ran with the alarm. Peak Oil and Peak Coal are essentially the same story and the intensity of the latter faded as the financial bubble of 1873 crashed. This marked the beginning of a Great Depression. During the late 1800s crude oil became a commercial source of energy that “Coalists” did not see.
This time around, crude oil prices soared with “Peak Oil” convictions and collapsed as a great financial bubble failed in 2008. Traditional reserves, which were diminishing have been more than replaced by technical innovations that made shale deposits economical. “Peakests” became deniers.
Jevons was a competent researcher and had calculated all of the known coal reserves in England and Europe. Right down to a mining depth of 4,000 feet. His book was published in 1865 and was called The Coal Question: An Inquiry Concerning the Progress of the Nation, and the Probable Exhaustion of Our Coal-Mines.
One of the salient observations was “Coal in truth stands not beside but entirely above all other commodities. It is the material energy of the country – the universal aid – the factor in everything we do. With coal almost any feat is possible or easy; without it we are thrown back into the laborious poverty of early times.”.
The book also included “This is a question of almost religious importance which needs the separate study of every intelligent person.”.
Coal reserves have yet to run out, and the instruction from its commercial history may have tempered the conclusions of supply/demand analysis in petroleum reserves. But did not.
Early Comments:
In 1914, the Bureau of Mines reported that U.S. oil reserves would be exhausted by 1924.
“Production of oil cannot long maintain its present pace.”
– 1922 Federal Commission
In 1939, the Interior Department said that the World had only 13 years of oil reserves.
“Oil production will peak by 1985.”
– April 18, 1977, President Carter
Comments at the Peak:
“And to the Peakests I say. You can declare victory. You are no longer the beleaguered small minority of voices crying in the wilderness. You must learn how to take “yes” and be gracious in victory.”
– President, International Association for the Study of Peak Oil, 2007
“OPEC has already done what OPEC can do and oil prices will not come down.”
– OPEC President, Chakib Khelil, June 24, 2008
Recent Comments:
“The Last Post”
– The Oil Drum, September 22, 2013
A “Peak Oil” website was shut down.
At times of great excitement in any commodity, either at bottoms or peaks, it is price action that clears the market. Although widely popular, supply/demand research lags the important turns in price for all commodities.
Over the last couple of decades, technical analysis has improved a lot and our work as the price surged to 147 in 2008 is worth reviewing.
Our ChartWorks developed a proprietary model in 1999 designed to recognize the characteristics of significant tops and bottoms. Tops are called Upside Exhaustions and bottoms Downside Capitulations. Often such dynamics will occur within a seasonal move.
That was the case in with the rally in natural gas that would likely top around June 2008. The high for natural gas was 13.69 at the end of that June. As part of the energy play, the action in coal stocks also accomplished a Weekly Upside Exhaustion.
An important over-riding feature was that our work on credit markets had concluded in June 2007 that “The greatest train wreck in the history of credit” had begun.
A couple of paragraphs from our “Pivots” through the violence of “Peak Oil” follow.
“On crude oil, last Friday’s Pivot noted that the biggest Upside Exhaustion signal since Iraq’s invasion of Kuwait in 1990 had been accomplished. That was on the Weekly and it was also noted that the Monthly was working on the biggest signal since the sensational high of 1980.”
– Pivot July 10, 2008
“For crude, this is a cyclical high and if the Monthly Exhaustion is accomplished it would be a secular peak. In so many words – Peak Oil.”
– Pivot, July 24, 2008
Where Are We Now?
Although the business cycle has been the weakest since the 1930s, it has run for almost 5 years since the crash ended in 2009. The bull market for stocks and lower-grade bonds has become measurably speculative – at fully 5 years.
Quite likely the cyclical best is being accomplished.
On the last recession crude oil prices crashed from 147 in 2008 to 33.5 in March 2009. The next bull market made it to 114.83 in April 2011. That top was accompanied by the most overbought on the Weekly RSI since 2008. Also there was the signal from our Momentum Peak Forecaster that we took as the cyclical peak for base and precious metals as well as for crude prices.
Base metal and agricultural prices declined by more than 30%. Silver prices plunged by more than 50%. Oil prices declined 11% from 115 in 2011 to 100, recently.
In the face of the cyclical bear market for most commodities, crude’s relative performance has been outstanding. Buoyancy was provided by “Peak Oil” and the “Middle East”, which views had become institutionalized.
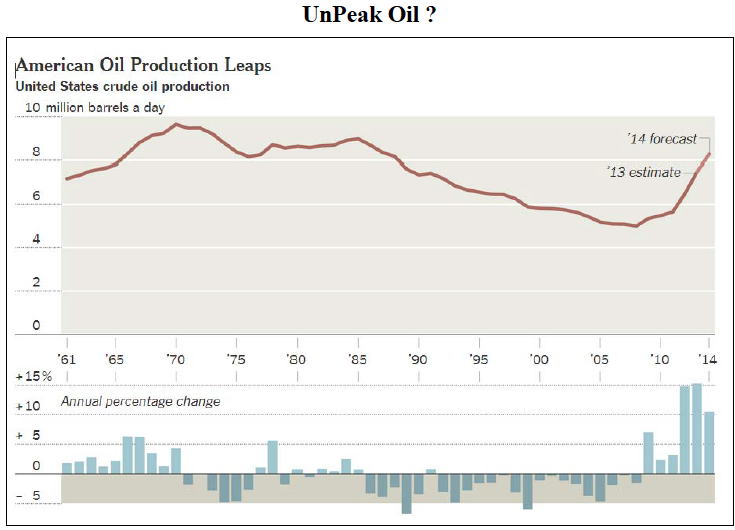
The following chart shows the remarkable rise in American shale-oil production since 2011.
The equivalent is taking place essentially around the world.
Mineral extraction has enjoyed outstanding technological innovations. Bulk mining of low-grade copper porphyrys began in the early 1900s. Such mining of other base and precious metal deposits followed. Then there was the development of heap-leach mining of low-grade gold deposits. Strip mining of metallurgical and thermal coal is yet another example of technological revolution.
The unprecedented increase in productivity has materially helped those who work to support the governing classes and their dependents.
It is technical analysis and historical research that prompted our 2008 call that Peak Oil was over.
Technically, crude oil is only moderately overbought and at 102 is breaking above resistance at 100 set in December and 101 set in September.
Action in natural gas has been outstanding with the Weekly RSI up to 76. This compares to 77 reached on July 4th 2008. The high price was 13.60, which was shy of the peak of 15.78 set in 2005.
Because of its impressive dynamics natgas could be the guide to the play. Seasonal tendencies are favourable and the run could continue into spring.
It is worth reviewing the low of last summer, which opportunity we missed. On August 21st, Climate Depot reported that for the period from July 24 to August 19 there were 2899 weather stations that recorded record low temperatures. There were only 667 stations that reported record highs. That was for the summer within the contiguous United States. Natgas low was 3.13 on August 9th. The “Polar Vortex” was not in the headlines.
For January, the tally was 4408 stations with record lows and 1259 with record highs. For what it’s worth, there were 1093 stations with snowfall records.
Occasionally, we have mentioned that at some time crude oil could suffer a decline in its trading range similar to that suffered by natural gas. This is an attempt to place this possibility in perspective. Hopefully within a month or so of the top.
- Technological revolution in extraction.
- Dramatic change in reserves and rates of production.
- This has quickly become widely known.
- A popular “Peak Oil” site was voluntarily shut down in September.
BOB HOYE, INSTITUTIONAL ADVISORS – WEBSITE: www.institutionaladvisors.com
WEEKLY COMMENTARY
Stick With Your Winners
Picking the right stocks to own is what most people focus in on but the entry is actually not the most important component of the trade. Without good risk management and a sound exit strategy, even the best stock pickers will fail.
I manage risk by limiting the size of the losses I take. If a stock that I buy breaks down through support, I sell it and take the small loss. I recognize that I am not going to be right all of the time and trading success requires that I take small, manageable losses when I am wrong.
Judging the success of a trade should be in consideration of the risk taken. If you risk $1000 to make $500, you have earned a reward for risk ratio of 0.5. If you make $5000 by risking $1000 then you have earned a reward for risk of 5. Obviously the latter is better but many traders never realize big gains because they sell their winners early. This is motivated by a fear of a winner turning in to a loser but it can really hurt performance if you don’t let your profits run.
Normal people will actually do the opposite of what they should by being patient with their losers. It is painful to take a loss so any normal, pain avoiding person will avoid taking that small loss when the market proves them wrong and instead hold on, hoping for the stock to turn around. The small loss often grows to be a big one.
Let’s review the stocks featured in this newsletter two weeks ago and go through the concept of reward for risk and what these stocks have done since their feature on Feb 10 2014. Here are the original comments:
T.BLD
T.BLD is breaking from a pull back after a strong run higher to start 2014. This is a good continuation pattern which should allow the stock to move up to new 52 week highs in the near term. Support at $2.20.
T.KGI
T.KGI is one of many gold mining stocks that are showing good signs of a turnaround after a lengthy bear market. The stock is breaking higher from a rising bottom and appears to be reversing the downward trend. Support at $3.20.
T.AUQ
T.AUQ is breaking the two year downward trend on the long term chart and through resistance from a cup and handle pattern on the daily chart. Support at $4.95.
Notice in my features I mention support; that is the loss limit point. So, T.BLD was at $2.47 when I featured it with support at $2.20. That means the risk was $0.27 a share. As I write this the stock is at $3.30 which is up $1.10 and a reward for risk of 4.07.
T.KGI was featured at $3.74 with a support at $3.20 so risk is $0.54. Today the stock is at $4.02, up a reward for risk of 0.52.
Finally, T.AUQ was featured at $5.47 with support at $4.95. Today it is at $5.65 with a reward for risk of 0.35.
So, of these three stocks, all three are winners but only one is a strong winner with a reward for risk of 4.07. If you risked $500 on each trade, you would up a total of $2470.00 but most of that profit comes from the strongest stock, T.BLD.
T.BLD showed some minor weakness on Feb 20th, not enough to give an exit signal but enough to make a nervous shareholder look for the exit door. What if the trader lacks patience and jumps out because of one down day? They leave a lot of money on the table!
The point of these examples are to show the importance of letting your winners run. As traders, we are playing a numbers game. Out of 10 trades, some will be small winners, some will be small losers and perhaps two will be big winners. It is the big winners that give us market beating profits but if you don’t have the patience to stick with them, you really hurt overall performance.
STRATEGY OF THE WEEK
I am constantly doing Market Scans on Stockscores, looking for stocks showing abnormal market activity, the signal that investors have become excited about a company’s prospects and are likely to send the stock higher. Abnormal activity out of predictive chart patterns can be applied on an intraday chart for day traders, a daily chart for swing traders or a weekly chart for position traders. This week, I highlight a couple of Canadian stocks that I have featured recently to readers of my daily newsletter (www.tradescores.com) which are showing good long term weekly charts.
STOCKS THAT MEET THE FEATURED STRATEGY
1. T.CQE
T.CQE broke out last week and has pulled back a little bit to start this week. The long term outlook is excellent for the stock as it has broken from a lengthy ascending triangle pattern on the 3 year weekly chart. Support at $1.68.

2. T.T
T.T broke out of a cup and handle pattern and up to new highs a couple of weeks ago. After a short pull back, the buyers have come back to the stock again and look to be willing to continue its upward trend. Support at $35.95.

 Stockscores Market Minutes Video
Having a solid process for finding trades is only effective if you also have the patience and discipline to carry out the plan effectively. This week’s Market Minutes video demonstrates the use of the Market Scan for one strategy and then provides the regular weekly market analysis.View the video by clicking here.
References
- Get the Stockscore on any of over 20,000 North American stocks.
- Background on the theories used by Stockscores.
- Strategies that can help you find new opportunities.
- Scan the market using extensive filter criteria.
- Build a portfolio of stocks and view a slide show of their charts.
- See which sectors are leading the market, and their components.
Disclaimer
This is not an investment advisory, and should not be used to make investment decisions. Information in Stockscores Perspectives is often opinionated and should be considered for information purposes only. No stock exchange anywhere has approved or disapproved of the information contained herein. There is no express or implied solicitation to buy or sell securities. The writers and editors of Perspectives may have positions in the stocks discussed above and may trade in the stocks mentioned. Don’t consider buying or selling any stock without conducting your own due diligence.


-
I know Mike is a very solid investor and respect his opinions very much. So if he says pay attention to this or that - I will.
~ Dale G.
-
I've started managing my own investments so view Michael's site as a one-stop shop from which to get information and perspectives.
~ Dave E.
-
Michael offers easy reading, honest, common sense information that anyone can use in a practical manner.
~ der_al.
-
A sane voice in a scrambled investment world.
~ Ed R.
Inside Edge Pro Contributors

Greg Weldon

Josef Schachter

Tyler Bollhorn

Ryan Irvine

Paul Beattie

Martin Straith

Patrick Ceresna

Mark Leibovit

James Thorne

Victor Adair