To the World Nuclear Association, 2% uranium ore is high grade. At 14%, 16% and even 20% uranium, the grades in the Athabasca Basin are astounding analysts and investors around the world. Derek Hamill, Zimtu Capital Corp.’s new head of research, tells The Energy Report about where the investment dollars are moving in the Athabasca Basin, and what areas and companies are worth watching going forward.
 The Energy Report: Derek, thank you for joining us. Why is the Athabasca Basin generally described as the most prolific uranium source in the world?
Derek Hamill: There are a few factors that make the Athabasca Basin region of Saskatchewan and Alberta the best place to look for, and mine, uranium. Grade is the number-one factor. The average grades for a few of the bigger deposits in the Basin are above 15% U3O8, whereas the world average is far below 2% U3O8. The next important factor is that Saskatchewan is a great place to build a mine, and has been since the 1950s. There is all the necessary infrastructure (roads, power, mills) in most of the region. The western region of the Basin, including Fission Uranium Corp.’s (FCU:TSX.V) Patterson Lake South (PLS) project, does not have existing power or operating mills. But given how this deposit and potentially others are developing, it’s just a matter of time.
TER: What are the shortcomings of the Athabasca Basin compared to other uranium-producing basins?
DH: Infrastructure is a major factor that influences the economics of a potential mine. In the last few decades, the exploration in the western section of the Athabasca Basin has been markedly quiet compared to the east, where Cigar Lake, McArthur River and other mines and mills are located. The PLS area is relatively remote compared to the eastern section of the Basin. Additional exploration in the region will likely prove up another deposit, so over time the western side will build comparable infrastructure. However, there will need to be material investment to develop the necessary infrastructure in the western areas of the Basin.
Another shortcoming of some deposits in the western region is the depth. The Cigar Lake mine illustrates this point quite well. The deposit is located between 410–450 meters (410–450m) below the surface, far too deep for cheaper open-pit mining, and the entire deposit needs to be frozen in order to prevent flooding. In 2006, a breach of this freezing technology caused significant delays. The project had an original start-up date of 2007, and is now expected to be producing by the end of Q2/14. Keep in mind though that many deposits in the Basin, including the PLS project, are at conventional open-pit mining depths.
TER: I have seen high praise lavished on Fission’s PLS deposit. What’s the reason for that?
DH: As mentioned, most of the past exploration and all the production in the Basin comes from the eastern side of the Basin. PLS has brought renewed optimism for exploration in the southwestern areas of the Basin that surround the discovery. Additionally, PLS is close to the surface, meaning open-pit mining of fairly high-grade uranium is an option.
TER: Is there another deposit in the basin that comes close to PLS?
DH: Right now in production is McArthur River, and Cigar Lake should start producing this year. Both are operated by Cameco Corp. (CCO:TSX; CCJ:NYSE). Average grades for both are listed as 14–16%. Once Cigar starts, McArthur and Cigar will be the two largest high-grade uranium mines in the world.
Cameco is by far the largest producer in the Basin, followed by AREVA SA (AREVA:EPA). Denison Mines Corp. (DML:TSX; DNN:NYSE.MKT) holds an interest in the McLean Lake mill and in several near-term producing deposits. Rio Tinto Plc (RIO:NYSE; RIO:ASX; RIO:LSE; RTPPF:OTCPK), which purchased the Roughrider deposit in 2012 from junior Hathor Exploration for $654 million ($654M), appears to be advancing its deposit fairly aggressively. UEX Corp. (UEX:TSX) is also a candidate for near-term production with its Shea Creek and Hidden Bay projects.
TER: How does grade affect price?
DH: The major uranium producers, such as Cameco, AREVA and Denison, generally negotiate the price of uranium on long-term contracts. These companies also process all the ore in the three mills situated in the eastern region of the Athabasca Basin. It is not like other commodities, where the final product is sold on a fluid or open market. The producers generally control the mining and milling of the ore into a product called yellowcake, which is about 70% uranium. At this point, the yellowcake is either further refined in Canada or shipped directly to customers in the U.S. or overseas.
Cameco’s estimated cash costs at Cigar Lake could be somewhere around $18/pound ($18/lb) or less. High-grade ore can help control operating costs. Many uranium analysts believe that a long-term price of $60/lb U3O8 is needed to properly incentivize investment and maintain production for close to one-third of the world’s high cost production. I believe the fact that Paladin Energy Ltd. (PDN:TSX; PDN:ASX) is placing operations at its Kayelekera mine in Malawi on care and maintenance (after continued operating losses) illustrates the material difference in cost structures that exist for producers outside the Basin.
There are also some external factors. Saskatchewan is a politically friendly, stable environment, with an established regulatory and tax environment. There’s technical expertise in the area as well. Grade is only one factor in the mining and milling economics of a deposit. The less material that you have to physically mine, truck and process, the more lucrative your operation.
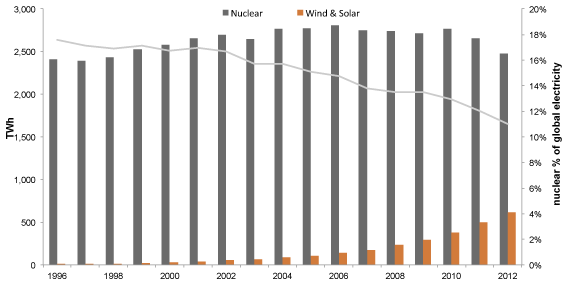
TER: You have reported the average compound annual growth rate of several forecasts of electricity generating capacity from 2010 to 2025 as 2.6% for nuclear and 6.3% for non-hydro renewables. That’s a higher growth rate for renewables than for nuclear. Why is nuclear a better target for investment?
DH: Nuclear is not necessarily better; there’s actually tremendous room for both. Nuclear reactors can supply consistent electricity generation, night and day, over a long operating life, 40–60 years. The fuel costs represent 10–15% of the total cost of running a nuclear reactor. Even during the uranium price spike in 2007, operating costs for a nuclear reactor in the U.S. did not increase. That’s an attractive property. Of course, nuclear can help reduce CO2 and SO2 emissions, which also makes the technology attractive in places like China, where air quality is an issue.
The biggest knock against nuclear energy has been the enormous capital costs of building reactors. Westinghouse Electric Co. is designing the AP1000, focused on simplifying the process—passive safety systems, fewer moving parts, etc. Hopefully, this kind of innovation can help control capital costs.
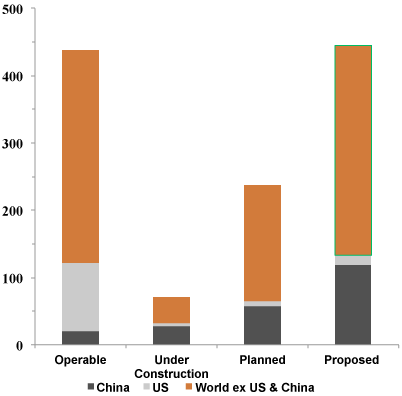
In China, nuclear power is growing at a 10-year compound annual growth of about 14.5%, but it still represents only ~2% of the country’s electricity production, so there is tremendous potential for nuclear power as well as renewables.
TER: Most analysts are expecting the price of uranium eventually to rise from its current low. How will a higher fuel price affect the growth rate of nuclear power generation?
DH: I doubt it will. As I said, fuel costs are only 10–15% of the nuclear reactor. The demand from nuclear electricity generation going forward will have a strong influence on uranium pricing, but the price of uranium shouldn’t have a huge influence on the decision whether to build nuclear reactors.
I know there’s been a lot of talk of a nuclear renaissance, but it’s complicated. The West, outside of France, hasn’t shown much of a commitment to nuclear energy. In fact, last year the U.S. prematurely closed four reactors. It doesn’t seem like there is much support for the industry. China appears committed, but will take a few years for the country to really become the uranium market mover. In the current environment, I don’t see uranium prices materially increasing. Again, that’s why the Athabasca Basin is an important region.
TER: Are Canadian uranium producers seeing any benefit from the termination of the Non-Resident Ownership Policy?
DH: Not in particular. I wouldn’t be surprised to see some Chinese utilities invest in the Basin, but I don’t see them becoming mine or mill operators. It would make more sense to partner with a company like Cameco.
TER: Is anyone visibly benefiting from the policy change?
DH: Companies out of Asia have expressed fairly robust interest in investing in the Athabasca Basin’s uranium exploration. This has more to do with long-term growth in commercial nuclear generating capacity in Asia than with any Canadian policy change.
TER: You have a half-dozen uranium companies in the basin under coverage. What are some of their strengths and weakness?
DH: Zimtu Capital Corp. (ZC:TSX.V) has equity exposure to several uranium exploration companies, including, most recently, Lakeland Resources Inc. (LK:TSX.V). The major strength we at Zimtu look for as a project generator are the people actively involved in a project.
Lakeland Resources is a great case in point. The company has a strong technical team with a clearly defined business strategy, and has added some serious uranium expertise to the advisory board. Lakeland has a large land package, much of which has historic data. Lakeland’s focus has been to enhance this historical data with modern at-surface geological and geophysical techniques before partnering the individual projects for drilling. In this way, the company is able to diversify some of the exploration risk by working on multiple targets at the same time. The large land package also allows Lakeland the freedom to act as a property vendor. If there is a weakness in this strategy, it is that by partnering, Lakeland sacrifices some of the upside in the event of a discovery.
NexGen Energy Ltd. (NXE:TSX.V) has benefited from its location near PLS, so it’s an attractive area play. NexGen has also proven to be able to raise capital during tough market conditions. Zimtu is a shareholder of the company.
Skyharbour Resources Ltd. (SYH:TSX.V) is part of a syndicate, the Western Athabasca Basin Syndicate, that shares in the costs of exploration. We don’t have any direct exposure to Skyharbour or the syndicate, but it is a different business model that, if done correctly, makes sense. Of course, efficient cooperation among four equal partners may take some work.
I’m not a geologist. My background is in finance, so I like to look at many different strategies and promote diversification.
TER: You have highlighted a lot of difficult variables in assessing the uranium space. Do you have some parting advice for people who would like to take a look at it?
DH: For investment in nuclear, in terms of mining and exploration, it’s a pretty simple strategy. You already know the major producers, such as Cameco and AREVA in Canada. In the U.S., there are a few smaller low-cost operations. So if you are a cautious investor, your money will probably be best with current producers. Next you have the near-term producers of which there are only a handful. Then there are the junior miners in Canada. Those that are in the Athabasca Basin hold a lottery ticket to a monster deposit. Hathor Exploration is an excellent example of a company that in 2006 had a market cap of about $6M, discovered the world-class Roughrider deposit in 2008, and was bought by Rio Tinto in 2012 for $654M. You need to look for a junior with a good portfolio of projects and the right people in order to make a discovery. I would caution people looking at uranium exploration companies to try to diversify. The Athabasca Basin is a low-cost producer. So if the uranium price remains under distress, the Basin should attract both domestic and foreign exploration dollars.
TER: Thank you, Derek.
DH: Thanks, Tom.
Derek Hamill completed his Master of Financial Analysis and Professional Accounting at La Trobe University, a leading Australian academic institution, and holds a bachelor’s degree in economics from the University of Calgary. Between degrees, Hamill worked for several years as an investment executive for ScotiaMcLeod, a leading Canadian wealth-management firm. As the newly established head of research for Zimtu Capital, Hamill provides long-term outlooks for various commodities and updates on key internal portfolio holdings. He has access to an impressive array of experienced and knowledgeable industry professionals who are associated with the Zimtu family. Zimtu’s circle of industry contacts includes all aspects of the mineral exploration and development process, from first acquisition of mineral claims to the cutting of the ribbon at mine opening.
Read what other experts are saying about:
Want to read more Energy Report interviews like this? Sign up for our free e-newsletter, and you’ll learn when new articles have been published. To see a list of recent interviews with industry analysts and commentators, visit our Streetwise Interviews page.
Related Articles
DISCLOSURE:
1) Tom Armistead conducted this interview for The Energy Report and provides services to The Energy Report as an independent contractor. He or his family owns shares of the following companies mentioned in this interview: None.
2) The following companies mentioned in the interview are sponsors of The Energy Report: Fission Uranium Corp., UEX Corp. and Zimtu Capital Corp. Streetwise Reports does not accept stock in exchange for its services or as sponsorship payment.
3) Derek Hamill: I or my family own shares of the following companies mentioned in this interview: None. I personally am or my family is paid by the following companies mentioned in this interview: None. My company has a financial relationship with the following companies mentioned in this interview: Zimtu Capital has a financial relationship with both Lakeland Resources and NexGen Energy. To my knowledge we have no relationship with Skyharbour. I was not paid by Streetwise Reports for participating in this interview. Comments and opinions expressed are my own comments and opinions. I had the opportunity to review the interview for accuracy as of the date of the interview and am responsible for the content of the interview.
4) Interviews are edited for clarity. Streetwise Reports does not make editorial comments or change experts’ statements without their consent.
5) The interview does not constitute investment advice. Each reader is encouraged to consult with his or her individual financial professional and any action a reader takes as a result of information presented here is his or her own responsibility. By opening this page, each reader accepts and agrees to Streetwise Reports’ terms of use and full legal disclaimer.
6) From time to time, Streetwise Reports LLC and its directors, officers, employees or members of their families, as well as persons interviewed for articles and interviews on the site, may have a long or short position in securities mentioned and may make purchases and/or sales of those securities in the open market or otherwise.

 Financial markets are at the whim of how events will unfold in Ukraine. Equity markets looked poised to breakout off of Friday’s job numbers, but pared back their early gains. Given gold’s failed attempts to breakout past key resistance levels, it previously looked under pressure; however, the metal ended up maintaining a positive finish to the week as its geopolitical safe haven bid ensued. As well, Friday’s sell off in US treasuries sent yields on the 10 year bond to its highest level since January, despite the dollar seeing regained strength as it is geopolitical tensions that are keeping the markets at bay.


