
Stocks & Equities
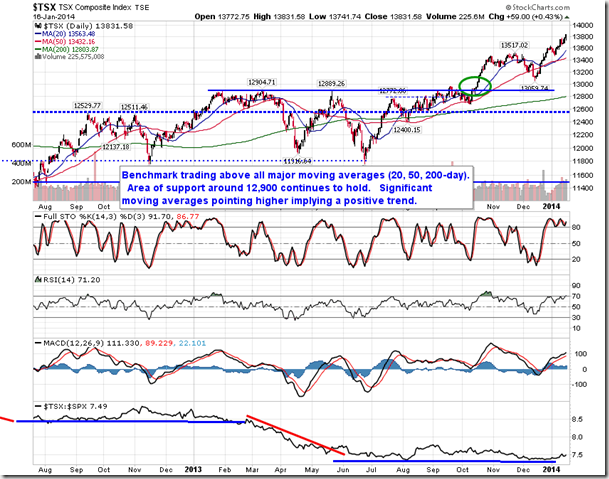
U.S. equity markets have a history of moving higher during the first two weeks in March. The period is the second highest two week period in the year, second only to the Santa Claus rally period. March is the fourth strongest month in the year for the S&P 500 Index and third strongest month in the year for the TSX Composite during the past 62 years. Best performing sectors in the month during the past 22 periods are Energy, Consumer Discretionary and Financials. Weakest performing sectors are Health Care and Consumer Staples. Strongest sub-sectors are Retail and Chemicals. Weakest sub-sectors are Gold and Biotech.
Selected seasonal trades continue to work (e.g. energy, oil services, gasoline, crude oil, base metals, grains, uranium, platinum, chemicals)
International events could influence equity markets. The Ukraine remains a focus. More economic data from China will be watched closely.
The Bottom Line
Stick with favoured seasonal trades for now.
Ed Note: Continue reading Don Vialoux’s Monday report with includes Economic News this Week plus analysis of 45 charts. Also examines”Seasonal” trades through a link to EquityClock.com‘s monday report.


So with the bull market celebrating its five-year anniversary and the S&P 500SPX -0.49% back at record levels, just how pricey are stocks?
It depends how you look at it. Using Thursday’s S&P 500 close at 1,877.03 and a forward 12-month earnings-per-share estimate of $121.86, the forward 12-month price/earnings, or P/E, ratio for the index stood at 15.4, according to data provider FactSet.
That’s above both the five-year average of 13.2 and the 10-year average of 13.2 and the 10-year average of 13.8. The ratio has been above the five-year average for more than a year and has been running above the 10-year average for the past six months. So if you want to call the S&P 500 “overvalued,” you’ve got some ammo, FactSet notes.
But keep in mind that the forward P/E ratio is still well below the 15-year average of 16.0. Fifteen years takes you back to the most bubbleicious part of the tech boom. During the first two-years of the time frame — 1999 to 2001 — the forward 12-month P/E ratio stood consistently above 20 and peaked near 25, FactSet recalls. So with the ratio below the 15-year average and nowhere near its peak, one could also argue that the index might still be undervalued, FactSet says.
The ratio would be even higher if analysts weren’t projecting record earnings levels over the next four quarters, they said, in a note:
At this time, the Q4 2013 quarter has the record for the highest bottom-up EPS at $28.78. However, starting in Q2 2014, industry analysts are projecting EPS for each of the next four quarters to exceed this record amount. In aggregate, they are calling for 11.3% growth in EPS over the next four quarters (Q214 – Q115), compared to the previous four quarters
(Q213 – Q114).
Probably the most important thing to keep in mind, however, is that, as the chart shows, P/E can remain at extremes for quite some time, making efforts to time the market based solely on the measure a potentially dubious proposition.
–William Watts
Follow William on Twitter @wlwatts
Follow The Tell @thetellblog

 Back in November we took a close look at the uranium market.
That’s because the end of a 20-year milestone agreement was fast approaching…
From 1993 to 2013, the Megatons to Megawatts program saw highly enriched uranium from 20,000 Russian warheads converted into nuclear fuel, supplying American utilities.
At the time I highlighted a uranium investment that could profit from this opportunity, and it’s just begun to tap into its upside…
Now we’re seeing more bullish developments that point to even bigger gains…
A Major Global Buyer Is Heading Back into the Market
In the wake of Japan’s Fukushima disaster, my colleague, Bill Patalon – the Executive Editor of Private Briefing – asked me how I thought the shortfall from offline nuclear power would be compensated.
I told him to expect Japanese liquefied natural gas (LNG) imports to be boosted; it was the most logical option to quickly make up the country’s sudden energy shortfall.
And that’s exactly what happened. But I knew it would only be temporary.
Since then Japan’s witnessed a huge upsurge for LNG, setting a new import record again in 2013. As a group, Japan, South Korea, Taiwan, and China buy 70% of global LNG, occasionally paying up to five times North American prices.
Japan’s already doubled its annual LNG spending, eating into exporters’ input costs and countering Prime Minister Shinzō Abe’s hopes to boost exports through a devalued yen.
So the Japanese are desperately looking for ways to diversify their energy mix…
Before the Fukushima disaster, Japan derived 30% of its electricity from nuclear. Today that has dropped to exactly zero.
So it’s not surprising that Abe’s successful 2012 election included a pro-nuclear energy policy.
Lately, some suggested that Japan may shy away from nuclear power due to ongoing protests. But, it looks like that’s not going to be the case after all.
There’s been a recent string of newsbites that have bolstered the pro-nuclear position.
In mid-February Tokyo elected a pro-nuclear governor, Yōichi Masuzoe, reinforcing Abe’s position.
Then late last month, the Japanese government released a draft of its final energy policy plan. In it they confirmed that, for the next two decades, nuclear would remain a key base-load source of power. The plan calls for the restart of shuttered reactors, and may even lead to the building of new ones.
But Japan’s not the only place where nuclear is likely to come back into the fore.
When the nuclear disaster hit Japan in 2011, a number of nations decided to scale back their nuclear programs. Germany was one of the most prominent, deciding to completely phase out nuclear by 2022.
They unrealistically had pinned their hopes on renewables, which have pushed electricity costs to the second-highest in the EU.
Energy security is a big deal in Western Europe, and it’s about to get even bigger.
This Crisis Will Add to Demand… and Opportunity
Thanks to Russia/Ukraine tensions, it would be an understatement to say Western Europe is sleeping a little more uneasily these days. No wonder.
Europe relies on Russia for 40% of its natural gas, half of which flows through Ukraine. And Europe’s four largest economies are especially vulnerable, relying heavily on Russian gas: Germany at 36%, France at 15%, Italy at 27%, and the UK at 25%. They pay double the price levels we do in North America.
I don’t think it will take too long before practicality sets in, and Europeans come around to Japan’s view of nuclear power. In fact, Germany already imports significant quantities of its electricity from France – which generates it from nuclear power.
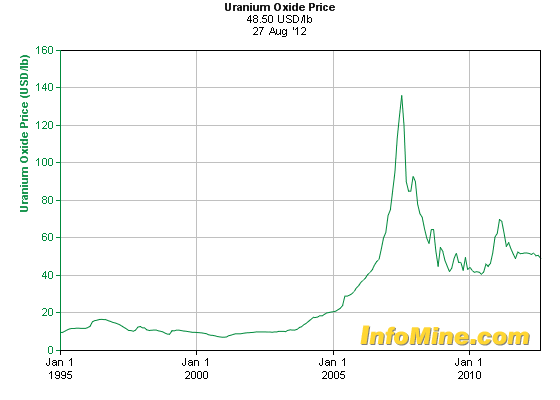
Through all of this, uranium prices have remained low. But that may be changing… very soon.
As I said back in November, the rest of the world is forging ahead with nuclear power regardless of perceived hurdles. There are 71 new reactors under construction, and 173 are on order or in planning stages.
Any oversupply of uranium from the shutdown of Japanese reactors is being worked through, and mine supply is getting thinner by the day.
Paladin Energy Ltd. (TSE: PDN) recently announced it would suspend its 3 million pounds/year U3O8 KM mine in Malawi, Africa. This news comes on the heels of a number of other suspensions, cancellations, or delays by producers like Areva SA (EPA: AREVA),Energy Resources of Australia Ltd. (ASX: ERA), and Russia’s AtomRedMetZoloto.
Complicating matters, Russia looks set to establish a commanding position not only in natural gas, but in the nuclear space as well.
South Africa has just inked a deal with Russian state-owned nuclear power companyRosatom. Under the agreement, Rosatom will build eight new reactors and supply the nuclear fuel needed. That will boost South African nuclear power capacity from 1.8 gigawatts to 11.4 gigawatts by 2029.
But Rosatom has been aggressively making similar deals with other nations, including Turkey, Finland, the UK, and yes… even Ukraine.
All this swelling demand for nuclear fuel is going to manifest itself in the form of higher uranium prices. It has to.
Soros Nearly Doubled His Bet on Uranium… in OneQuarter
Anyone who bought Uranium Participation Corp. (TSE: U) when I highlighted it back in November is sitting on a tidy 8% gain already.
In the last two months, other encouraging signs have materialized signaling that the uranium bull is back.
Uranium Participation Corp. recently raised $50 million to buy more physical uranium in the market. Clearly, they see the current spot price around $35 as temporarily depressed and certain to rise, especially given that it costs upward of $80/lb. to mine the stuff.
Another uranium play that’s showing promising action of late is Cameco Corp. (NYSE: CCJ), the largest publicly traded uranium producer on the planet.
On the day following Japan’s recent national energy policy announcement, CCJ moved up 8.2%. The next day, Cameco climbed another 4.7%. Since the news, the stock is up a total 17% in just two weeks. And George Soros now owns $55.4 million of Cameco stock after boosting his holdings by 42% last quarter.
My approach for Real Asset Returns readers is to identify global trends before they gain mainstream recognition. That trigger allows us to position ourselves for maximum gains as these trends play out.
The uranium bears are exhausted. Market forces are beginning to take effect as the cure for low prices is low prices.
After nearly three years of correction and consolidation, uranium has all the hallmarks of a sector poised to break out.
And I expect the plays I’ve highlighted above to profit handsomely as uranium begins to head much higher…
About Peter Krauth
Peter Krauth is a former portfolio adviser and a 20-year veteran of the resource market – with special expertise in energy, metals, and mining stocks. Peter uses the close contacts and connections he amassed over the years to exploit the moneymaking potential of every kind of commodity.
He’s the Resource Specialist for Money Map Press and has contributed some of our most widely read and highly regarded investing articles to Money Morning. As editor of Real Asset Returns, he travels around the world to dig up the latest and greatest profit opportunity, whether it’s in gold, silver, oil, coal, potash, chromium, or even water.
Peter holds an MBA from McGill University and is headquartered in resource-rich Canada.

Russian forces advanced in Ukraine’s Crimean peninsula, ignoring Western calls to halt a military takeover before the region’s separatist referendum.
Ukrainian Prime Minister Arseniy Yatsenyuk said yesterday he’d travel toWashington this week as Russian President Vladimir Putin defended Crimea’s local government, which may use the March 16 vote to leave Ukraine and join the country’s Soviet-era master. Russian troops detained Ukrainian border guards at a base a day after gunmen fired warning shots at international observers and barred them from Crimea.
Russia is wresting control of Crimea, home to its Black Sea Fleet, from Ukraine following last month’s ouster of the former Soviet republic’s Moscow-backed leaderViktor Yanukovych. The U.S. estimates Russia now has 20,000 troops confronting a smaller Ukrainian force there. Ukraine has stepped up its eastern border defenses in the worst standoff between Russia and the West since the Cold War.
“There clearly are Russian troops in Crimea,” U.K. Foreign Secretary William Hague said yesterday on BBC TV. “The long-term effect will be to unite Ukraine more against Russian domination of their affairs and to recast European policies in a way that will reduce Russian leverage over Europe.”

This Week in the Gold Market
Trying to predict short term direction is notoriously difficult, especially in the volatile metals market, but I’m going to take a stab at it today.
First off let me start with the big picture: For almost a year now I’ve been saying that the inflation that’s been stored in the stock market for the last three years is eventually going to start leaking into the commodity markets. You can see in the next chart that process has begun as smart money investors begin to move capital out of an overvalued and overextended stock market that is destined to top some time during the first half of this year, and into undervalued commodity markets where they are getting a better return on their investment.
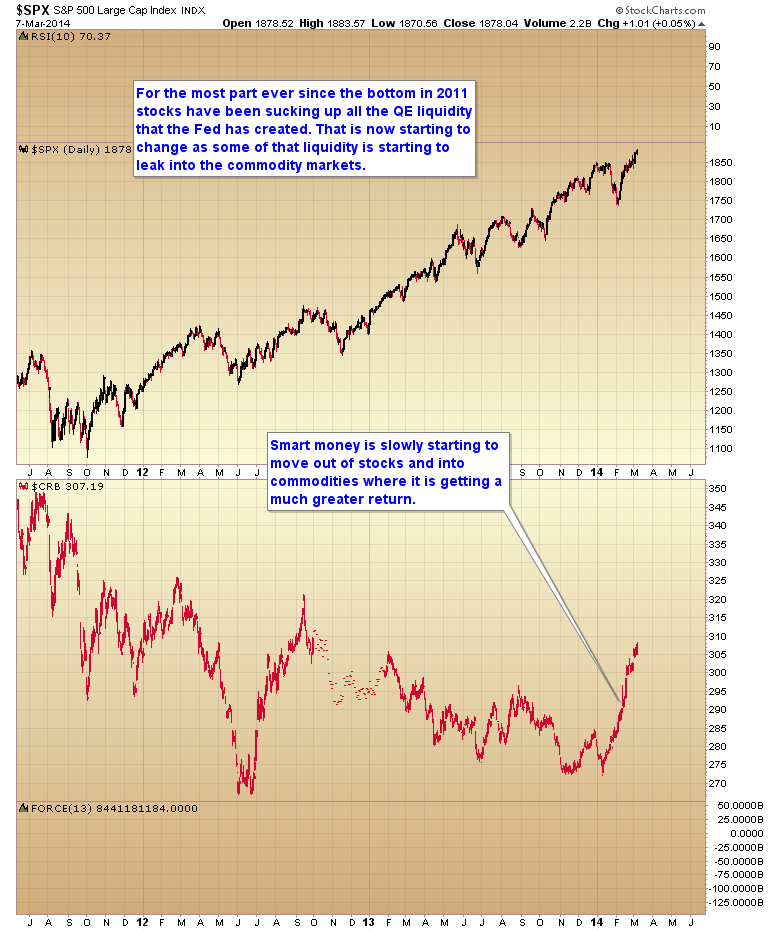
While the stock market is up 10% over the last month and a half, the CRB is up 12%. But that’s not the whole story. Gold is up 14% in the last two months, oil 15%, wheat 20%, corn 23%, sugar 27%, and the big winners, coffee at 90%, and natural gas at one point over 100%.
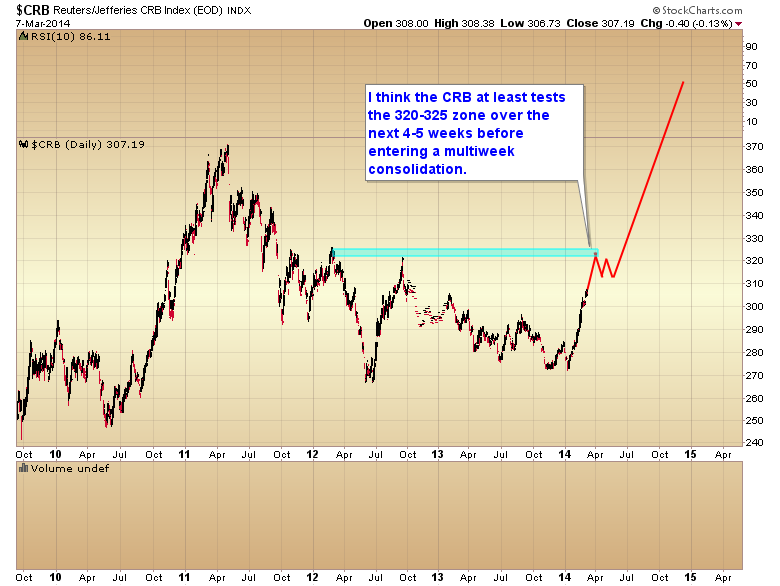
These kind of gains are going to draw more and more capital away from the stock market, at least until commodities form an intermediate top (probably around the first or second week of April). Yes this kind of explosive rally is going to have some kind of corrective move later this spring, but I don’t think the rally is done just yet. I’m looking for an acceleration of the move in March to at least test the 2012 high at 320 on the CRB index before commodities enter a multi-week correction/consolidation phase in April and May.
Next week has the potential to begin this acceleration phase if a couple of things fall into place. First off I think we need to see the dollar continue down into its next daily cycle low, potentially on the March 19 FOMC meeting.
I’ve also taken the liberty of extrapolating on the chart my expectations for the dollar index over the next month as it moves into an intermediate degree bottom.
If I’m right about the next week and a half, then I’m looking for the dollar to drop down and test the October low between now and March 19. As that level is a major support zone I think we will probably get a strong enough bounce at that point to produce a daily cycle low. However, considering that this intermediate cycle topped on week two I don’t think this intermediate decline will be done until the dollar breaks below that October bottom, producing a failed intermediate cycle. So I’m going to look for a shortened daily cycle during the second half of March with a final intermediate bottom probably on the April jobs report.
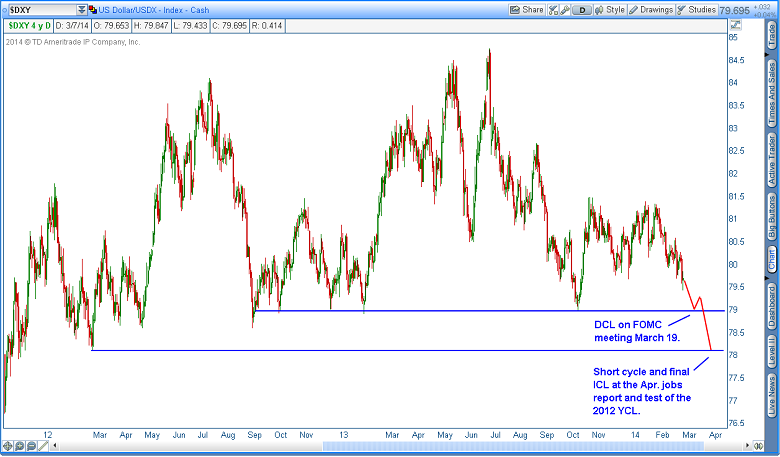
With the January and February employment reports coming in very weak, and the March report respectable at 175,000, I think the market is going to want to see confirmation from the April report before the intermediate trend in the dollar reverses.
Make no mistake, currencies are what is driving the commodity markets, not demand, and I don’t expect them to top until the dollar index finds its intermediate bottom.
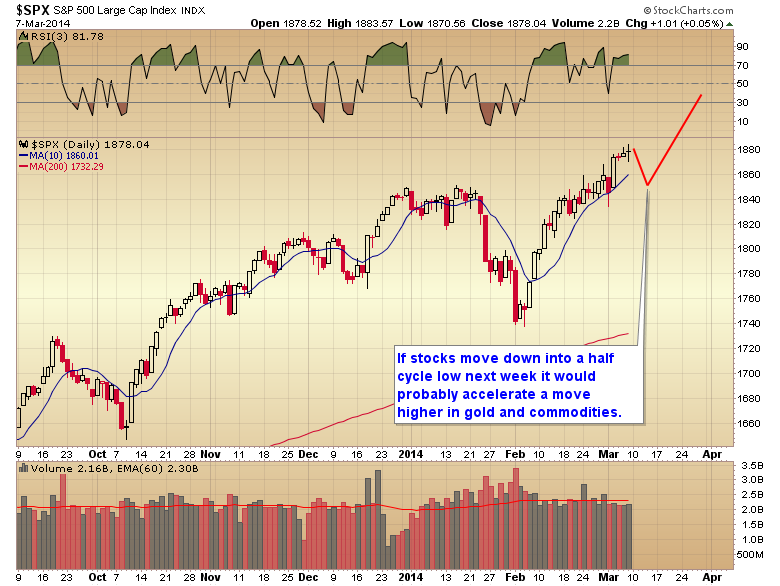
While it’s not absolutely necessary, it probably wouldn’t hurt if the stock market were to drop down into a half cycle low over the next week and divert some buying pressure into the commodity markets as well. If Ukraine concerns were to flare up again this weekend that could presumably tip stocks over into a mild corrective event for a few days. I’m not sure last Monday’s one-day drop qualifies as a true and complete move into a half cycle correction. If that’s the case then next week would fit the timing band perfectly for this minor profit taking event that usually occurs around day 18-25 in the stock market daily cycle. (Monday will be day 21.)
So how does this all tie in to next week’s move in gold you ask?
Well, if the dollar continues to drop into its daily cycle low over the next 8-10 days, and especially if the stock market lends a bit of a boost by falling into a half cycle low, I think gold should break through this resistance zone at $1350 and move up to the $1380-$1400 level over the next week and a half.
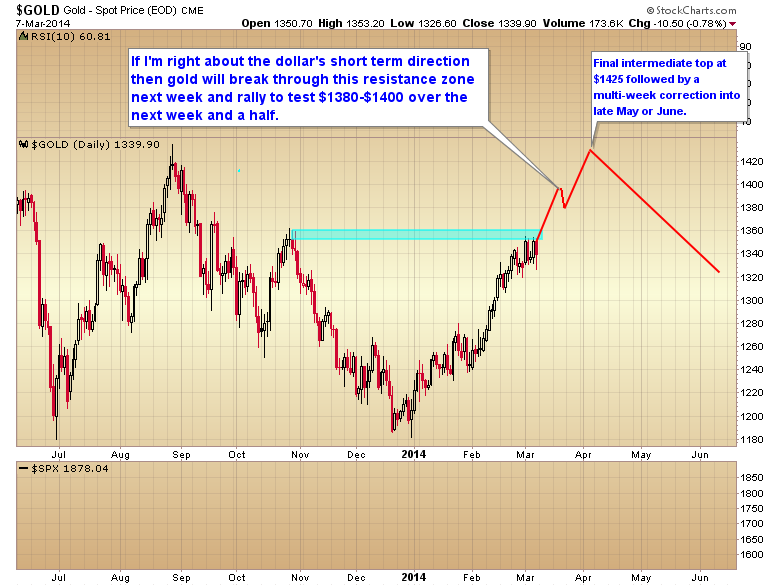
Then assuming that I’m right about a short dollar cycle into the April jobs report, gold should finish its intermediate rally with a test, or marginal break above the $1425 resistance zone in early April before dropping down into a multi-week correction that should form a yearly cycle low sometime in late May to early June.
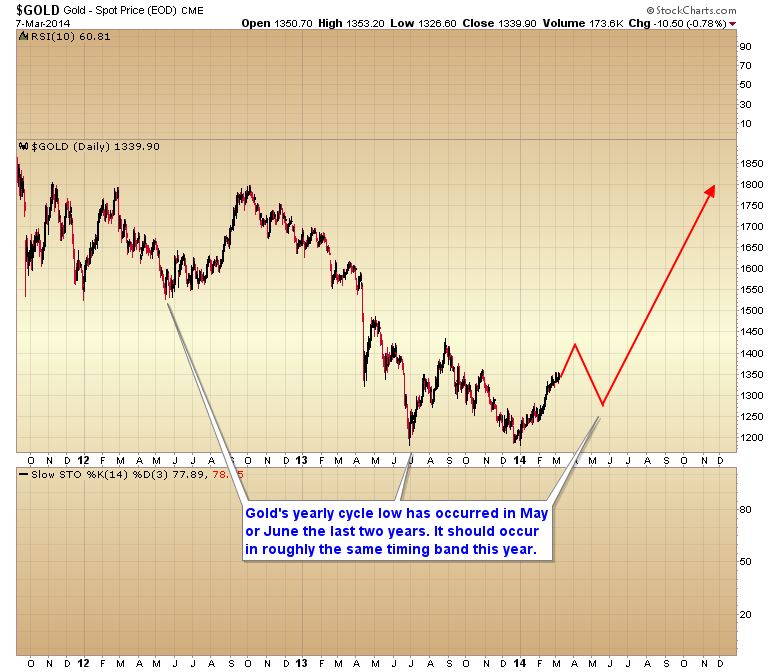
It’s the move out of that yearly cycle bottom this summer where the real fireworks are going to begin in the commodity and metals complex. I’ll have more on that in later articles.


-
I know Mike is a very solid investor and respect his opinions very much. So if he says pay attention to this or that - I will.
~ Dale G.
-
I've started managing my own investments so view Michael's site as a one-stop shop from which to get information and perspectives.
~ Dave E.
-
Michael offers easy reading, honest, common sense information that anyone can use in a practical manner.
~ der_al.
-
A sane voice in a scrambled investment world.
~ Ed R.
Inside Edge Pro Contributors

Greg Weldon

Josef Schachter

Tyler Bollhorn

Ryan Irvine

Paul Beattie

Martin Straith

Patrick Ceresna

Mark Leibovit

James Thorne

Victor Adair