
Bonds & Interest Rates
As promised, today we enter the time that hasn’t come yet… the point where the poor camel’s back gives way.
Yesterday, the Fed announced it would withdraw another $10 billion of artificial demand from the US bond market. And Janet Yellen let slip that the Fed would consider raising short-term interest rates about six months after QE ends.
The Dow fell 114 points. Gold dropped $17 an ounce.
What to make of it?
You’ll recall that, as long as ZIRP (zero-interest-rate policy) continues, the Fed is draining more and more resources from the future. It encourages people to borrow – by dangling near-zero interest rates in front of them.
This debt must be serviced and retired from future earnings. This reduces the amount of capital available for current wants and needs. Thus the future is placed in debt bondage to satisfy the desires of the here and now.
The whole world is in on it. With total global debt of $100 trillion, even if the world could set aside $5 trillion a year, it would take about 30 years to pay off the debt (including interest at “normal” rates).
But the world cannot set aside $5 trillion a year. It can’t even stumble along at break even. Instead, every year it needs an extra $5 trillion of borrowed money (net) just to stay at current levels of unemployment, asset prices, consumption and interest rates!
In other words, today, instead of paying down the past debt, we borrow more from the future just to stay in the same place.
 The question on the table the other day: How much future is left?
We didn’t have an answer. Today, we tackle an easier question: What will the future look like when it comes? We refer, of course, to that part of the future when the you-know-what hits the fan.
As we began to explain two days ago, the typical result of asset price inflation is asset price deflation. That much is guaranteed. And it could begin any day. US stocks were the main beneficiaries of the Fed-induced credit bubble. They will, most likely, be the main victims when the credit bubble bursts. Then the record highs of the recent past will be matched by record lows.
Nature loves symmetry. That’s just the way it is. What goes up must come down. Booms in margin debt, stock buybacks, junk bond issuance, and stock and bond prices will all be followed by terrible busts.
This is as it should be. It is natural. It is healthy. The junk is flushed out… the bad decisions and mistakes are cleansed… economic life can go on. A new boom can begin.
Of course, a real recovery would moderate the bust. Higher incomes, higher sales, higher profits – all contribute to the kind of growth that makes debt less of a burden.
Do we have a real recovery?
The official statistics tell us we have the weakest recovery since the Fed began instigating them. But a closer look at the figures tells us that there is no recovery at all.
Auto sales, house sales, household incomes – all are either flat or falling. You have heard, of course, that the unemployment level has fallen to 6.7%. You have also heard, we suppose, that much of the drop is attributed to older people who have simply retired.
But it isn’t true. Instead of retiring, old people have held onto their jobs like drowning men clutching to their life preservers.
The numbers tell the tale. The age group that has contributed most to the falling labor participation rate is the group in the prime earning years: 25 to 54. Workers over the age of 55, on the other hand, have actually increased their participation in the labor pool. They added 3% to the labor force; the younger group subtracted 4.7%.
Why would older people want to keep working? The obvious answer: They don’t have enough money to retire.
Young people, meanwhile, need to work. There is no question of retirement. But they can’t find jobs.
In other words, the data used to prove that the economy is well and truly recovering proves just the opposite. And here’s something else: The failure to bring a real recovery is the only thing allowing the bubble to continue expanding…
Regards,
Bill
Market Insight:
QE Risks Mount
From the desk of Chris Hunter, Editor-in-Chief, Bonner & Partners
The new head of the Bank of England, Mark Carney, has just stated the blindly obvious.
Speaking in front of an audience of bankers and financial academics in the City of London on Tuesday, Carney said, “It doesn’t take a genius” to see mounting risks to the financial system as a result of Global QE:
In pursuing price stability, monetary policy can contribute to the gradual build-up of financial vulnerabilities through its effect on the degree of risk-taking in the economy. For example, the period of low and predictable interest rates before the financial crisis helped drive a “search for yield” and leverage cycle, even with inflation subdued. It doesn’t take a genius to see that similar risks exist today.
For once, we find ourselves in full agreement with a central banker.
Carney’s message is simple: Artificially low interest rates led to a buildup of risk in the system that triggered the 2008 financial crisis. Artificially low interest rates that followed that crisis are leading to the buildup of new risks.
This will be of no big surprise to Diary readers. After all, what do central bankers think will happen when they erode free market signals… manipulate asset prices… trick people into investing behaviors that have adverse long-term effects (such as buying overpriced stocks and bonds)… and wipe out returns on retirees’ savings?
Bill has long cautioned against getting sucked into the kind of heavily distorted market we have today. As he says, what goes up must come down.
Make sure you’re not over invested in US stocks when the day of reckoning finally comes.


 “Credit Bubble Deflating & Real Estate Market Crashing”
Question: Have they discounted China enough in your view?
China : Credit Bubble Deflating & Real Estate Market Crashing
FABER: Well I think that we had a colossal credit bubble in China and that this credit bubble is now being gradually deflated and will bring about problems in the real estate market and among some major players in the commodity markets as well. So overall, if I look at export figures from China, and they are very closely correlated to overall economic growth, then there is a huge discrepancy between what China reports and what China’s trading partners are reporting.
So if you look at the figures of China, exports are still growing. If you look at the trade figures China exports to Taiwan, so China records exports of so and so much. The Taiwan report imports from China at a much lower level. So which figures are more reliable? I think the figures of the trading partners of China are more reliable. And they would suggest that growth has slown down considerably.
Governments will always publish the statistics that they wish to show irrespective whether that is in China or in other countries. Governments control basically the statistical offices, so they can show whatever they want. As Stalin said, it’s not important who votes but who counts the votes. And the government counts the statistics.
Marc Faber is an international investor known for his uncanny predictions of the stock market and futures markets around the world.Dr. Doom also trades currencies and commodity futures like Gold and Oil.

 Gold prices are solidly lower and hit a three-week low in early trading Thursday, on follow-through selling pressure from strong losses suffered Wednesday. A rebound in the U.S. dollar index the past 24 hours and the latest FOMC news are helping to pressure the precious metals markets. Gold market bulls are quickly losing the near-term technical advantage they had enjoyed for several weeks. April gold was last down $17.80 at $1,323.60 an ounce. Spot gold was last quoted down $6.70 at $1,324.40. May Comex silver last traded down $0.621 at $20.215 an ounce.
The market place is still digesting the statement of the latest U.S. Federal Reserve Open Market Committee (FOMC) meeting that ended Wednesday afternoon, and Fed Chair Janet Yellen’s press conference afterward. As expected, the FOMC will continue on its “tapering” program, whereby monthly bond purchases are whittled down by $10 billion a month. What rattled some markets, including gold, was an indication the Fed could begin to raise U.S. interest rates sooner than many expect—sometime in 2015. Yellen is perceived to be fully in the dovish camp on monetary policy, and several markets were caught off guard by the FOMC statement and her remarks that were deemed less-than-fully-dovish.
Ed Note: For Traders & those looking to buy for investment at a less expensive price, read Jim’s read article Where are the Stops? Thursday, March 20: Gold and Silver
The U.S. dollar index has surged following the FOMC developments, which in turn has been a bearish underlying factor for commodity markets, including gold. U.S. Treasury market prices have also slumped (yields rising).
Asian and European stock markets sold off Thursday, following the lead of U.S. stock indexes Wednesday, in the wake of the FOMC statement and Yellen press conference.
The Ukraine-Russia matter has moved from an international crisis to a regional squabble, from the perspective of the market place. Gold is no longer drawing a safe-haven bid from this situation. German President Angela Merkel on Thursday called the Group of Eight (G-8) nations defunct—basically kicking Russia out of the club of the eight most economically powerful nations in the world. Any significant escalation of tensions between Ukraine and Russia would quickly put keen risk-aversion back into the market place.
U.S. economic data due for release Thursday includes the weekly jobless claims report, existing home sales, leading economic indicators, and the Philadelphia Fed business survey.
Wyckoff’s Daily Risk Rating: 5.0 (The Ukraine situation has for the moment de-escalated and has become a non-factor.)
(Wyckoff’s Daily Risk Rating is your way to quickly gauge investor risk appetite in the world market place each day. Each day I assess the “risk-on” or “risk-off” trader mentality in the market place with a numerical reading of 1 to 10, with 1 being least risk-averse (most risk-on) and 10 being the most risk-averse (risk-off), and 5 being neutral.
The London A.M. gold fix is $1,327.00 versus the P.M. fixing of $1,338.00.
Technically, April gold futures have seen a 2.5-month-old uptrend on the daily bar chart at least temporarily negated with this week’s downside price action. The gold bulls have lost their near-term technical advantage. Bulls’ next upside near-term price breakout objective is to produce a close above technical resistance at $1,360.00. Bears’ next near-term downside breakout price objective is closing prices below technical support at $1,300.00. First resistance is seen at the overnight high of $1,335.30 and then at $1,340.00. First support is seen at the overnight low of $1,321.30 and then at $1,310.00.
May silver futures bears have the near-term technical advantage as prices Thursday hit a fresh six-week low. A four-week-old downtrend is in place on the daily bar chart. Silver bulls’ next upside price breakout objective is closing prices above solid technical resistance at $21.50 an ounce. The next downside price breakout objective for the bears is closing prices below solid technical support at $20.00. First resistance is seen at $20.50 and then at the overnight high of $20.73. Next support is seen at $20.00 and then at $19.75.
By Jim Wyckoff, contributing to Kitco News; jwyckoff@kitco.com
Follow me on Twitter @jimwyckoff

ZIRP Up Next?
Everyone expects Janet Yellen to be a rolling over, inflationist stooge just like they did Ben Bernanke. Bernanke came on board after Alan Greenspan had taken the Fed Funds rate up to around 5% if I remember correctly. Inflationists and gold bugs thought they had it in the bag when ‘Helicopter Ben’ assumed control.
Indeed, Bernanke did what he was supposed to do (per the ‘Helicopter ‘Ben’ script) as systemic stresses began to gather in 2007, addressing that pesky Funds rate, culminating in December, 2008′s official ZIRP (zero interest rate policy). Here again is the chart showing the S&P 500′s ‘Hump #3′ attended by this most beneficial monetary policy.
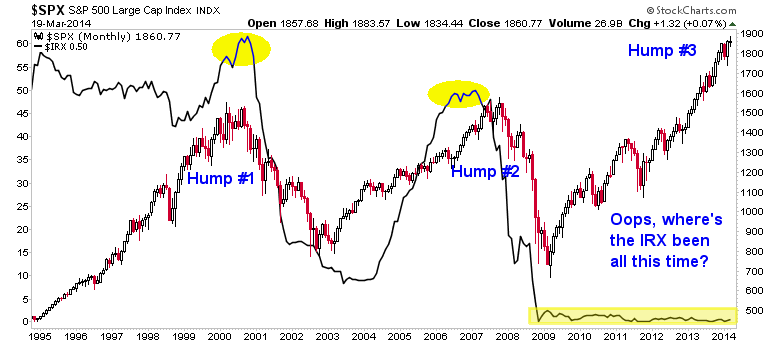
As noted again and again, the much trumpeted ‘taper’ of QE is not only not a negative for the economy, we have made a strong casethat its mechanics are actually a positive, in the near term at least. But putting ZIRP on the table would be a whole different ball of wax.
We need to ask ourselves what kind of distortions the above chart represents, and what would be the implication of these distortions? The S&P 500 has, at the instigation of ZIRP formed a grand Hump #3 and yet this was done without the usual attendant rise in T Bill yields. In other words, the Fed has held ZIRP and continues to hold ZIRP, despite what Janet Yellen ruminated during her post-FOMC press conference:
How long after QE tapering ends will the Fed wait to raise the Funds Rate?
“So the language that we used in the statement is ‘considerable period.’ So I, you know, this is the kind of term it’s hard to define. But, you know, probably means something on the order of around six months, that type of thing.” –Janet Yellen
Nothing has changed, other than a new Fed Chief was asked a provocative question and she bumbled along with an answer. Sort of.
The key questions are…
What sort of inflationary pressures have been built into the system as a result of a fully formed Hump #3 having grown along side still-ZIRPed monetary policy?
and…
Does this have inflationary or deflationary implications?
The answer is for all the marbles where investment (that benefits from inflationary cost effects) or non-investment (cash) are concerned.
Again, as part of the above linked post, we have noted that an incentive is built in for banks to lend if ZIRP is maintained on the short end and the Fed tapers out of the QE bond buying business on the long end. Banks have indeed been lending. An end to ZIRP out in 2015, per Yellen’s answer above, starts a clock ticking on a constriction of this carry trade racket, theoretically at least. All she did after all was wrestle with the English language (“So I , you know, this is the kind of term it’s hard to define”) a little and give an answer (sort of).
But the 2009 to 2014 portion of the chart above is a distortion, no matter how you slice it. Normally, the S&P 500 runs positively with elevated or rising T Bill yields as it seems to test the will of policy makers every step of the way. This is the oldest contrarian play in the book; everybody fears rising interest rates, bears think it’s in the bag and yet the bull continues.
But this time the seed corn has already been used. I would argue that ZIRP should have been withdrawn long ago, let alone the vague “hard to define” timeline put out by the Fed Chief yesterday. The fact that ZIRP was not ended back in oh, 2010 or 2011, when inflation began to get out of control, was telling. What have they been afraid of? They say they want more ‘jobs’, less unemployment and more vibrant economic activity.
But you do not use something as powerful and potentially damaging as ZIRP for years on end unless there is something else going on.
This post has outgrown its original scope and so it will be concluded now.
Bottom Line
The conclusion is that it does not matter what Janet Yellen babbled yesterday, the market is going to balance the sheet sooner or later. That balancing will either come through accelerating inflationary pressures already seeded into the system as the Fed is compelled to raise interest rates or it will come in the form of a deflationary clearing of distortions as inflated asset prices come back in line. The problem is, using the T Bill rate as a proxy, that line has been crawling along the floor for 5+ years now.
Financial markets promise to be very interesting during Ms. Yellen’s first year at the helm. Let’s keep our preconceptions and biases under control and gauge what is actually happening every step of the way.
Biiwii.com | Notes From the Rabbit Hole | Free eLetter | Twitter
About Gary Tanashian
About Biiwii.com
Gary Tanashian of biiwii.com successfully owned and operated a progressive medical component manufacturing company for 21 years, keeping the company’s fundamentals in alignment with global economic realities through various economic cycles. The natural progression from this experience is an understanding of and appreciation for global macro-economics as it relates to individual markets and sectors.
Along the way, a geek-like interest in technical analysis, a long-time interest in human psychology and various unique macro market ratio indicators were added to the mix, with the result being a financial market newsletter (and dynamic interim updates), Notes From the Rabbit Hole (NFTRH) that combines these attributes to provide a service that is engaged and successful in all market environments by employing risk management first, and opportunity for speculation second.

-
I know Mike is a very solid investor and respect his opinions very much. So if he says pay attention to this or that - I will.
~ Dale G.
-
I've started managing my own investments so view Michael's site as a one-stop shop from which to get information and perspectives.
~ Dave E.
-
Michael offers easy reading, honest, common sense information that anyone can use in a practical manner.
~ der_al.
-
A sane voice in a scrambled investment world.
~ Ed R.
Inside Edge Pro Contributors

Greg Weldon

Josef Schachter

Tyler Bollhorn

Ryan Irvine

Paul Beattie

Martin Straith

Patrick Ceresna

Mark Leibovit

James Thorne

Victor Adair