
Energy & Commodities
The first quarter is in the bag. While stocks managed to stay out of the red (barely) to end the first three trading months of the year, I continue to see more exciting setups in the commodities market…
That makes today the perfect opportunity to talk about some of the bigger trends shaping up so far this year in the commodities space…
“The palladium trade is down so far,” writes an anxious reader. “What is the timing where we should see a move?”
Well, let’s see…
Palladium has been volatile since its breakout in early March. Take a look:
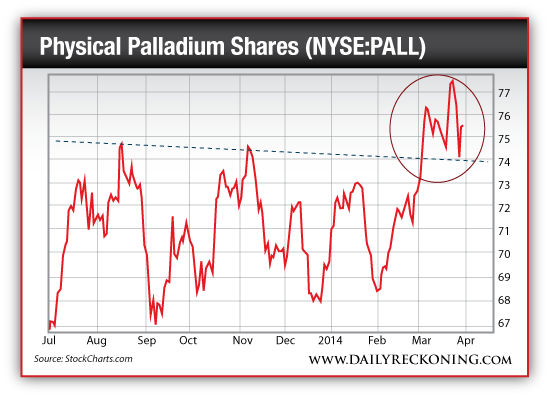
I’ve circled the post-breakout congestion in red. Despite the wild moves palladium has held above the breakout zone. That’s a bullish sign–and an opportunity to jump on this trade if you missed it a few weeks ago.
Ultimately, I think palladium will make a bigger move higher from here. Patience is key…
About Greg Guenthner
Greg Guenthner, CMT, is the editor of the Daily Reckoning’s Rude Awakening. Greg is a member of the Market Technicians Association and holds the Chartered Market Technician designation.

“I don’t want to belong to any club that will accept me as a member.”
– Groucho Marx
“In another world…”
– Angela Merkel on Vladimir Putin after a phone call in early March 2014
“This is my last election. After my election I have more flexibility.”
– Barack Obama to Dmitry Medvedev (remember him?), March 2012
“The truest wild beasts live in the most populous places.”
– Baltasar Gracian
“Those are my principles, and if you don’t like them …well, I have others.”
– Groucho Marx

….continue reading HERE
 Quotable
“In finance you are playing against God’s creatures, whose feelings are ephemeral, at best unstable, and the news on which they are based keeps streaming in.”
– Taken from Why Markets Crash, Didier Sornette
Commentary & Analysis
Euro Morphing Into the Old Yen—the Equation Says So
What if the euro is morphing into the old Japanese yen? The Japanese yen which continued to rally for years against other major currencies despite Japan remaining tightly in the bear-hug of deflation for over a decade and nominal rates at zero (ZIRP) for many years?
There is growing concern the Eurozone is falling into a Japanese-style deflationary trap as the headline inflation rate across the zone continues to decline. Many expect the European Central Bank will be forced to cut interest rates.
I’m not sure declining headline inflation should be a big surprise given the unleashed domestic deflationary powers of austerity in an effort to save the single currency regime. But one interesting aspect of this is the surprising strength of the euro even though the Eurozone is losing the yield and growth game to the United States.
I want to share with you an equation I took from George Soros’s book, The Alchemy of Finance, when I read it back in 1987; which is doing a pretty job of justifying the path of the euro.
↑ T – Trade Surplus
↑ N – Non-speculative Capital
↑ S – Speculative Capital
↑ e – Exchange Rate
1. The Eurozone is still sporting a nice trade surplus.
2. Non-speculative capital flow seems to be increasing as banks in Europe delever outside of Europe in order to bolster domestic capital.
3. Speculative capital flow into periphery bonds, turnaround assets, and buying bad debt (vulture funds) has been brisk, as international fund managers find opportunity across Europe.
4. Therefore, the exchange rate is rising despite what from the outside appears to a relatively bad economy.
Is it that easy? No.
Markets are full of rational and irrational beings; and those beings can quickly move through various stages of rationality when it comes to money decisions. So, if we consider a situation whereby irrational beings are participating and impacting on the outcome they are also attempting to forecast (Soros’ Theory of Reflexivity), you can see the difficulty in using equations to determine outcomes. It’s highly unlikely any Holy Grail-type equation will emerge until Chaos theory and computing power are much further advanced. (That’s a story for another day.)
Despite their limitation in predictive power, I do think equations play an important role as a framework for scenario analysis (I create my own homegrown equations to try to better understand money flow; all are flawed to one degree or another). In the case of the equation I shared above, even if it breaks down as a rationale for the euro, i.e. the euro tanks, I do think it is helpful for thinking about how much flow impacts a currency and can run contradictory to the usual consensus regarding headline GDP or levels of interest rates.
In retrospect, Soros’ equation was an excellent framework for understanding why the Japanese yen remained strong despite Japan’s dismal economic woes. At the moment, it seems to be doing a pretty good job of defining rationales for euro strength. But Mr. Draghi is back behind the microphone on Thursday; so stay tuned.
INTERESTED IN THE BLACK SWAN FOREX SERVICE ? IF YOU WISH TO SAMPLE THE SERVICE, JUST SEND US AS NOTE – HERE
Regards,
Jack Crooks
Black Swan Capital
Phone: 772-349-6883
….more
Gain an Advantage over 99% of U.S. Investors with this 15-Minute U.S. Market Report
Greetings,
Our friends at Elliott Wave International have just posted a concise new report that will give you an advantage over the herd.
It’s called the “15-Minute Nuggets Report.” It delivers some of the latest juicy nuggets from their most popular service for U.S. investors.
This report — only a couple of printed pages long — will give you the lowdown quickly. In a rapid-fire format, it presents roughly a dozen timely market insights for U.S. investors. No frills, no fuss. Just quick insights for investors who don’t have the time to sift through reams of investor reports.
Time is money. This report will save you time. The money-making is up to you.
Sincerely,
Jack Crooks
Black Swan Capital

- “Too many people know firsthand how devastating it is to lose a job at which you had succeeded and be unable to find another; to run through your savings and even lose your home.” –Janet Yellen, March 31, 2014.
- I’ve predicted that quantitative easing will be replaced with actions taken by the Fed to force commercial banks to increase lending.
- Dr. Yellen could put downwards pressure on interest rates by charging banks a fee to keep reserves with the Fed.
- That policy would force banks to buy longer term Federal government bonds, and to take more risk by making loans to businesses.
- Please click here now . Double-click to enlarge. The technical indicators on this monthly T-bond chart suggest that bonds could soon have a sizable rally. That should create a decent rally in gold.
- At this point in time, Fed tapering clearly isn’t much of a concern to bond market participants. In the longer term, T-bonds are probably forming a large head & shoulders top pattern. What are the implications of that pattern for gold investors?
- Well, a large head and shoulders top pattern doesn’t necessarily mean that America is in a situation like 1979, where interest rates skyrocketed.
- T-bonds could simply decline to the 110 area on that monthly chart, or even towards par (100), without creating significantly higher rates.
- I’ve predicted an uptick in money supply velocity will occur over the next couple of years. That could put enough inflationary pressure on bonds to move the price down to that 100 – 110 target zone. If that happened, a significant stock market correction is likely, but I doubt it would halt the general trend of weak economic recovery.
- A modest uptick in US inflation that creates only modestly higher rates, combined with rising demand for gold in China and India, should produce a consistently higher gold price for years to come. There’s more good news: It’s likely to occur with much less volatility than most gold market participants are accustomed to.
- Please click here now . That’s a shorter term look at US interest rates, using the daily T-bond chart. Bonds are drifting sideways in a loose rectangle formation, against a general fundamental background of Fed tapering.
- In both the short and longer term, the US bond market appears to be quite solid, which is generally supportive for higher gold prices.
- Gold itself has drifted lower over the past couple of weeks, after rising steadily for about two and a half months. From both a technical and fundamental perspective, I see nothing that should be a major concern for precious metals investors.
- On that note, please click here now . That’s the daily chart for gold. Note the position of the Stokeillator (14,7,7 Stochastics series) at the bottom of the chart. The lead line is now at about 8. I’m a light buyer here in the $1285 area, and a bigger buyer near $1270.
- While I believe the gold market is becoming more stable, investors should understand that the Indian election begins on April 7. That’s less than a week away. During Indian elections, citizens can only hold limited amounts of cash. That policy is designed to prevent bribery, but it also means that citizens can’t buy as much gold as they typically do on any given day.
- As a result, gold could just gyrate sideways in a rough range between $1270 – $1320 for a month or so, barring a major geopolitical or US economic event. Once the election is completed, I’m predicting a steady rise in Indian gold demand that will take the price towards $1390, and then up to $1430.
- While most gold analysts focus on the action of the US dollar against the euro as a gold price driver, the rising euro creates only limited US demand for gold. In contrast, a modest fall in the dollar against the Indian rupee can create enormous surges in Indian citizen gold demand. Please click here now . The dollar is clearly breaking down against the rupee, thereby increasing the amount of gold Indians can buy with their rupees. That’s bullish for gold!
- Like gold, the silver market appears to be becoming more stable. Please click here now . I’ve outlined a rough range that is possible for silver during and after the Indian election. To help understand the fundamentals behind my very bullish big picture outlook, please click here now .
- I expect the technological improvements in the Indian silver market to make silver jewellery much more competitive with gold, particularly amongst Western buyers. A rise in silver prices to just the $30 area would produce a 50% gain, for patient investors who can buy some silver now.
- Higher gold prices tend to produce exponentially higher gold stock prices. It’s unlikely that much excitement awaits gold stock investors for another month or so, but a head and shoulders top pattern may be forming on the weekly gold versus GDX ratio chart. That’s bullish for gold stocks, in the big picture.
- To view that key ratio chart, please click here now . Note the collapse in volume, and the disintegration in the RSI indicator. When the Western super-crisis theme dominated all markets, institutional money managers gravitated towards gold bullion more than gold stocks.
- I believe the potential top pattern forming on this chart is consistent with the transition from asset destruction (deflation) to inflation.
- More time is needed to complete the top pattern, but I’m confident that the institutional mindset of “growth with safety” is ending, and an era of “growth with inflation” is close to commencing.
- In April 2013, gold bullion appears to have begun a process of topping out against most gold stocks. I expect the process to be completed in 2014, and hopefully by this summer. From that point, a multi-decade period of general gold stocks outperformance against bullion should begin. When the super-crisis theme was on the front burner, gold market participants had to make very quick decisions that were often uncomfortable. The Western gold community is probably entering an era where gold stock investing is going to be much less stressful, and much more profitable!
Apr 1, 2014
Stewart Thomson
Graceland Updates
website: www.gracelandupdates.com
email for questions: stewart@gracelandupdates.com
email to request the free reports: freereports@gracelandupdates.com
| Tuesday Apr 1, 2014 Special Offer for Money Talks readers: Send an email to freereports@gracelandupdates.comand I’ll send you my free “Short Term Triggers!” report. While gold, silver, and gold stocks offer value at this point in time, investors can get frustrated waiting for a momentum-based move higher to commence. I’ll show you what set-ups I look for in key moving averages and oscillators that suggest upside “blast off time” is here! |

 Stocks have kick started this week with a 0.85% pop in price but the big question is if the market can hold up. Last week stocks repeatedly gap higher and sold off with strong volume telling us that institutions are slowing phasing out of stocks (distribution selling) unloading shares into strength and passing them onto the a average investor to be left holding bag.
I want to show you a couple charts which show the price action, volume and money flow of the SP500 so you have a visual of what I am talking about.
Get Report: http://www.thegoldandoilguy.com/sp500-etf-trading-strategies/
Chris Vermeulen


-
I know Mike is a very solid investor and respect his opinions very much. So if he says pay attention to this or that - I will.
~ Dale G.
-
I've started managing my own investments so view Michael's site as a one-stop shop from which to get information and perspectives.
~ Dave E.
-
Michael offers easy reading, honest, common sense information that anyone can use in a practical manner.
~ der_al.
-
A sane voice in a scrambled investment world.
~ Ed R.
Inside Edge Pro Contributors

Greg Weldon

Josef Schachter

Tyler Bollhorn

Ryan Irvine

Paul Beattie

Martin Straith

Patrick Ceresna

Mark Leibovit

James Thorne

Victor Adair