
Gold & Precious Metals

It’s getting increasingly difficult to survive out there these days for everybody except the top .01% and few of their buddies, which is not what Ayn Rand had in mind when writing on the benefits and attributes of individualism, to both the individual, and society as a whole. Of course Ayn was no stranger to the vulgarities associated with cronyism and oligarchs with her Russian origins, however she would likely be dismayed at what has happened to America today, a place she loved for what it stood for, not what it has become. What’s worse, it appears the John Galt’s of the world are becoming fewer and far between as process continues to unfold, but it could be argued she saw this coming, being the forward thinker she was, a realization perhaps best captured in her magnum opus, Atlas Shrugged, a must read for all concerned with these ideas – a fruitful life, liberty, and freedom.
As with all extremist / fascist episodes through history however, all good things must come to an end when people can no longer live with compounding inequalities, especially when they begin to tread on the most basic of human rights and privileges. The oligarch’s and their dogs (think Animal Farm) found out about this in Nevada a few weeks back when a prominent pigwas thwarted in attempting to effectively confiscate Cliven Bundy’s cattle and ranch, which still might be a problem, but at least the revolution has begun. It’s time for greedy and corrupt politicians to be put in their place. So let’s hope Alex Jones is right (this time), and this proves to be a watershed event, where formerly complicit bureaucrats begin to recognize the errors of their ways, and begin working for the people once again increasingly, not crooked oligarchs and their dogs.
A more profound (but abstract) example of this is Russia’s defiance regarding Western claims to the Ukraine (under the guise of diplomacy), where the previously vanquished evil doers (think the fall of the Berlin Wall) have also turned the tide in terms of the level of abuse and fraud present evil doers have been getting away with (think artificially low pricing of oil and gas sold to the West), as explained in detail several weeks back in my article entitled “Take That Ivan”. To summarize, the idea here, from a completely impartial perspective, is Russia woke up to the fact Western commodity markets are rigged to suppress prices so that consumers would have more disposable income in their budgets to pay bankers ever-increasing amounts of interest payments, which angered them. So, Ivan, being on the receiving end of Western oppression for some time, waited patiently until it was the right time to fight back, allowing the West to weaken itself into the debt laden stupor that now exists.
So essentially, the world has become Atlas bearing all this debt, and recent developments concerning Russia (viewed by most as a weak periphery adversary to be exploited [for its natural resources] prior to more recent events), like that recommended by d’Anconia – the shrug. And Russia, nor its allies, will cease the decentralization process now because it’s in their best interest(s) to do so, forging new alliances that will eventually bring Western living standards in line with true economy (proper market commodity prices), led by the US, which has the biggest fall coming. Here, the loss of the petrodollar, and reserve currency status for the dollar($), will cause significant price inflation in America (the world) the likes of which not witnessed in the global core economy since Rome. A weakened Anglo-American banking structure will ensure such outcome, as money printing will need to continue accelerating, which will be the catalyst for a decentralization / regionalization process (look at this item just in) that will become the new macro defining global geopolitics moving forward.
No more will it be a one super-power world populated by a bunch of idiots running around the globe like they own it. A country, and its currency, will actually need tangible wealth to back it, recognized by trading partners as ‘hard money’, not the ‘fluffy fiat’ stuffed down throats now at gunpoint. The Chinese are definitely ‘on board’ with this thinking in accelerating the rate at which they are converting American paper to all things tangible, not to mention beefing up their military. And of course US authorities know of their weakened economic position, which will allow process to continue along these lines until the world geopolitical / economic landscape is a very different place five-years from now, whether we arrive there amenably, or not. First the economics of war heats up as budgets and the populous become strained. Then, larger scale conventional wars appear unavoidable in order to keep the mob(s) distracted. If recent events surrounding the Ukraine are any indication – stay tuned in this regard – things are getting tense.
That being said, the question does arise, if this is all true, that East is at war with the West over economy, is there a manner to measure this in the financial markets to see who is winning? As a matter of fact, there are many different ways in which to measure this in the financial markets, and past body counts, with a plethora of ratios at our disposal. So please, let me tell you a story using a subset of these ratios, and then you can make up your own mind ‘who is winning present battles’; and, ‘who will likely win the war’.
The first ratio I would like to start with is the Dow / Gold Ratio (DGR) because it’s disposition creates controversy – that the West may still be in control. How could this be if the West is weak, as espoused above? Answer? Faulty and fraudulent markets; and, desperation. Long time readers of these pages will know my thoughts on Western pricing mechanisms (markets) from my sentiment based studies, that they based on sentiment and speculator betting practices in the derivatives markets, and not supply and demand. Therein, and as it pertains to gold (and especially silver – see below), Western bankers pay special attention to the monetary metals because of the message(s) they throw off to the public, the barometer of economic conditions, with rising prices indicating stress, and falling prices signaling ‘everything is just fine – so keep buying our financial assets – especially our bank stocks’. (See Figure 1)

What’s more, the DGR is the most commonly followed definer of Wall Street’s health, so not only is the structure of the pricing mechanism flawed via computerized sentiment based biases; but also, various strata of ‘prop desks’ exist to apply ‘grease to the wheels’ (liquidity) when needed, led by the New York Fed’s operations. This means everything within the West’s vast bureaucratic powers is done to prop up financial assets (and suppress gold) because of perceived positive multipliers that keep the party going in good times, which is all the time now apparently. (i.e. because of fiat currency economy related diminishing returns, Western authorities have attempted to eliminate the business cycle.) And conversely, everything within their powers is also done to suppress gold of course, the barometer of barometers, because when it’s going up a signal regarding future and currency debasement rates is being thrown off, which is counter to ‘Western interests’. This is why the West would like to see the DGR go to new highs again, because in terms of heating up wars, it would be saying ‘take that again Ivan’; and, China, ‘you better think twice before you stop buying our paper’. (See Figure 2)

Along this line of thinking, you may remember me talking about the importance of the S&P500 (SPX) / iShares Silver Trust (SLV) Ratio because Western bankers use silver to help suppress gold; and, they use silver because it’s market is smaller and more regionalized, so it’s easier to manipulate. This is why, unlike the DGR, the SPX / SLV Ratio will probably push to new highs soon before seasonal weakness in stocks kicks in. Such an outcome could involve a move to 106 as mentioned previously, a Fibonacci resonance target (not shown) that would see silver get hit to the downside one more time. And sure enough, based on the price action over the past few days, this appears to be the prescription. Based on post expiry open interest put / call ratio distributions, which you can review here, stocks should see modest gains in the next little while, leaving a declining silver price to do most of the work in pushing the SPX / SLV Ratio up to our 106 target. Thus, our assertion last week the best stocks should do into this period of seasonal strength is see a double top at 1900 on the SPX appears to be a reasonable assumption; and, in following up on our assertion above this will also be marked by a reversal of capital flows from financial assets to commodities, from West to East in measurable dimension if you will, expect to see the head and shoulders pattern on the Dow / CCI Ratio pictured below to be triggered soon as well. (See Figure 3)
And it appears Western bureaucrats are in fact ‘hell bent’ on provoking the East into something more here, perhaps thinking things will be ‘OK’ if we only strategically attack high level bad guys, where the charts, and more specifically, the above, is telling us such thinking is misplaced. Because if the head and shoulders pattern in the Dow / CCI Ratio traces out, the result will take its toll on their precious stock market. As discussed previously, Russia has been waiting patiently to make this move against the West in order to get control of (up until now) improperly derived commodity pricing via faulty and fraudulent North American pricing mechanisms. Because doing so will get them ‘back in the black’, and out from behind the Western eight-ball of ever increasing debt that keeps the surfs slaves to bankers indefinitely.
It’s war you know.
Making the job easier for the East, and Russia in particular, is the fact the West is in such bad shape in every respect you would like to discuss – fiscally, economically, and morally – making breaking the spirit of the average (spoiled rotten) individual in the West more likely when pressure is applied. It’s either that or the citizenry snaps, and starts beating corrupt bureaucrats to death. If Atlas has shrugged in this respect in the West, again, perhaps marked by the Bundy incident (bigot that he is), which appears to be catching on, then we could have a rodeo on our hands moving forward.
The above was commentary that originally appeared at Treasure Chests for the benefit of subscribers on Tuesday, April 22nd, 2014.
For the rest of the story, please visit our site and subscribe.

Back in 2003, after repeated urging from Don Coxe, the formerly great (but now irrelevant) visionary, we began following Canadian Oil Sands (OTCQX:COSWF)(COS.TO) which was then a Trust and now a Corporation.
We bought heavily. We also became investors in several Oil Sands companies, including Suncor, and actually visited the Oil Sands area – at one point a client was the 2nd largest shareholder in a nearby Oil Sands project. By the time we sold COS in 2008 the shares had peaked at over $60 and our cost basis, thanks to the fat dividend, was actually below $0. We like that.
However, we have never re-purchased COS and we suggest serious potential investors take a peek at this note as there appears to be some confusion:
1. Syncrude is bitumen. When an author writes “Syncrude does not suffer from a heavy discount that plagues Western Canadian oil or bitumen” it throws into question the entire analysis, for us at least, since (of course) Syncrude mines low-quality bitumen and then runs it through its $6 billion “upgrader”, in order to produce a pure synthetic crude. This is a capital-intensive and very expensive process which explains why bitumen producers only get in the $50 per bbl. range.
2. COS is a high-cost producer. If there ever is a glaring ‘red flag’ in a company’s presentation, it’s when there exists not one single slide showing actual revenue and net earnings figures, anywhere. The company makes you dig for the numbers instead. In this regards, COS doesn’t disappoint, using plenty of other ‘stuff’ highlighting its “compelling valuation to new mining projects”.
Maybe we are a bit cynical, but that only tells us: “we’ll go broke slower”.
Dig a bit deeper and you will see, for example, that in 2005 net Revenues were $1.93 Billion and net Earnings $831 million (all in $C). Then, by 2012 net Revenues had jumped 91% to $3.7 Billion – thanks to much higher oil prices. So one would logically expect a commensurate increase in net Earnings, however, they came in at an underwhelming 15% increase to $957 million, a significant underperformance. With flat production, we would expect higher oil prices to mean higher profits. Reasonable?
What happened is that costs exploded. Yes, COS does benefit as they own a big-ticket “Upgrader” which adds value over the competition, and Syncrude does get near WTI pricing, which runs at about a $25 premium to bitumen. Yet overall, production costs are still very high.
The only per barrel cost hinted at in the COS presentation is a slide showing EBIT – at $105 oil – with costs running close to $70 per bbl. With COS stating they are seeking to go to $1.5 Billion in long-term debt by 2015, expect further increases in total per barrel cost. Our question is: if costs are going to drop after the big Capex program is completed, why wouldn’t they highlight this in the presentation? It’s not there.
3. WTI prices are going lower. We don’t pretend to be oil price forecasters, but one reliable ‘tell’ of long-term price trends, over the years, has been the oil futures curve. Presently, while February WTI trades at $92, WTI 2 years out sells for $82, 3 years out at $78 and 5 years out it is at $75. There seems to be a trend here, one that does not favor folks expecting a continuation of COS’s 7% dividend yield.
The shift in the WTI futures price curve began this past summer, and we believe it is a quantum, generational, shift brought on by the ‘shale revolution’. Normally, WTI trades at a significant premium in the future – since someone wishing to purchase oil today, at a fixed price, but take delivery 5 years later, should reasonably expect to pay somebody to store all that oil. It varies, but we will say the premium usually runs around $15.
The significance being that 5 years from now, if the futures today are selling for $75, then the market is expecting spot WTI in 2018 to sell for $60.
If so, that’s going to be a bit of a problem for COS and other high-cost producers. Nobody can say for sure, but “price is truth” and anyone considering an investment in COS had better look at the long-term fundamentals and pricing trends.
4. Old technology. While most newer shale producers have a chance to reduce costs via improved technology, COS is going to remain a mostly old-style open pit mine, mined by men with shovels and trucks, big ones indeed, but still capital and labor intensive, with few opportunities for major cost improvement. Since COS talks up their refining capacities, we think investors may be better off looking at them as a more-volatile refiner than a steady, long-life producer.
5. COS management has consistency over-promised but under-delivered. One of the nice things about getting older is you get a chance to look back over many years and see how a company’s guidance works out. We have with COS and have spoken directly to management in the past. We have found them “disappointing”.
This is, naturally, our subjective opinion, and perhaps this time it will be different, but then we are always reminded of the classic “Peanuts” gag where Lucy promises, but then pulls away the football from Charlie Brown. He never seems to learn. We try to.
Hey, I though oil was still near $100?

Final note. I predicted, back in 2003, that Warren Buffett would, one day, invest in the Oil Sands, reasoning such because of the 40-year plus reserve-life index. He finally did buy in 2013… but that was before the dramatic change in the oil futures curve. I would wait to see if he keeps buying.

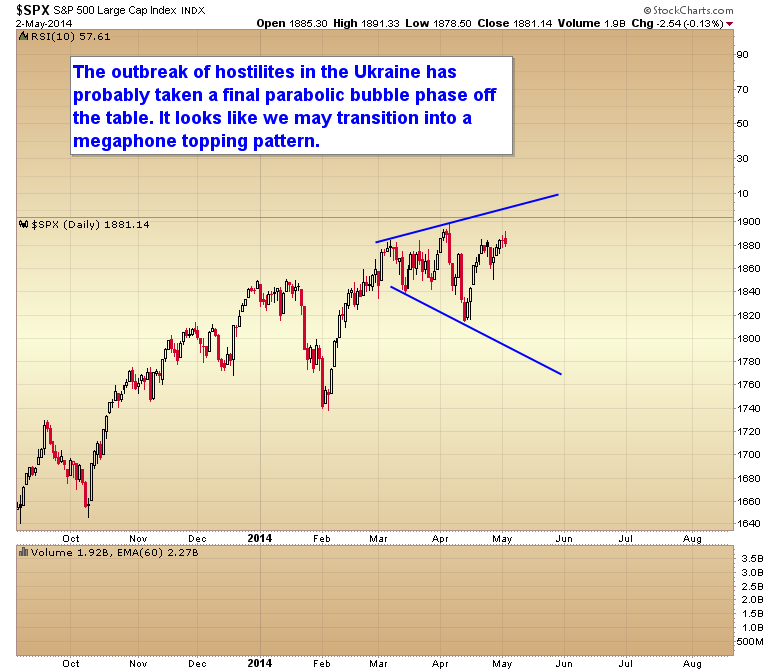
So far my 2014 expectations are playing out pretty much as planned, with a few adjustments. With the threat of war in the Ukraine I think the final bubble phase in stocks is now off the table. I doubt we can get the euphoric buying pressure necessary to generate a parabola as long as tensions in Eastern Europe continue to escalate. No bubble phase in stocks = no capitulation phase in gold. The Ukraine event was a game changer.
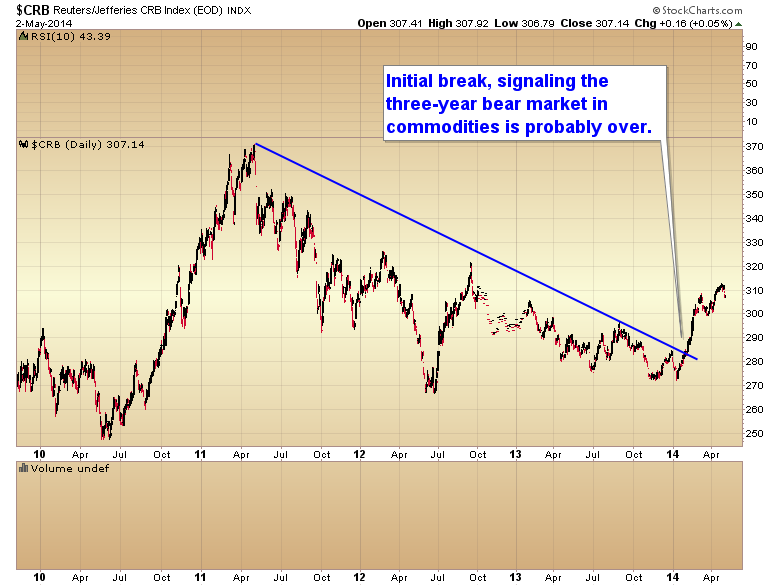
Just to refresh, I predicted we would see an initial rally in the commodity markets during the first quarter, followed by a corrective move into early to mid-summer. Once that corrective move was finished I’m expecting a much more powerful rally in the commodity markets during the second half of 2014.
The initial rally arrived right on cue as the CRB broke through its three-year downtrend line during the first quarter.
I’m pretty confident commodities have now begun that corrective move that I was expecting in early summer. As oil is the main driver of the commodity complex, and it led the CRB out of the 2012 three year cycle low, it is now leading the CRB down into that summer correction.
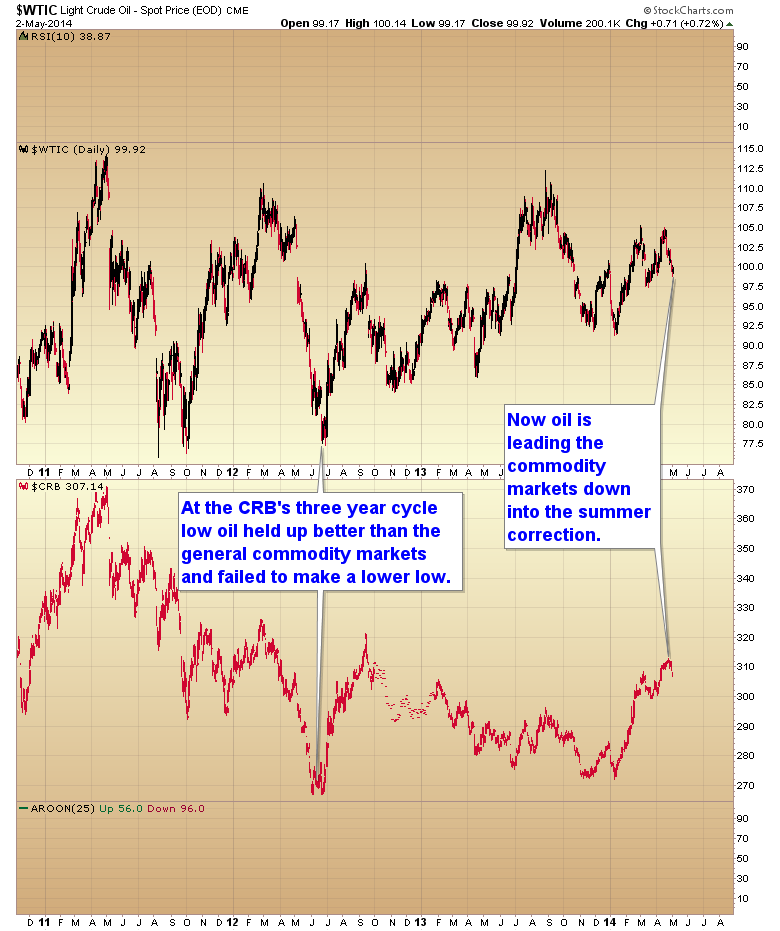
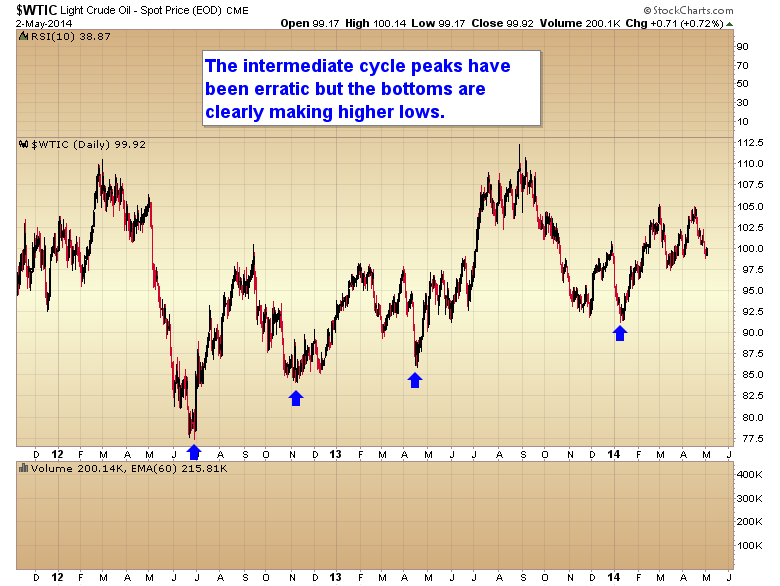
While the intermediate tops have been erratic over the last three years with no clear pattern, the intermediate bottoms are clearly making higher lows signaling that the three year cycle is still advancing.
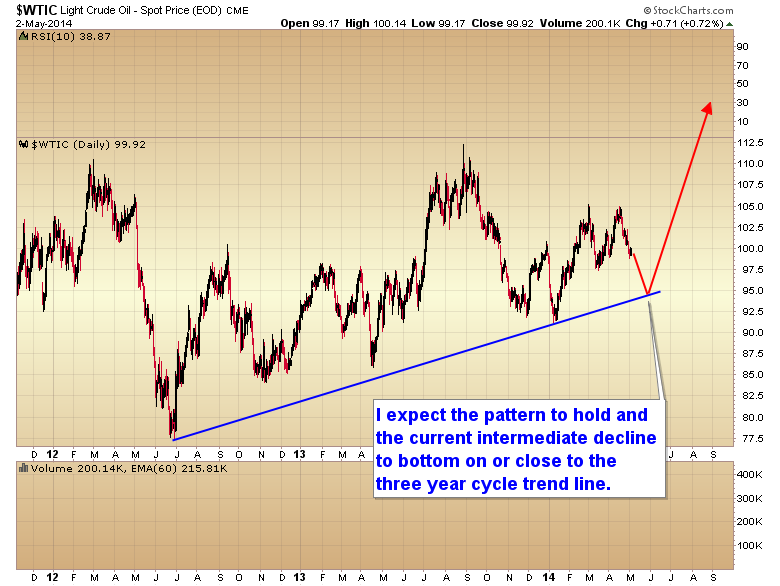
While we may get a countertrend bounce early next week I’m not looking for a final intermediate bottom until oil tests its three-year trend line sometime in the next 3-5 weeks.
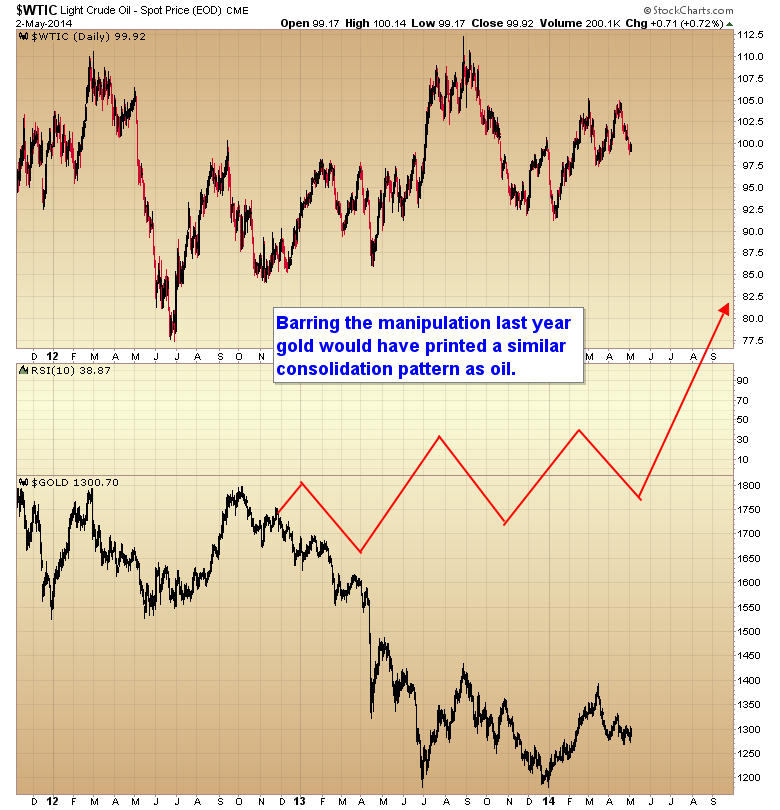
Barring the manipulation in the metals market last year gold would have printed a similar consolidation pattern as oil. And now that the three-year bear market in the commodity sector is coming to an end the precious metals should also participate during the powerful rally that I foresee for the second half of the year.
Just a little more patience is called for as I don’t think the summer correction in commodities or the precious metals is finished just yet, although I do expect the metals to bottom slightly ahead of the rest of the commodity markets.
Considering the damage that has been done to the physical market by the manipulation last year I believe the biggest gains during the second half of the year will come in the metals and I think traders will get an opportunity in the late May or early June to enter long positions in preparation for the resumption of the secular bull market.
To sample the premium newsletter consider clicking on the subscription button at the top of the GoldScents home page and try a one week trial of the premium service that includes daily and weekend market updates.
 Equity markets on Friday provided no indication that the April jobs report exhibited the best growth in payrolls since January of 2012, or second best since the US escaped recession in mid-2009. With payroll numbers as strong as reported, which showed a net 288 thousand American’s finding work, the expectation would be for swift gains in the equity markets, and given the negative correlation witnessed between gold and equities in the last 12 months, gold to sell off. Even though some negatives can be found with Friday’s report, the broad based strength would expect for a rally in risk assets to ensue. And given that was not the case, it begs the question of whether equities remain in correction territory.
It’s important to highlight the positives in Friday’s numbers because there is without question evidence that the US labour market is strengthening, and it is at a result of the efforts of the US Federal Reserve. Of the 288 thousand payroll positions added, 273 thousand came from a strengthening private sector. The remaining 15 thousand came from a government that has somewhat consolidated following the forced sequester and budget cuts. Therefore, it continues to suggest that those that have the skills to move back into the labour force and will be able find work. That, however, is not so much the concern.
The concern remains that the US Federal Reserve won’t be able to find a solution for the record 92 million Americans who are not represented in these upbeat job numbers. The labour force participation rate is at its lowest level since February of 1978. That translates to the largest share of the American population not to participate in the job market in 26 years. And there is a continuing debate and contribution of academic research that attempts to pinpoint why the participation rate is dropping, particularly when policy goals would be for it to move in the other direction. But there is not a concise explanation of whether it is at the result of an aging population seeing more retirees, or discouraged workers who are fed up looking for work and lose hope.
This begs the question of whether this dichotomy in the American economy between those who are able to find work and those who are not can only continue, and perhaps worsen. Job creation through the first four months of this years has averaged well over 200 thousand positions a month, which are strong numbers even accounting for the extreme winter conditions expected to stall the economy. Even initial estimates for Q1 GDP (reported last Tuesday) are being forgotten as expectations are for them to be revised higher as a plethora of evidence shows the strength of American corporations and consumers. But then looking at the markets, why aren’t they once again taking out their all-time highs?

-
I know Mike is a very solid investor and respect his opinions very much. So if he says pay attention to this or that - I will.
~ Dale G.
-
I've started managing my own investments so view Michael's site as a one-stop shop from which to get information and perspectives.
~ Dave E.
-
Michael offers easy reading, honest, common sense information that anyone can use in a practical manner.
~ der_al.
-
A sane voice in a scrambled investment world.
~ Ed R.
Inside Edge Pro Contributors

Greg Weldon

Josef Schachter

Tyler Bollhorn

Ryan Irvine

Paul Beattie

Martin Straith

Patrick Ceresna

Mark Leibovit

James Thorne

Victor Adair