
Timing & trends
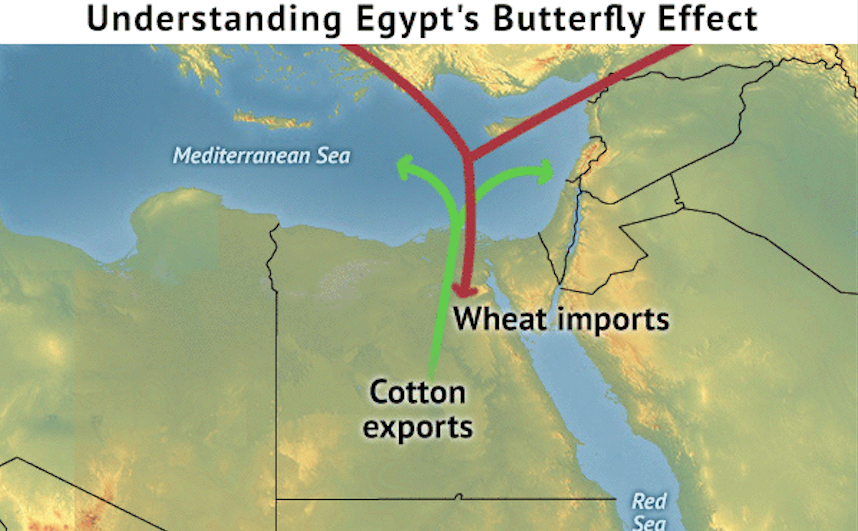
Understand how Egypt’s constraints will affect the rest of the world
Gain a deeper understanding as we consider these important questions:
- What options will Egypt’s new president have to improve the country’s precarious financial situation? And how might the price of bread impact his longevity in office?
- How could politics in Cairo impact the global shipping industry, which routinely makes use of the strategic Suez Canal?
- How will Egypt, which is focused on its core as it struggles through the transition to democracy, ensure that the Sinai Peninsula does not become a safe haven for jihadists – and what will happen to the peace treaty with Israel if Cairo fails?
- How does Cairo’s approach to the Muslim Brotherhood make allies or enemies of neighboring states in North Africa and the Middle East?
- What might be the implications for Egypt’s future if a military-backed president can’t deliver on promises for the common good?
Presidential campaigns are in full swing in Egypt, where voting is scheduled by the end of May. It’s widely expected that the recently retired military chief, Field Marshal Abdel Fattah al-Sisi, will sweep to a landslide victory over his sole (and many say nominal) challenger – thus keeping the Egyptian military firmly in control of the government.
But even if there are no surprises at the ballot box, Egypt’s next president will have to walk a careful line, with little room to maneuver. In this country – the pivot of the Arab world – politics are not strictly local. The rest of the Middle East – and the world – will be watching the next steps in Egypt’s long journey with interest.
Stratfor
About Stratfor
At Stratfor, one of the things we study is the “butterfly effect:” the ways that political, economic and security developments, which often start as small, almost imperceptible shifts, can grow and ripple outward – impacting people, companies and industries far from the initial event. Our analysts make it their business to track and write about the small but meaningful events around the world, focusing on motivations, constraints and implications for the future.
Learn more about Egypt’s “butterfly effect” and who is likely to be touched by it with a Stratfor subscription. Get one year of complete access at 63% off and get The Next 100 Years, by Stratfor founder and chairman George Friedman, for free.

For the next six months maybe cash is the most attractive asset, predicts Marc Faber, The Gloom, Boom & Doom Report, citing Yellen as a “money printer,” which Faber says depreciates the U.S. dollar.
the most underappreciated asset is cash. nobody likes cash. cash for the next 10 years you earn precisely zero. ms. yellen is a money printer like all the others. and she will make sure that the dollar continues to depreciate in real terms. for the next six months is the most attractive. i don’t want to be in cash
 Marc Faber is an international investor known for his uncanny predictions of the stock market and futures markets around the world.Dr. Doom also trades currencies and commodity futures like Gold and Oil.

Sell in May and go away?
We Fools know to ignore such nonsense. For those of us looking to accumulate wealth by investing in equities for the long term, May is just as good as any other month to put our hard-earned savings to work.
In our members-only Stock Advisor Canada service, we’re not taking the summer off. In fact, in less than one week (next Wednesday, May 14), we will release our next two official stock recommendations.
The two fully vetted companies that are on tap, one Canadian- and one U.S.-listed, represent the best ideas for new money that our team of four Stock Advisor Canada analysts have right now.
If you want access to these two brand-new ideas, and the 14 recommendations we’ve brought our subscribers thus far, as well as a plethora of other tools that make this much more than just a “stock-picking service,” click here now to be taken to our sign-up page.
To help tide you over until next week’s release, this week’s Take Stock is dedicated to ensuring that you saw the recent collection of stock ideas put forward by our team of Fool.ca contributors. We asked the team to pick their favourite Canadian stock ideas right now. Here’s what they came up with:
Robert Baillieul: Inter Pipelines (TSX: IPL)
I doubt you’ve heard of this company. Though it’s not a consumer-facing name, this stock might become one of your favourite names on this list.
Inter Pipeline operates 6,400 kilometres of oil and gas pipelines as well as several massive storage facilities in Western Canada and Europe. We love these types of assets here at The Motley Fool because they tend to have long lives and face limited competition. Once built, they can be like a toll road, generating steady profits year after year, which, generally speaking, can allow a company to return ample cash to shareholders in the form of dividends.
Today the stock yields 4.3% and has increased its payout 10 times over the past decade. And in my view, thanks to Alberta’s booming oil production, investors should be able to count on more dividend hikes for decades to come.
Fool contributor Robert Baillieul has no positions in any of the stocks mentioned in this article.

Benjamin Sinclair: MEG Energy (TSX: MEG)
MEG Energy is a pure-play heavy oil producer in Alberta. The company’s production, and most immediate growth prospects, come from Christina Lake, which I believe to be a very high-quality asset. As a result, MEG is one of the industry’s lowest-cost producers, with net operating costs of only $10 per barrel.
MEG is growing aggressively, with plans to more than double 2013’s daily production by 2015. With what I believe to be such a quality asset, MEG’s high growth should create tremendous value for shareholders, especially if transportation bottlenecks continue to weaken. As a bonus, MEG trades at only 1.05 times the present value of its proved reserves.
Fool contributor Benjamin Sinclair owns shares of MEG Energy.

Neha Chamaria: PotashCorp (TSX: POT)(NYSE: POT)
PotashCorp’s recently released first-quarter numbers and outlook should be enough to pique any investor’s interest now.
The company’s Q1 numbers not only beat Street estimates, but the company also improved its guidance for 2014, encouraged by improving fertilizer market fundamentals. PotashCorp’s order flow into the second quarter remains strong, with the U.S. spring planting in progress and the Brazilian season nearing. Meanwhile, PotashCorp is also on track to cut potash costs by $15-$20 a tonne this year, which should further boost margins.
PotashCorp increased its quarterly dividend by 25% in 2013, and its stock currently sports a juicy dividend yield of 3.6%. Given that the company generated greater free cash flow year over year in the first quarter, I’m not ruling out another dividend hike.
These factors, coupled with rumours of BHP Billiton eyeing PotashCorp yet again, should encourage investors to watch the fertilizer stock closely.
Fool contributor Neha Chamaria does not own shares in any of the companies mentioned at this time. The Motley Fool owns shares of PotashCorp.

Matt Smith: Parex Resources (TSX: PXT)
My top stock idea this month is small-cap oil explorer and producer Parex Resources, which operates predominantly in Colombia. Over the last year the company’s share price has spiked a massive 158%, but despite this significant gain I believe there are a range of catalysts that could drive its share price higher.
The company is targeting significant growth in oil reserves and production through an aggressive acquisition program. Coupled with solid organic oil production, I believe these moves should significantly boost Parex’s financial performance.
First-quarter 2014 oil production was a record 18,245 barrels daily, a healthy 7% increase quarter-over-quarter and a massive 28% year-over-year. Second-quarter 2014 production is expected to grow 3% to 6% compared to the first quarter, which is 19,000 to 19,500 barrels of crude daily.
With Parex’s oil pricing benchmarked to Brent, any significant growth in crude production should continue to boost its financial performance and ultimately, in my view, its share price.
Fool contributor Matt Smith does not own shares in any of the companies mentioned.
Karen Thomas: Nuvista (TSX: NVA)
In my view, Nuvista is in a very attractive spot right now, experiencing accelerating netbacks along with low-risk, repeatable increases in production. Nuvista’s focus on natural gas is working for the company at this time, as natural gas prices have been strengthening. With natural gas inventory levels 50% lower than the five-year average, this trend should continue to strengthen.
Nuvista is focusing on the Montney in Alberta for its superior economics and in response to the strength in natural gas liquids pricing. The economics of this area look quite attractive. Nuvista has seen average internal rates of return of over 50% in this area.
Looking ahead, the company is confident that it will achieve overall annual production growth of 25% through 2015, and is spending in order to expand its infrastructure to ensure that production can access the market.
The company’s balance sheet is healthy, production and cash flow are growing at very strong rates, and with natural gas and natural gas liquids pricing on the rise, I believe the future looks bright.
Fool contributor Karen Thomas owns shares of Nuvista.
Nelson Smith: Empire Company (TSX: EMP.A)
Shares in Empire Company hit a fresh 52-week low in April, selling off in part because of disappointment from Sobey’s quarterly results. The company is experiencing some growing pains from its $5.8 billion acquisition of Safeway’sCanadian operations, which seem to be temporarily keeping the stock down.
Once the company irons out the kinks, I believe it’s positioned to be a true Canadian retail powerhouse. It has already flexed its might with suppliers, stating any prices increases for 2014 wouldn’t be accepted. Even though Sobeys is a true national competitor to Loblaw, it currently trades at a significant discount to its peer. In my view, shares should perform well once results get a little better and investors start warming up to the name.
Fool contributor Nelson Smith does not own shares in Empire Company.

Justin K. Lacey: DIRTT Environmental Solutions (TSX: DRT)
My top stock idea for May is DIRTT Environmental Solutions, a manufacturer of fully customizable interiors for various industries, including corporate, government, education and healthcare.
The key to DIRTT is its proprietary 3D technology software, “ICE,” which it developed to eliminate human error, reduce waste, and provide a more efficient method for designing, constructing and installing building interiors. After a lackluster start to life in the public markets, DIRTT has found its footing, and is up nearly 20% since its IPO in November 2013.
The market opportunity is significant – the U.S. non-residential construction market is estimated at approximately U.S. $570 billion. But with this small-cap stock, investors should expect a high degree of volatility as well.
Fool contributor Justin K. Lacey owns shares in DIRTT.

Matt DiLallo: Brookfield Property Partners (TSX: BPY.UN)(NYSE: BPY)
I believe Brookfield Property Partners offers investors a compelling combination of income and value. The global real estate owner pays a very generous distribution of more than 5%. On top of that the units are selling for a discount of about 20% below the net value of the company’s real estate assets.
That combination of income and value, when combined with the company’s organic growth opportunities just within its current portfolio, should yield above-average long-term returns. In fact, Brookfield Property Partners is confident that it can organically grow its value by 20% annually through 2018.
Add the company’s long history of accretive acquisitions and, in my view, Brookfield Property Partners is the one Canadian real estate company to buy.
Fool contributor Matt DiLallo owns shares of Brookfield Property Partners.
Michael Ugulini: Peyto Exploration & Development (TSX: PEY)
Peyto Exploration & Development engages in the exploration and development of high-quality gas properties. It is a producer of unconventional natural gas in the Deep Basin of Alberta.
I’ve held shares in Peyto for almost 10 years now. As an income investor I like the regular monthly dividends. In mid-April, Peyto confirmed dividends for the second quarter of 8 cents per common share for the record dates of April 30, May 31, and June 30, 2014.
Regarding its assets in its geographically focused core areas, 97% are processed by the company and 99% are operated by Peyto. The company has a 97% interest in nine processing facilities. It has 425,000 net acres and 900-plus producing zones in these core areas.
Fool contributor Michael Ugulini owns shares of Peyto Exploration & Development.
The Foolish Bottom Line
Many thanks to our contributors for putting forward this diverse collection of ideas!
If you’re thirsty for more ideas, this is just the tip of the iceberg. When you become a Stock Advisor Canada member, you’ll get two, fully researched stock ideas per month (one from the Canadian market and one from the U.S.), delivered to your inbox every month.
And as I mentioned, this is more than just a “stock-picking” service. In addition to these stock recommendations, our members also receive Weekly Updates that keeps them up to speed on all our scorecard companies, access to our members-only Discussion Boards, the ability to participate in our online analyst Town Hall live chats, and more. For more information on how to sign up, see the ad below. Can’t wait to have you on board!
Sincerely,
Iain Butler
Chief Investment Adviser
Motley Fool Canada
P.S. Don’t miss out — next Wednesday, our premium Stock Advisor Canada service is publishing our #1 TSX and #1 U.S.-listed stock for new money! Right now, you can sign up to join Stock Advisor Canada and pay just $99 — a rate 67% OFF the usual retail price ($299). To get started, click here now.

Last week we speculated that a decline in May would create an opportunity. We concluded: The near term prognosis looks cut and dry. Until proven otherwise the short-term trend is down. If that is confirmed in the coming days then let these markets fall to strong support before buying. The Ukraine-induced alleged safe haven bid for Gold could be starting to come out of the market. Regardless of the cause, the charts for the miners (and Gold) continue to urge caution as lower prices are likely ahead before the next major turn.
GDX and GDXJ (shown below) have had a very weak respite since the end of March. Both markets failed twice at their 50-day moving averages. The second failure occurred a few days ago at now declining 50-day moving averages. The markets reversed before even touching the moving averages. The path of least resistance is definitely lower.
Click image for larger view.

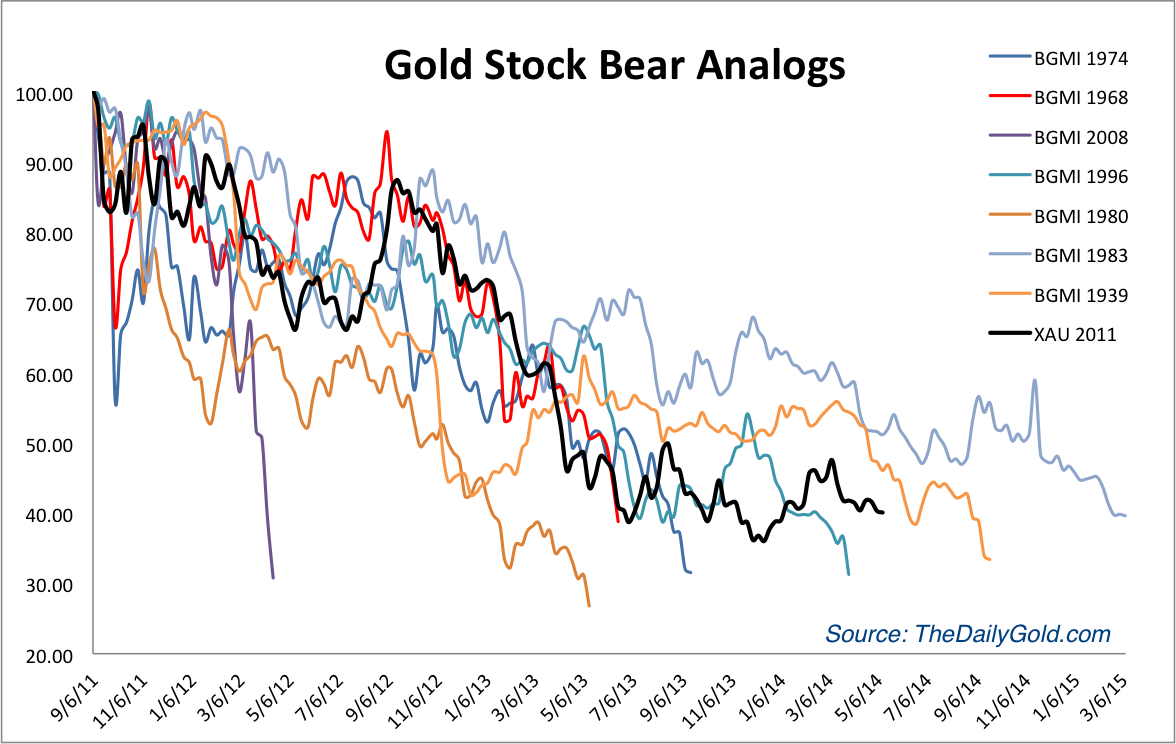
We strongly believe the next low for GDX and GDXJ will occur at or very close to the December 2013 lows and it will be a major low, similar to the June 2013 and December 2013 lows. Its presumptuous to say but not when you take into account the next chart, which many of you have already seen. This chart helped us spot the last two major lows. It may not tell us where the next low will be but it strongly argues that the next low will likely be the final low in this arduous bottoming process which is already in its 11th month.
Click Image for larger view:
So how could this next bottom play out? No one knows for sure but we’ll take a stab at it in this next chart and point out a few things. Note how the 200-day bollinger bands were far apart when GDXJ first peaked in 2011, yet tightened before GDXJ began to breakdown. Currently, the 200-day bands are far apart and GDXJ is yet to touch either side. Perhaps GDXJ will touch the lower band next and then a months later touch the upper band. These bands will need to pinch in before GDXJ attempts a major breakout. Volatility continues to be low as demonstrated by the ATR indicator. It is declining and near a multi-year low. Until that reverses, don’t expect any huge breakout in GDXJ.
Click Image for larger view:

With respect to our projection, let’s keep in mind that GDXJ rebounded 59% in two months in summer 2013 and recently surged 53% in less than two months (from late December to mid February). Our past historical work shows that the large cap miners usually recover 50% in four to five months after the bottom. Hence, a move for GDXJ from 30 to 50 (more than 50%) in four to five months would be inline with historical tendencies.
One security I am looking at is JNUG the 3x long GDXJ ETF. This is essentially an option on the already volatile GDXJ. JNUG is super volatile but the upside potential is tremendous. During that less than two month period in which GDXJ surged 53%, JNUG returned 210%! I am looking to buy that in the coming weeks when the downside risk becomes very low. I am also looking to buy several juniors I believe have exceedingly strong upside potential over the coming quarters and years. In any event, be patient over the coming weeks and let this final selloff run its course. If you’d like to know which stocks we believe are poised to outperform after this next low, then we invite you to learn more about our service.
Good Luck!
Jordan Roy-Byrne, CMT
Jordan@TheDailyGold.com

We had a bit of a scare in the markets last month. At one point, the S&P 500 fell more than 4%, causing some permabears to proudly proclaim that the “bubble” had burst.
Of course, they’re not quite so vocal now that the market has rebounded and is back within 1% of its all-time high.
As you know, we’re not market timers at Investment U and The Oxford Club. But I believe this market has a long way to run before the bulls stop making money.
Market History
Although this bull market is getting mature, it is not ready for the rocking chair. The bull has now been around for 63 months. That’s longer than nine of the 15 bull markets since 1871.
Surprisingly, though, it still has five more months to go until it is average in terms of length – and 41 months before it reaches the post-World War II average.
Bull markets have been getting longer since the end of the War – a lot longer. Starting with the bull that began in 1949, bull markets have lasted an average of 104 months – or nearly nine years. That five-year old bull doesn’t sound quite so old now, does it? Of the seven bull markets (including the current one) since then, this one ranks only fifth in terms of length.
From the low in 2009 at 666.79, to the all-time high of 1,897.28, the S&P 500 has risen 185% – a heck of a move. That’s above the 163% average since 1871. However, the modern bull market (since the end of WWII) has averaged 259% gains.
Interestingly, three bull markets gained less than 100% while the other three were up 391%, 414% and 516%, respectively. Could the fact that the current one broke through the 100% barrier mean that it’s headed significantly higher?

If the market simply performed according to the average modern day bull market, it would last another 3 1/2 years and rise 74%.
Not Cheap, but Not Expensive
Many pundits call the market expensive at 17.2 times earnings. By historical bull market standards, it’s not.
The historical average of the S&P 500 is 16.4. While the current market is not dirt-cheap, it’s hardly in bubble territory.
The modern-day bull market on average doesn’t top out until the price-to-earnings ratio (P/E) of the S&P 500 hits 21.3.
Applying the 21.3 P/E to trailing 12 months earnings gives us a price target of 2,322, or 22% higher than the all-time high reached last month.
Let’s assume that I’m right and the bull market lasts another few years. We’ll also assume that Wall Street’s consensus estimates for the S&P are right on target. If we apply the 21.3 P/E to 2014 estimates we get a target of 2,510, a 32% gain.
In 2015, we’d be looking at an S&P 500 at 2,791, or 47% higher.
And using 2016’s estimates, the S&P would stand at 3,101. A 63% climb from the all-time high.
And if the economy gets better, those earnings could wind up better than the consensus.
Don’t Fight the Fed
Lastly, it’s never a good idea to bet against monetary policy. And I expect the Fed to keep rates low for the foreseeable future.
Consider the economic statistics that were released last week.
First quarter GDP growth was a pathetic 0.1%. Granted, it was impacted by the severe weather that affected much of the country this winter. But still, it’s a bad number.
The jobs data were a mixed bag. There were 288,000 new jobs created, which was positive. But wages did not increase and the unemployment rate fell to 6.3%, mostly due to the fact that more people gave up looking for jobs, so they were no longer counted.
Though the Fed has been tapering (buying back fewer bonds) by about $10 billion per month, it will likely keep interest rates low for a while.
The bond market certainly thinks so. Despite strong nonfarm payroll numbers, the lower unemployment rate and the near record highs in the market, the yield on the 10-year Treasury bond hit its lowest level in six months last Friday.
If you believe as I do, that markets are better predictors of economic events than economists, the bond market is telling you rates aren’t going higher for a while.
So let the Chicken Littles, the permabears and the nattering nabobs of negativity tell you why the bull market is over. If history is our guide, the bull still has a lot more gains to give us.
Good investing,
Marc


-
I know Mike is a very solid investor and respect his opinions very much. So if he says pay attention to this or that - I will.
~ Dale G.
-
I've started managing my own investments so view Michael's site as a one-stop shop from which to get information and perspectives.
~ Dave E.
-
Michael offers easy reading, honest, common sense information that anyone can use in a practical manner.
~ der_al.
-
A sane voice in a scrambled investment world.
~ Ed R.
Inside Edge Pro Contributors

Greg Weldon

Josef Schachter

Tyler Bollhorn

Ryan Irvine

Paul Beattie

Martin Straith

Patrick Ceresna

Mark Leibovit

James Thorne

Victor Adair