Timing & trends

Which Resource Areas Show Signs of Strength?

Global synchronized growth, as measured by the Global Purchasing Managers’ Index (PMI), remained stable or positive for the past 12 months until Japan reversed the momentum in April with a precipitous drop in its PMI.  China is contributing modest growth but, fortunately, the U.S. and Europe are rebounding. This lack of consistent global momentum has created a short-term, volatile, hot and cold, stop and go sentiment.  Global real GDP growth peaked in 2010 at 5.2 percent, then slowed for the next three years, to 3 percent.  Global growth in 2014 is likely to accelerate, for the first time in four years, to 3.5 percent, according to ISI. This is constructive news for commodities.  

Brian Hicks and I co-manage the Global Resources Fund (PSPFX) using a model that focuses on companies demonstrating robust fundamentals in sectors showing strength.  I’ve asked Brian to share his thoughts on the opportunities we see in today’s market.

Q: We’ve seen strength in the major oil companies, service and equipment companies, oil and gas exploration and production (E&P) companies, chemical companies and refiners. What’s behind the strength?

A: The major oil companies have benefited from higher Brent pricing and cheap relative valuation to energy and the broader market. E&P stocks are especially solid because the price of oil is strong. The shale revolution has been a transformative factor for a lot of companies in this space, creating very strong growth in production. Chemical companies and refiners are downstream beneficiaries of the shale play as relatively inexpensive oil and natural gas prices lower their main input cost in the manufacturing of chemicals and refined petroleum products.  Because of this competitive advantage in the U.S., we’re seeing chemical companies moving back to the states and creating jobs. Global demand is also increasing for oil and chemicals.

image003

Q: Other commodities such as copper, aluminum and iron ore have been struggling. The Brent oil price hasn’t moved as much as the WTI price. Explain what is happening in these areas.

A: Brent oil isn’t necessarily struggling, but it has been stuck in a sideways trading pattern. Copper prices have fallen hard and subsequently rebounded recently. The metal has experienced a lot of volatility as well. This is mainly due to soft economic growth in China and high inventory levels in global exchanges. Aluminum and iron ore are both oversupplied and the glut has weighed on prices. Until we see cutbacks in production and prices that support profit, they will likely remain weak. Australian iron ore producers have cranked up production to the point where 2014 will likely remain a year of oversupply.

Q: Talk about some of the recent “success story” stocks in the fund. 

A: Raging River Exploration is a Canadian junior oil and gas producer. The company has a deep inventory of drilling prospects, strong netbacks (the gross profit per barrel of oil produced), and has seen rising profit growth. We bought this name on a price pull back.

image004

Sherritt International Corp is another Canadian based resource company. It has interests in nickel, coal and cobalt mining. Nickel prices were under tremendous pressure last year due to oversupply but have surged this year since Indonesia banned exports of unprocessed ore in an effort to encourage domestic industrial development. Indonesia is the world’s leading supplier of high-grade nickel ore, which is used to make stainless steel. Sherritt has benefited from this drastic change in the nickel market.

image005

Goodrich Petroleum Corp is an exploration and production company that looks for natural gas and crude oil. The company has had positive drill results recently in a developing new play, the Tuscaloosa Marine Shale in Louisiana and Mississippi. We first bought the stock around $14. Today it is trading around $24.

image006

Q: Recently the overall market sentiment has shifted to prefer large cap companies over small cap stocks. Why do you still believe in small caps for the long term?

A: Small caps are where the growth is going to come from, and this is true of resource companies as well. These types of stocks may be out of favor for the time being, but in the stock market everything is cyclical. Eventually, the market will recognize (again) that smaller companies have higher growth potential and the sentiment will shift back.

Going back to 1926, small cap stocks have historically performed better from November through April. Check out the difference between a buy and hold strategy and one where small cap were held during the May to October period.

image007

Vancouver is a lovely summer destination and the perfect place to learn more about resource investing. I’ll be speaking there at the Natural Resource Symposium July 22-25. I hope to see you there.

Please consider carefully a fund’s investment objectives, risks, charges and expenses. For this and other important information, obtain a fund prospectus by visiting www.usfunds.com or by calling 1-800-US-FUNDS (1-800-873-8637). Read it carefully before investing. Distributed by U.S. Global Brokerage, Inc.

Foreign and emerging market investing involves special risks such as currency fluctuation and less public disclosure, as well as economic and political risk. Because the Global Resources Fund concentrates its investments in specific industries, the fund may be subject to greater risks and fluctuations than a portfolio representing a broader range of industries.

Fund portfolios are actively managed, and holdings may change daily. Holdings are reported as of the most recent quarter-end. Holdings in the Global Resources Fund as a percentage of net assets as of 03/31/14: Goodrich Petroleum Corp 1.13%, Raging River Exploration Inc. 1.21%, Sherritt International Corp 1.24%.

All opinions expressed and data provided are subject to change without notice. Some of these opinions may not be appropriate to every investor. By clicking the links above, you may be directed to third-party websites. U.S. Global Investors does not endorse all information supplied by these websites and is not responsible for their content.

The J.P. Morgan Global Purchasing Manager’s Index is an indicator of the economic health of the global manufacturing sector. The PMI index is based on five major indicators: new orders, inventory levels, production, supplier deliveries and the employment environment.


The Belgian Connection

UnknownOne of the biggest questions at the end of 2013 was how the Treasury market would react to the reduction of bond buying that would result from the Federal Reserve’s tapering campaign. If the Fed were to hold course to its stated intentions, its $45 billion monthly purchases of Treasury bonds would be completely wound down by the fourth quarter of 2014. Given that those purchases represented a very large portion of Treasury bond issuance at that time, it was widely assumed by many, me in particular, that the sidelining of such huge demand would push down the price of Treasury bonds. Without the Fed’s bid, interest rates would have to rise.

But almost five months later, yields on the 10-year Treasury bond are 50 basis points lower than they were at the end of 2013, despite the fact that the Fed has officially trimmed its monthly purchases in half. Apparently, plenty of other buyers were prepared to fill the void. Many have concluded that Uncle Sam doesn’t need the Fed after all.  But a close look at international activity in the Treasury market reveals some odd patterns that should be explained.

Over the last six months Belgium has started to behave eccentrically, even by Belgian standards. No, the small country of 11 million has not decided to stop making chocolate or waffles. It has decided to increase its buying of U.S. Treasury bonds…in a very big way. According to latest U.S. Treasury Department data, since August of 2013 entities in Belgium have purchased and held a stunning $215 billion of U.S. Treasuries. This figure is equivalent to about half the country’s annual GDP, and equates to almost $20,000 for every living Belgian. Prior to that time, Belgium had held its cache fairly steady at around $170-$190 billion. But by March, that total had increased by almost 130% (to $381 billion) in just seven months. The purchases represented 61% of the total increase in foreign holdings of U.S. Treasuries over that time frame. Given the fact that Belgium, as of last September, had less than 3% of the Treasury bonds held by foreign sources, this is strange behavior indeed.

Of course exactly who is buying those bonds remains a mystery. It’s only known for sure that a Belgium-based clearing house called Euroclear is “likely responsible” for holding the $200 plus billion in Treasuries. It’s amazing in this day and age when every e-mail and phone call is scrubbed for security content that hundreds of billions of dollars could move across borders without anyone really knowing what is going on. Of course this is likely only possible if official sources themselves are the transacting parties.

What is clear is that this is not likely the government of Belgium, or private Belgian capital, that is doing the buying. The numbers are just too large. This is particularly true in the First Quarter of 2014 when the buying averaged a stunning $41.5 billion per month (January was the biggest month with $54 billion). In all likelihood, the only European buyer with a wallet that big would be the European Central Bank (ECB) itself. But why would the ECB buy when the Federal Reserve was supposed to be tapering?

It is widely recognized that as the flow of capital increases exponentially across borders, and financial systems become more globally integrated, international central bank cooperation has increased. This is especially true between the Federal Reserve and the European Central Bank (ECB) which have closely coordinated policy to deal with the Great Recession of 2008 and the European Sovereign Debt Crisis of 2011. Exactly how, where, and why these banks have worked together is a little harder to imagine.  

Back in late 2011, when the sovereign debt crisis of Greece, Spain, Italy and Portugal threatened to fracture the European Union and take down the euro currency, the Wall Street Journal

reported the Federal Reserve was engaging at that time in a “covert bailout” of European banks. Using what was known as a “temporary U.S. dollar liquidity swap arrangement,” the Fed provided billions in funds that its European counterpart used to bail out its banks. The Journal

speculated that the roundabout arrangement was followed in order to get around legal restrictions that prevented the ECB from lending to banks directly. The Journal called the arrangement “Byzantine” and questioned whether its design was simply meant to confuse the press and investors as to who was funding whom. In any event, the program seems to have achieved its end of keeping European banks solvent until the debt crisis had abated.

The Belgian head-scratcher may therefore be a simple case of central bankquid pro quo. In fact, on my radio program today, former Congressman Ron Paul shared my suspicions that there was indeed some type of “quid pro quo” coordination. While there is no smoking gun, the timing and scope of the buying is certainly suggestive of a coordinated effort. Confidence that the financial markets would stay stable during the tapering campaign was a critical element of the program’s success. Any panic in the bond market would cause yields to spike, which would have a strong negative effect on stock prices and economic confidence. If the fear persisted for more than a few weeks, the Fed would have been forced to an embarrassingly early backtrack. The lost credibility would have greatly limited the Fed’s latitude for further maneuver.

But what if the ECB started buying just as the Fed stopped? Better yet, what if the ECB purchases were larger than the taper? It would then appear that the Fed buying was simply a footnote in the current environment of ultra-low interest rates, not the driving force. It may not be coincidental that the Belgian buying began in earnest just as the tapering got underway. Something may in fact be rotten, and it’s not in Denmark…but several hundred kilometers to the southwest.

Rather than looking to explain the unusual spike in Belgian coffers, most market watchers are fixated by recent comments by Mario Draghi that the ECB is poised to launch a quantitative easing-style bond buying campaign in order to weaken the euro and to push up inflation in Europe. If that is the case, how long could the ECB be expected to fight a two-front monetary war…carrying water for the Fed while buying European bonds simultaneously?   We must expect that any clandestine campaign by the Europeans to support Treasuries will have a brief shelf life, which could get even briefer if the ECB initiates their own QE. 

It is a testament to the bovine nature of our financial media that this story is not being pursued strongly by all the power the fifth estate can muster. But who cares when rates are low and stock prices high? Have another chocolate. The Belgian ones are the best.

Peter Schiff is the CEO and Chief Global Strategist of Euro Pacific Capital, best-selling author and host of syndicated Peter Schiff Show. 


Catch Peter’s latest thoughts on the U.S. and International markets in the Euro Pacific Capital Spring 2014 Global Investor Newsletter!

Charles Oliver, lead portfolio manager with the Sprott Gold and Precious Minerals Fund, believes the only thing between investors and bigger investment returns on precious metals equities and bullion, especially silver, is time. In this interview with The Gold Report, Oliver discusses silver and gold demand drivers, as well as portfolio ideas that figure to get bigger with time as the trigger.

The Gold Report: “Sell in May and go away” is a common investing axiom but does it have any validity?

Charles Oliver: I recently went through some research on seasonality in the gold price. March has been negative in the gold space in six of the last eight years, April has proven negative four out of the last eight years, and May and June have both been negative five of the last eight years. However, we see a fairly dramatic turnaround in July where six of the last eight years have been positive. In August, another six of the previous eight years have been positive; September has been positive five of the last eight years. The “sell in May” adage could actually represent a great buying opportunity on the pullback.

TGR: What are some investment themes you expect to dominate through the rest of the year?

CO: It really comes down to printing money. The U.S. has reduced its money printing but it is still aggressively printing. Now we’re hearing about the Europeans potentially getting into quantitative easing. The debasement of currencies is an ongoing theme.

The other key theme is the demand for physical gold. China has become the world’s largest gold buyer, consuming about 40% of the world’s mine production. India, which historically had been the world’s largest gold consumer, has established some tariffs on gold imports, so there’s been some pullback there.

It’s noteworthy that over the last couple of decades the European central banks have been collectively selling gold. That stopped a couple of years ago. Some numbers from the Swiss Customs Authority show that Germany, France, Singapore, Thailand, even the United Kingdom, are fairly significant gold buyers. These are very positive events.

TGR: What about geopolitical events? Do you expect those to dramatically influence gold prices?

CO: Historically, wars and the risk of wars have been quite positive for the gold price yet recent events in the Ukraine haven’t seen gold do anything. In fact, it’s trading near the bottom end of its recent range. But should things escalate, I feel strongly that it will have a positive impact. I certainly hope that it doesn’t come to that but the risk seems significant.

TGR: What is the investor pulse in the precious metals space?

CO: A year ago investors were selling a little, as they had been for some time. The selling had mostly stopped by the end of the 2013 and the people who didn’t have long-term conviction had left. In early 2014 I was a bit surprised to see U.S. value investors streaming in because we had been through a period of net redemptions. When the Americans come into the market they can have quite a dramatic impact on prices. I’ll call it sporadic because it has not been a consistent stream.

TGR: What happened to those bids?

CO: Generally speaking, American investors, portfolio managers and pension funds were saying at the end of 2013, “We’ve had some good returns in the general market but the market is looking somewhat expensive.” They were looking for areas where there was good value. The gold price had been hammered over the last couple of years so they were starting to move some of their allocations into that space. We’ve also seen some private equity buying assets and taking them private. And some Asian interests dipping their toes in the water. People are starting to wake up and show some interest but they are still waiting for some sort of trigger in order to say that this is the time to jump in.

TGR: Any idea what that could be?

CO: I’ve spent a lot of time thinking about that question. I liken the 1974 to 1976 period to today. In 1974, the oil price was going up after the oil embargo and inflation was going up, too. It was peculiar because the gold price went from about $200 per ounce ($200/oz) to $100/oz over the next couple of years. Then in 1976 gold suddenly went from $100/oz to about $800/oz. I have spent a lot of time trying to determine the trigger for that event. Sometimes it is just time. When I look back at 2013, I see a lot of positive fundamentals—strong Chinese demand, huge amounts of money printing—yet the gold price went down. Sometimes it’s just the way the markets time themselves.

TGR: Do investors need to revise their price expectations for precious metals equities? There is zero froth in this market.

CO: I think that’s a good way of putting it. I’m continually trying to figure out where the market may go. Not too long ago I said that by the end of this decade gold should be approaching something like $5,000/oz, which would have a huge impact upon the markets and stock valuations. The market is valuing equities as if gold is going to stay at $1,200–1,300/oz forever. I believe that the market will be proven wrong over time.

TGR: Gold is trading at roughly 67 times silver. Does that make silver your preference?

CO: Yes. It was Eric Sprott who came up with the thesis and I fully embrace it. For over 1,000 years, the silver-gold price relationship was close to 16:1, so that implies that if gold is $1,600/oz, the silver price would be $100/oz. The last time that happened was 1980 when the gold price was roughly $800/oz and the silver price was around $50/oz. Over the next couple of years, I expect to see that 67:1 ratio migrate toward 16:1.

TGR: Yet the trend is moving in the opposite direction.

CO: In the short term sometimes these things happen. About 25% of the weighting in the Sprott Gold and Precious Minerals Fund (SPR300:TSX) is in silver equities, which is probably among the highest in the peer group for precious metals funds.

TGR: What’s your investment thesis for silver versus gold?

CO: About two-thirds of mined silver is used in industry, whereas gold has virtually no industrial usage. Gold is considered a reserve currency whereas silver is not. About 150 years ago many countries had silver reserves backing their currencies. Today they don’t but China has trillions of U.S. dollars that it is converting into hard assets. The Chinese are buying a lot of gold but if they ever decide to be a silver buyer we would see a huge shift in the price of silver. Look at every mined commodity out there today—copper, nickel, zinc, iron ore—China accounts for 40–50% of global consumption.

TGR: Is it all about margin for precious metals equities?

CO: A lot of these companies are producing gold at $1,000/oz or silver at $18/oz. Should silver go up to $30/oz, that $2/oz margin suddenly becomes $12/oz—a sixfold increase. Shifts in commodity prices could have huge impacts on the profitability of these companies.

TGR: Tell us about some of your top silver holdings.

CO: Among my top 10 silver holdings, I have Silver Wheaton Corp. (SLW:TSX; SLW:NYSE)Pan American Silver Corp. (PAA:TSX; PAAS:NASDAQ) and Tahoe Resources Inc. (THO:TSX; TAHO:NYSE), which operates one of the world’s newest silver mines. I visited Tahoe’s Escobal mine in Guatemala earlier this year to check out its ramp-up period because that can be challenging. The company is doing a very good job of ramping up to nameplate capacity. Tahoe’s Q1/14 results beat the expectations of most analysts and a number of them are revising their forecasts upward.

In the gold space I have companies such as Osisko Mining Corp. (OSK:TSX) and IAMGOLD Corp. (IMG:TSX; IAG:NYSE).

TGR: I thought the Osisko story was finished.

CO: A byproduct of the Yamana Gold Inc. (YRI:TSX; AUY:NYSE; YAU:LSE)/Agnico-Eagle Mines Ltd. (AEM:TSX; AEM:NYSE) takeover bid for Osisko is a potential Osisko spinout company. For every Osisko share, investors would own one share of the spinco. It means roughly 15% of an Osisko share is represented by the value of the spinco and the other 85% consists of shares in Agnico-Eagle, Yamana and cash. An Osisko shareholder today will end up owning a combination of all three companies, plus the cash component of the offer.

One thing that keeps me excited about the spinco is that it is going to have a 5% royalty on the Canadian Malartic gold mine. It would also have a 2% royalty on the Hammond Reef and Kirkland Lake assets, as well as a large land package in Mexico. The Osisko spinco would be Canada’s newest royalty company and royalty companies often get a premium valuation.

TGR: Does the new company have a ticker?

CO: Osisko shareholders will have to vote to accept the Agnico-Eagle and Yamana bid. I expect it will pass and the Osisko spinco should be trading sometime in June.

TGR: Osisko was targeted largely because it had a large low-grade, low-cost asset in a safe jurisdiction. Does that make companies like Detour Gold Corp. (DGC:TSX) and Tahoe Resources takeover targets?

CO: Certainly both Detour and Tahoe would fit the model sizewise. Goldcorp Inc. (G:TSX; GG:NYSE)walked away from the Osisko bid and clearly it wants to continue to grow through mergers and acquisitions. What will Goldcorp do? I’m not expecting the company to come out tomorrow and make an acquisition on either of these names, but I think it will certainly do the diligence work.

Goldcorp already owns 40% of Tahoe, which has a world-class asset with world-class operating statistics. Goldcorp is already in Guatemala; I’m not sure if it wants to increase its weighting there.

In the case of Detour, yes, it’s in Canada, and from that point of view, quite attractive. Detour is still in the ramp-up stage and perhaps it has finally reached the point where it is producing and reducing its cash costs. But I think Detour is still a year behind Osisko on that front.

TGR: Detour just published Q1/14 results. It had an adjusted net loss of $0.20/share, while it produced roughly 107,000 oz gold. Your thoughts?

CO: I was impressed at what Detour was able to achieve because it was a tough winter. I had some concerns that the weather might have proven to be an impediment, but the company produced a significant amount of gold. I think the grade was 0.9 grams per ton. Some of that was from stockpiles to buffer the grade at the mill. There are always a few bumps in the road but Detour has done very well.

TGR: In early 2013 that stock was above $25/share. Now it’s about $11/share. What’s going to get it back above, say, $15/share?

CO: A couple of things. As I said earlier, I believe the gold price is going higher. With higher gold prices come higher margins. And I think the market is still putting a discount on Detour as it’s in the ramp-up phase. As the company brings down cash and operating costs quarter by quarter and approaches Detour Lake’s nameplate production capacity, the stock will get back to a higher valuation.

TGR: Do you have any more gold names for us?

CO: I’ll mention some of my larger holdings of nonproducers: Dalradian Resources Inc. (DNA:TSX) andAsanko Gold Inc. (AKG:TSX; AKG:NYSE.MKT) that form part of a diversified portfolio.

TGR: What is the Dalradian story over the next 18 months or so?

CO: The company will continue to derisk the Curraghinalt project in Northern Ireland. Dalradian will go underground and through further drilling convert a fair amount of the Inferred resources to the Measured and Indicated category. As the market gets confidence with those numbers, it will start to rerate the company. A lot of people were concerned about whether mining would occur in Northern Ireland. To address that, Dalradian is looking to make a concentrate instead of using cyanide. The company is doing things that will ultimately make it more attractive.

TGR: Why do you own Asanko?

CO: It used to be called Keegan Resources. The management of Asanko bought into the project for around $27 million. These are the people that ran LionOre Mining, which under a decade ago was the subject of a bidding war between Xstrata Plc (XTA:LSE) and Norilsk Nickel Mining Co. (GMKN:RTS; NILSY:NASDAQ; MNOD:LSE). They’re good people with good operational experience. Asanko merged the PMI Ventures assets with those that were in Keegan and now has two projects within about 10 kilometers of each other, which are expected to have synergies. The company also has a significant amount of cash.

TGR: The Sprott Gold and Precious Minerals Fund has held positions in Pretium Resources Inc. (PVG:TSX; PVG:NYSE)Guyana Goldfields Inc. (GUY:TSX)Unigold Inc. (UGD:TSX.V) and Kirkland Lake Gold Inc. (KGI:TSX). Does it still have positions in those names?

CO: Pretium and Guyana are among my top holdings. Unigold, which you mentioned, is a small-cap name in the Dominican Republic. Unfortunately it has been the victim of the small-cap market where investors have turned their backs on these types of companies through no fault of management. I think Unigold has an interesting property with lots of opportunities and drill targets, and could potentially have a mineable resource one day.

TGR: Guyana Goldfields’ flagship Aurora project has outlined 6.5 million ounces Measured and Indicated, yet the stock price is falling.

CO: The company is at the point where it is ordering equipment, getting its financing in place, and then it will start building and moving Aurora forward. Again, it’s time and execution.

TGR: Pretium had a bumpy ride in 2013. Do you still have faith in management?

CO: Yes. I visited Brucejack in British Columbia last year. It’s a “nuggety” project that’s difficult to model. It takes a lot of drilling to get that necessary level of confidence. Last year the company processed a 10,000-ton bulk sample that produced around 6,000 ounces (6 Koz) or about 0.6 ounces per ton. In February, Pretium sent another 1,000-ton sample to the mill and it produced around 3 ounces gold per ton. The important thing to look at with this company is that there is lots of gold underground; the model still needs work to figure out how best to mine it. Pretium is proceeding with further studies on Brucejack, but I think it will be a mine. It’s also a potential acquisition as it is a high-grade deposit in Canada.

TGR: Kirkland Lake Gold forecasts roughly 126 Koz in production in 2014. Is that realistic?

CO: It will probably come close to that number. Kirkland Lake has a new CEO, George Ogilvie, and a fairly dramatic change in ideology. A couple of years ago the company was focused on mining everything in the mine. Ogilvie is focused on mining more profitable ounces.

TGR: I understand that Kirkland has been attempting to lower costs. Is that working?

CO: Kirkland Lake is not yet profitable, but it has instituted a new program to mine higher grades. It will focus on the high-grade ore because that is where it will make a profit. This is the same strategy that Rob McEwen put into place at the Red Lake mine. I think Kirkland has huge potential but it ultimately comes down to strategy execution.

TGR: In March you said that gold would reach $5,000/oz within a few years. That seems optimistic.

CO: It’s based on the historical relationship between the Dow Jones Industrial Average and the gold price. Over the last 100 years there have been three times when it has cost 1 to 2 ounces gold to buy the Dow. The last time was 1980 when the gold price was $800/oz and the Dow was 800.

People roll their eyes when you forecast big numbers. In 2004 or 2005, I said gold would reach $1,000/oz. When it reached $1,000/oz, I moved to $2,000/oz and we almost got there. With the willingness of the market to continue to print money, I believe that we are going to get that 2 or 3 to 1 relationship with the Dow. With the Dow at 16,000, I think $5,000/oz is achievable. It’s not really that the gold price is increasing, it’s that paper currencies are depreciating in value.

TGR: Thank you for your time and commentary, Charles.

Charles Oliver joined Sprott Asset Management in 2008. He is lead portfolio manager of the Sprott Gold and Precious Minerals Fund. Previously, he was at AGF Management Limited, where his team was awarded the Canadian Investment Awards Best Precious Metals Fund in 2004, 2006 and 2007. His accolades also include: Lipper Awards’ best five-year return in the Precious Metals category (AGF Precious Metals Fund, 2007), and the Lipper Award for best one-year return in the Precious Metals category 2010.

Related Articles


Want to read more Gold Report interviews like this? Sign up for our free e-newsletter, and you’ll learn when new articles have been published. To see recent interviews with industry analysts and commentators, visit our Streetwise Interviews page.

DISCLOSURE: 
1) Brian Sylvester conducted this interview for Streetwise Reports LLC, publisher of The Gold Report, The Energy Report, The Life Sciences Report and The Mining Report, and provides services to Streetwise Reports as an independent contractor. He owns, or his family owns, shares of the following companies mentioned in this interview: None. 
2) The following companies mentioned in the interview are sponsors of Streetwise Reports: Guyana Goldfields Inc., Pretium Resources Inc., Tahoe Resources Inc. and Unigold Inc. Goldcorp Inc. is not associated with Streetwise Reports. Streetwise Reports does not accept stock in exchange for its services.
3) Charles Oliver: I own, or my family owns, shares of the following companies mentioned in this interview: None. I personally am, or my family is, paid by the following companies mentioned in this interview: None. My company has a financial relationship with the following companies mentioned in this interview: None. The Sprott Gold and Precious Metals Fund owns all the companies mentioned in this interview. I was not paid by Streetwise Reports for participating in this interview. Comments and opinions expressed are my own comments and opinions. I had the opportunity to review the interview for accuracy as of the date of the interview and am responsible for the content of the interview. 
4) Interviews are edited for clarity. Streetwise Reports does not make editorial comments or change experts’ statements without their consent.
5) The interview does not constitute investment advice. Each reader is encouraged to consult with his or her individual financial professional and any action a reader takes as a result of information presented here is his or her own responsibility. By opening this page, each reader accepts and agrees to Streetwise Reports’ terms of use and full legal disclaimer.
6) From time to time, Streetwise Reports LLC and its directors, officers, employees or members of their families, as well as persons interviewed for articles and interviews on the site, may have a long or short position in securities mentioned. Directors, officers, employees or members of their families are prohibited from making purchases and/or sales of those securities in the open market or otherwise during the up-to-four-week interval from the time of the interview until after it publishes.


8 Commodity Predictions For The Rest Of 2014

HAI BullandBearWe take a look at key areas of the commodity markets.

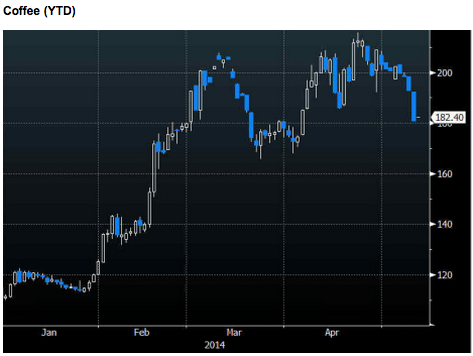
There’s been no shortage of volatility in commodity markets this year. From coffee’s spectacular surge to copper’s brutal plunge, there’s been ample opportunity to generate hefty returns or losses. Here we take a look at year-to-date performance in a number of the most important commodities and analyze where they could go in the coming months.

Screen Shot 2014-05-20 at 4.47.40 AM

In terms of sector performance, agriculture has been far and away the best performer so far in 2014. Led by coffee—which at one point was up a whopping 95 percent year-to-date—the sector has delivered fantastic returns for investors. 

At the heart of the increase in coffee prices has been the severe drought in Brazil. What has been called the worst drought in decades is expected to sharply reduce coffee supplies in the world’s largest grower and exporter. Analysts estimate that global coffee supplies may fall short of demand by more than 10 million bags this year—a significant amount in a world that consumes roughly 130 million bags annually. 

But are these bullish fundamentals priced into coffee?

Bull case: If Brazil experiences heavy rains this summer during the harvest, the country’s coffee yields could suffer more. That would lead to a bigger gap between supply and demand and send prices spiking above $2/lb, perhaps even $3 (where they traded as recently as 2011). 

Bear case: On the flip side, the world’s second-largest producer, Colombia, is expected to have a stellar harvest, which could help fill some of the gap left by Brazil. At the same time, global coffee surpluses during the past four years have left inventories at comfortable levels. Those could provide a buffer despite this year’s expected supply deficit.

Prediction: While it’s possible coffee prices may not rally much more from here, it’s hard to see them falling back to levels below $1.20/pound where they were at the beginning of the year—at least in the short term.

Screen Shot 2014-05-20 at 4.49.03 AM

….read page 2 HERE

A less than 2% mortgage rate

forsaleMortage brokers were abuzz this week when Investors Group announced a 1.99% variable 3 year floating rate mortgage. But is does come with a few surprises.

While there’s no denying the importance of getting a low interest rate when you get a mortgage, but there are big caveats that come with some of the record discounting going on for residential loans.

CLICK HERE to read the complete article

test-php-789