
Timing & trends
“Our main format is now video analysis…”
Here are today’s 4 videos – Click either the title or the chart to begin


Thanks,
Morris
| May 23, 2014 Super Force Signals special offer for Money Talks Readers: Send an email to trading@superforcesignals.com and I’ll send you 3 of my nextSuper Force Surge Signals free of charge, as I send them to paid subscribers. I’ll also send you a free video analysis of the GDX 60 minute chart, focusing on candlesticks and volume. Thank you! |
The SuperForce Proprietary SURGE index SIGNALS:
25 Surge Index Buy or 25 Surge Index Sell: Solid Power.
50 Surge Index Buy or 50 Surge Index Sell: Stronger Power.
75 Surge Index Buy or 75 Surge Index Sell: Maximum Power.
100 Surge Index Buy or 100 Surge Index Sell: “Over The Top” Power.
Stay alert for our surge signals, sent by email to subscribers, for both the daily charts on Super Force Signals at www.superforcesignals.com and for the 60 minute charts atwww.superforce60.com
About Super Force Signals:
Our Surge Index Signals are created thru our proprietary blend of the highest quality technical analysis and many years of successful business building. We are two business owners with excellent synergy. We understand risk and reward. Our subscribers are generally successfully business owners, people like yourself with speculative funds, looking for serious management of your risk and reward in the market.
Frank Johnson: Executive Editor, Macro Risk Manager.
Morris Hubbartt: Chief Market Analyst, Trading Risk Specialist.
website: www.superforcesignals.com
email: trading@superforcesignals.com
email: trading@superforce60.com
SFS Web Services
1170 Bay Street, Suite #143
Toronto, Ontario, M5S 2B4
Canada
###
May 23, 2014
Morris Hubbartt

Summary:
- The 10-Yr UST yield has fallen from a high of 3.05% in January to a low of 2.52%
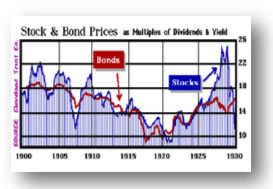
- Low bond yields and stocks near highs are sending conflicting messages
- Although many think this is bearish for stocks, I show why this probably isn’t the case
The 10-yr UST yield hit a low of 2.52% today, the lowest level since October of last year and continuing a trend of lower US long-term interest rates that began since the start of the year. Historically, falling bond yields have coincided with falling stock prices and vice versa; so, with the S&P 500 and the Dow Jones Industrial Average sitting near all-time highs, the biggest question right now is why are US Treasury rates still falling? The explanations crossing trade desks and media outlets are usually one or more of the following:
- Geopolitical concerns
- Worsening US growth forecasts
- Arbitrage between U.S. and European debt on ECB stimulus plans
- Rising credibility of the Fed’s ZIRP pledge
Since this has important implications for the stock market, let’s now examine each of the four explanations above and see which one holds water.
1. Geopolitical Concerns
One argument for lower bond yields making the rounds is that stock markets have largely ignored the unrest between Ukraine and Russia and are just now beginning to price in the growing geopolitical risk. There are hundreds of commentaries about the unrest between the two countries that argue things will spiral out of control while others are sanguine and think it is a non-event. What does the market tell us? If markets are truly just now pricing in geopolitical risk and beginning to weaken, then would it not be rational to conclude that Russian markets would also be deteriorating? Instead, we see the ruble and Russian stock market showing signs of stabilization. Shown below we see the MSCI Russia Index is up more than 20% from its March lows with the Russian ruble rallying nearly 7% relative to the USD. If tensions were unraveling we would expect to see the Russian stock market and ruble decline as it had in January and February.

2. Worsening U.S. Growth Forecasts
It is completely rational to think that lower bond yields are occurring as the economy is set to slip as typically bond yields decline when economic prospects worsen and rise when economic growth picks up. Thus, many investors are taking the decline in interest rates as a sign that the economy is set to roll over. However, rather than mirror bond yields, economic activity is supporting the message of the markets. For example, the ISM Manufacturing PMI shows strong directional similarity with the 10-yr UST yield and since January has been heading higher while rates have been falling.

It’s not just U.S. manufacturing that is diverging with bond yields but so has employment data. Since December U.S. payroll growth has been accelerating at the same time, 10-Yr UST yields have been falling.

If the U.S. economy was truly set to enter a soft patch ahead we would not expect developments like initial jobless claims dropping to a new best for this cycle. We learned today that Initial jobless claims dropped 24,000 to 297,000 during the week ending May 10, the lowest reported of the expansion so far.

While the argument that yields are falling as economic prospects are worsening may have been a good explanation during the first part of the year, the argument is weakening by the day. The Citigroup Economic Surprise Index for both the U.S. and major economies bottomed in April and has been heading higher as more economic reports have been surprising to the upside.

A case in point is the Empire Manufacturing PMI for May, which was estimated to be 6.00 and the actual was 19.01. The 19.01 reading beat ALL 51 estimates and was a big positive surprise. I think we can lay to rest the argument weakening economic growth is pushing down rates.

3. Investors Playing the Arbitrage Between U.S. and European Debt on ECB Stimulus Plans
Yields in Europe have been declining sharply for the last few years I believe for two reasons. The first is that Europe faces a deflationary threat as many country CPI indexes in Europe have turned negative and most, if not all, are below 1% annual inflation rates. In addition to the low inflation rates, I argued in February that the Eurozone economy was set to cool (click for article link). Since that time European economic releases have been surprising to the downside and missing estimates with the Citigroup Economic Surprise Index hitting nearly a 1-yr low.

The threat of disinflation and a weakening economy is why I made the argument in February and again in April (click for article) as to why the ECB was set to bring out the monetary bazookas, which is the second reason rates in Europe are falling. With weakening economic growth, waning inflation rates, and the prospect of ECB stimulus many investors have front-run the ECB by bidding up European debt. According to a recent Reuters article, the ECB may even start charging banks to hold excess reserves by having a negative deposit rate at the ECB, as highlighted below.
ECB readies package of rate cuts and targeted measures
The European Central Bank is preparing a package of policy options for its June meeting, including cuts in all its interest rates and targeted measures aimed at boosting lending to small- and mid-sized firms (SMEs).
Five people familiar with the measures being prepared detailed plans involving a potential rate cut, including the ECB’s deposit rate going negative for the first time, along with the targeted SME measures…
A second source echoed that sentiment, and added: “This will be the first major central bank to move to a negative deposit rate. That would move the exchange rate.”
If you invested in European debt back in 2012, you received rates that were 5-6% higher than a comparable U.S. debt on 10-yr bonds when buying Spanish or Italian debt. Similarly, two years ago, German 10-yr bunds were at parity with the 10-yr UST, no longer. Now we’ve seen European peripheral debt yields collapse to near parity with US Treasuries and German bunds yield more than 1% less than US 10-yr bonds as shown below.

So if you are an aggressive debt investor buying European debt you are no longer being compensated for taking undue risk in buying peripheral European debt like Italy or Spain, and if you are a high-quality debt investor that buys the safe end of the government bond spectrum in Europe, yields are next to nothing in German debt. Thus, it makes sense for both aggressive and conservative debt investors buying European debt to invest in U.S. Treasuries. For the aggressive investor you can get comparable yields and for less risk and for the conservative investor you can get more yield in UST bonds. This, I believe is one of the large factors as to why U.S. Treasury rates are plunging and yet our economy is humming along and the stock market is near its highs.
4. Rising Credibility of the Fed’s ZIRP Pledge
At Janet Yellen’s first testimony as Fed Chairwoman, when asked how long after the Fed ends their purchase program could the Fed Funds be raised she said six months. Markets were unsettled by that but Janet later back peddled and confirmed the Fed’s commitment to keep rates low for a considerable time. Investors took Janet at her word as expectations for higher interest rates in 2015 came down. This can be seen when looking at Fed Futures probabilities for the January 2015 FOMC meeting. Four months ago roughly 25% of investors thought the Fed would have already hiked rates to 0.50% and that has fallen to less than 10%. Notice the big jump in the percentage of investors betting rates will be at 0%, which increased from just over 30% to more than 50%. With investors having a greater belief that the Fed will keep rates low into next year, there is less of a fear of rising interest rates that would hurt bond investors and so we are likely seeing more money come back into the bond market.

Other Reasons
There was an excellent article in Bloomberg earlier this month that highlighted a more simplistic view as to why U.S. Treasury rates were heading down: simply more demand than supply.
Can’t Find Enough 30-Year Treasuries to Buy? Here’s Why
In a world awash with U.S. government bonds, buyers of the longest-term Treasuries are facing a potential shortage of supply.
Excluding those held by the Federal Reserve, Treasuries due in 10 years or more account for just 5 percent of the $12.1 trillion market for U.S. debt. New rules designed to plug shortfalls at pension funds may now triple their purchases of longer-dated Treasuries, creating $300 billion in extra demand over the next two years that would equal almost half the $642 billion outstanding, Bank of Nova Scotia estimates…
Pensions that closed deficits are pouring into Treasuries and exiting stocks to reduce volatility after a provision in the Budget Act of 2013 raised the amount underfunded plans are required to pay in insurance premiums over the next two years. It also imposed stiffer fees on those with shortfalls.
In the next 12 months alone, buying from private pensions will create $150 billion in demand for longer-maturity Treasuries, based on Bank of Nova Scotia’s estimates…
Net issuance of interest-bearing Treasuries will fall to $545 billion next year, estimates from primary dealer Deutsche Bank AG show. That’s a 36 percent decrease from last year.
The scarcity will act as a counterbalance to the Fed as it tapers, according to Dominic Konstam, Deutsche Bank’s New York-based global head of interest-rate research.
There truly is an emerging scarcity of long-term U.S. Treasuries as a narrowing in the deficit from tighter spending and higher taxes along with an expanding economy leads to a lower net issuance of Treasuries. The budget surplus of $106.9B seen in April was the third largest monthly surplus seen in this recovery and now the 12-month moving average of the monthly deficit/surplus is at -$41.6B, much improved from the -$123B average seen in early 2010.
So What Is Driving U.S. Rates Lower?
It’s important to understand what is driving U.S. Treasury rates down as the reason will shape your outlook for the market. If you believe that yields are lower as investors price in greater geopolitical risk and/or a worsening US economic growth forecast, then you would expect the stock market has it wrong and shouldn’t be near its highs and will recouple with bond yields and sell off. However, if you feel it is more of a U.S. and European bond arbitrage and/or more credibility being given to the Fed that they will keep rates low for a long time, then the stock market does not have it wrong and one should not be fearful of falling US interest rates. In addition to the factors making the rounds on trading desks there is also the issue of supply as the U.S. government issues less UST’s to finance its budget.
So, while many look at lower rates as a reason to become defensive, they may want to think again since the likely causes for lower rates do not have bearish implications. Moreover, lower rates are helping the market by bringing down overly bullish sentiment. Markets perform best when sentiment is bearish and with AAII % bullish readings near levels that have marked short-term lows in interest rates, we may be near a low in rates and the stock market, with both standing a good chance of rallying in the weeks ahead.

Summary
In summary, the likely reasons for U.S. Treasury yields selling off do not carry bearish implications for the stock market. As such, the belief that the bond market is signaling a bearish message for the stock market is likely to be proven unfounded. Rather, the bearish sentiment that has coincided with falling bond yields has actually helped provide a bullish support for the market and may now start to act as a tailwind.
About Chris Puplava

First I want to acknowledge how frustrating the markets have been over the last several months for most of you. There has been no clear cut trend in which one can just take a position and not get caught up in the chopping action the markets have been giving us. As I have said in the past the hardest part of trading is to get your initial position to stick before your sell/stop gets hit. If your a bear it’s two steps down and one step up and if your a bull it’s two steps forward and one step back. It’s that one step after you take your initial position that usually gets you if you don’t buy the exact high or low.
As of right now there is nothing broken in any of our portfolios as the consolidation patterns keep in building out. This is the frustration that most of you are feeling right now as there is no direction, one day up and the next day down. This is the how markets work. They will frustrate you until you can’t stand it anymore then you will sell out to save your sanity. Believe me there is nothing wrong with saving ones sanity as that is the most important feature for playing in the markets. The markets are hard enough to play when your sane but impossible if your emotions get in the way. I wish I had a magic wand I could wave to make it all better but I don’t and I don’t know anyone that does. So the game goes on until one side wins the battle and then we get a move we can actually hold onto for awhile.
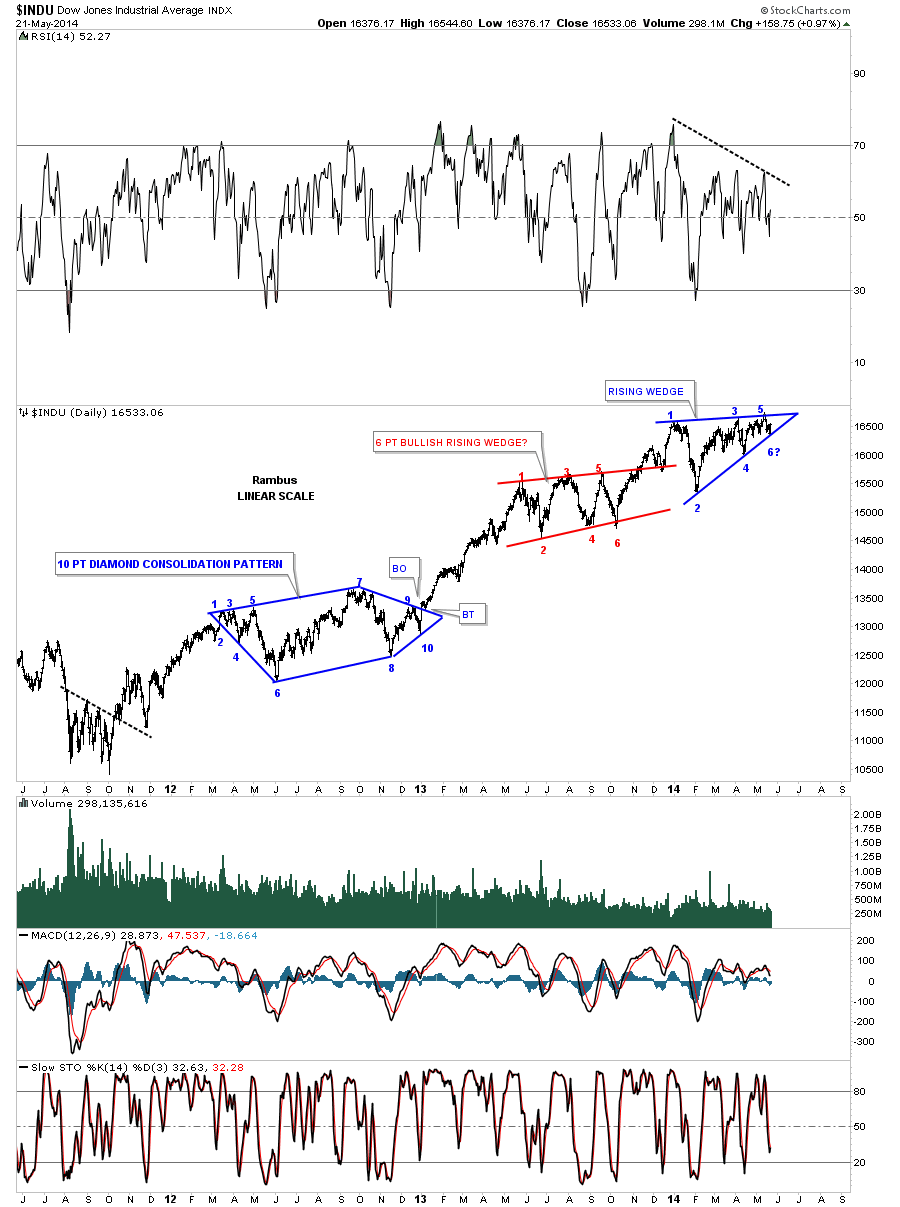
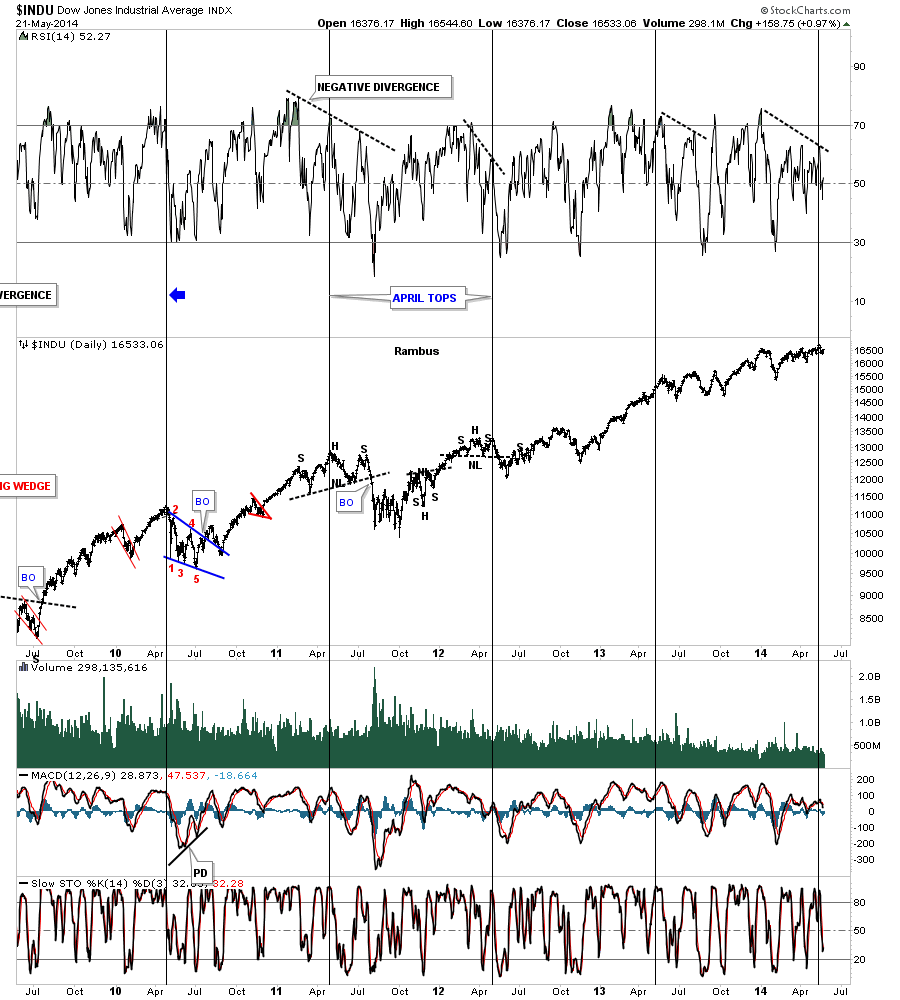
Lets start with a daily chart for the Dow Jones that has been consolidation or topping since the first of the year. It has completed 5 reversal points so far making it a reversal pattern at this time. The only problem is the price action bouncing off the bottom rail that could be a 6th reversal point if the price reaches the top rail. At that point it would be a consolidation pattern if it was to break through the top rail of the rising wedge. As of this moment the rising wedge is a reversal pattern because it has completed 5 reversal points so that is what we have to go on until something changes.
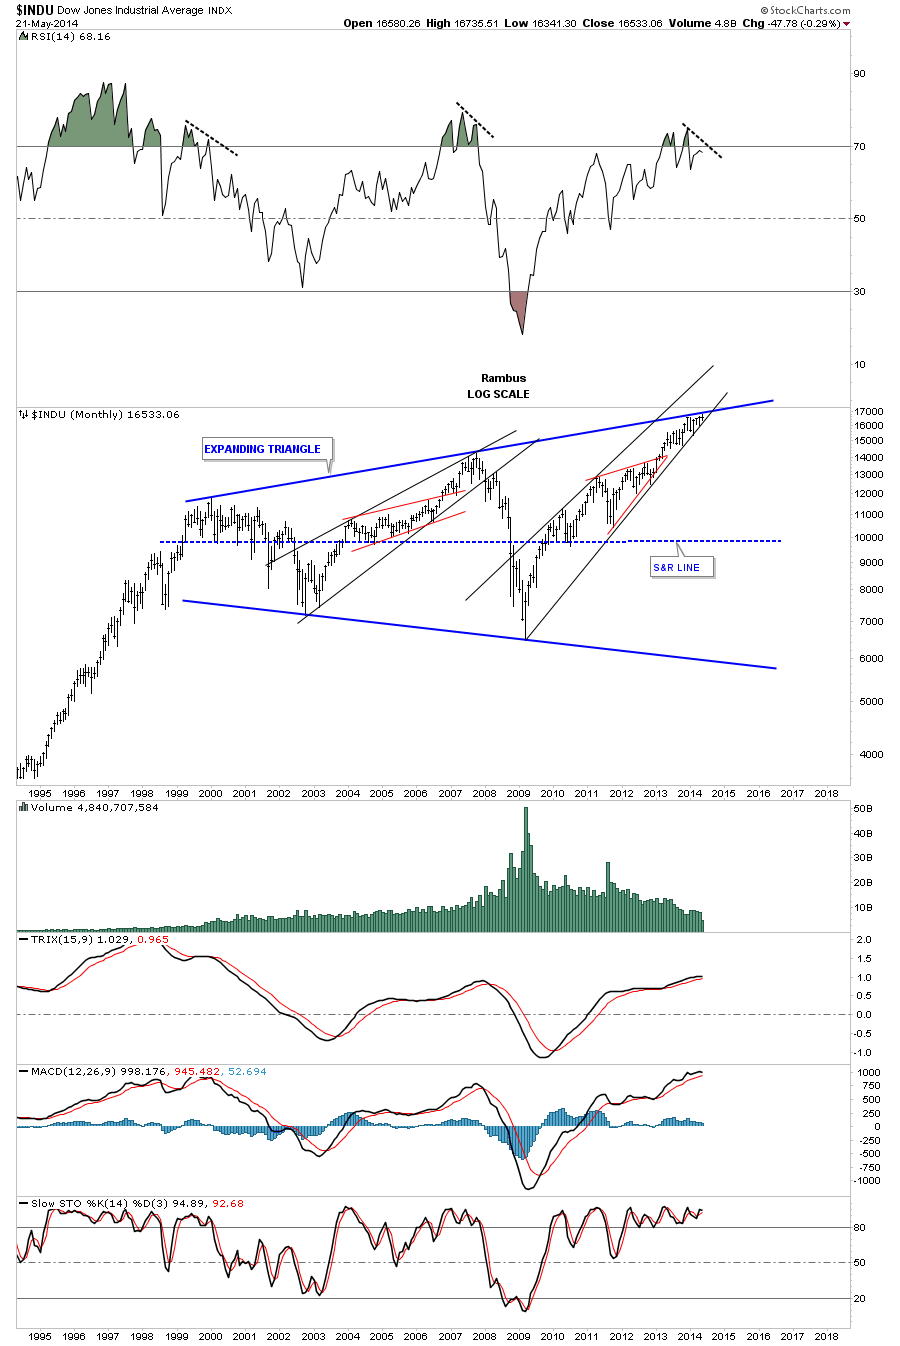
This very long term monthly chart for the Dow shows it’s trading at the top blue rail of a huge expanding triangle that starts back in 2000. As you can see the price action is squeezing right into the apex of the top blue rail of the expanding triangle and the bottom rail of the rising wedge. This is either a great shorting opportunity or if the price action can break above the top rail of the massive blue expanding triangle, a great buy. The jury is still out on this one yet.
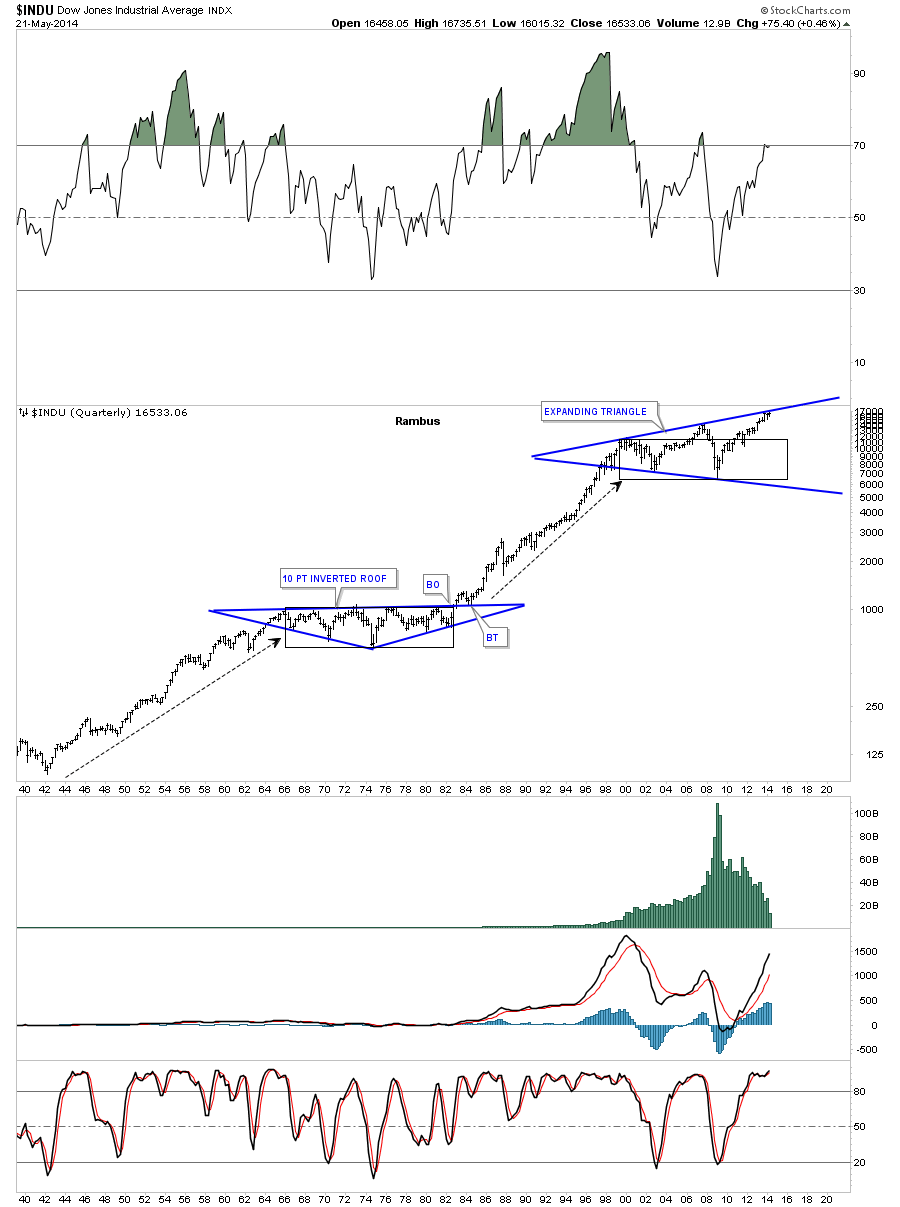
Below is a very long term chart for the Dow that goes all the way back to the 40′s. You can see the inverted roof pattern that formed during the big bear market of the 70′s. This chart does a good job of showing how an impulse move, on any time scale, plays out. Note the secular bull market that started in the early 40′s and ran all the way up to 1966 where the secular bear market began. You can see how long it took to work off the bull market run, black rectangle, before the Dow was ready for the next major impulse move higher that would take it to the 2000 top where our current consolation pattern is forming. The million dollar question we have to ask ourselves is the blue expanding triangle finishing up with the 14 year consolidation pattern or is there still more work that needs to be done to work off the excesses from the previous secular bull market? Again you can see how critically important the price action is that is trading at the top blue rail of the 14 year consolidation pattern.
Below is a 5 year chart of the Dow that shows an important intermediate term top was made in April of each year. Will this year be any different?
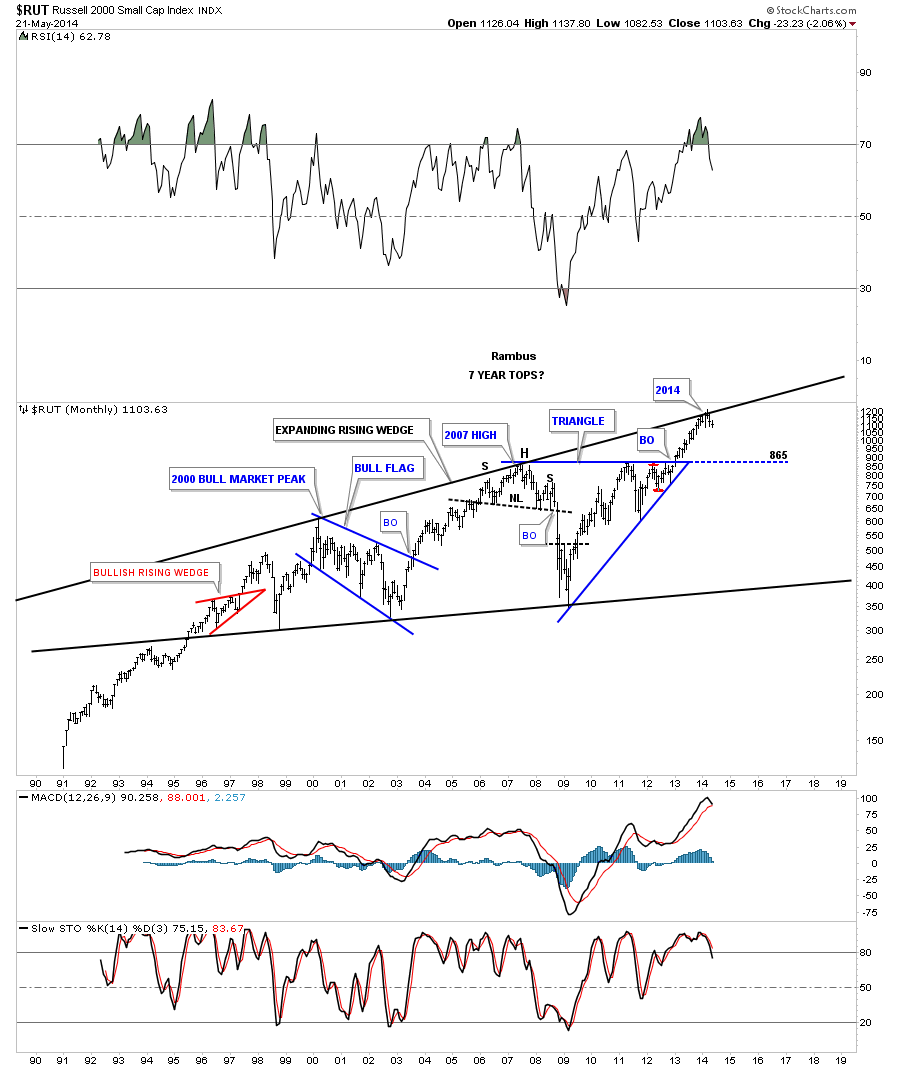
Lets now take a look at the Russel 2000 that is trading up to the top blue rail of its expanding rising wedge formation. As you can see there was a top in 2000, then seven years later another top in 2007 and now we are at the top rail seven years later in 2014. I don’t want to sound like a broken record but this area does look like a good place to try a short trade. As we know there are no guarantees. If we do see a correction I would expect the first line of support to come in around the previous tops at 865 or so.
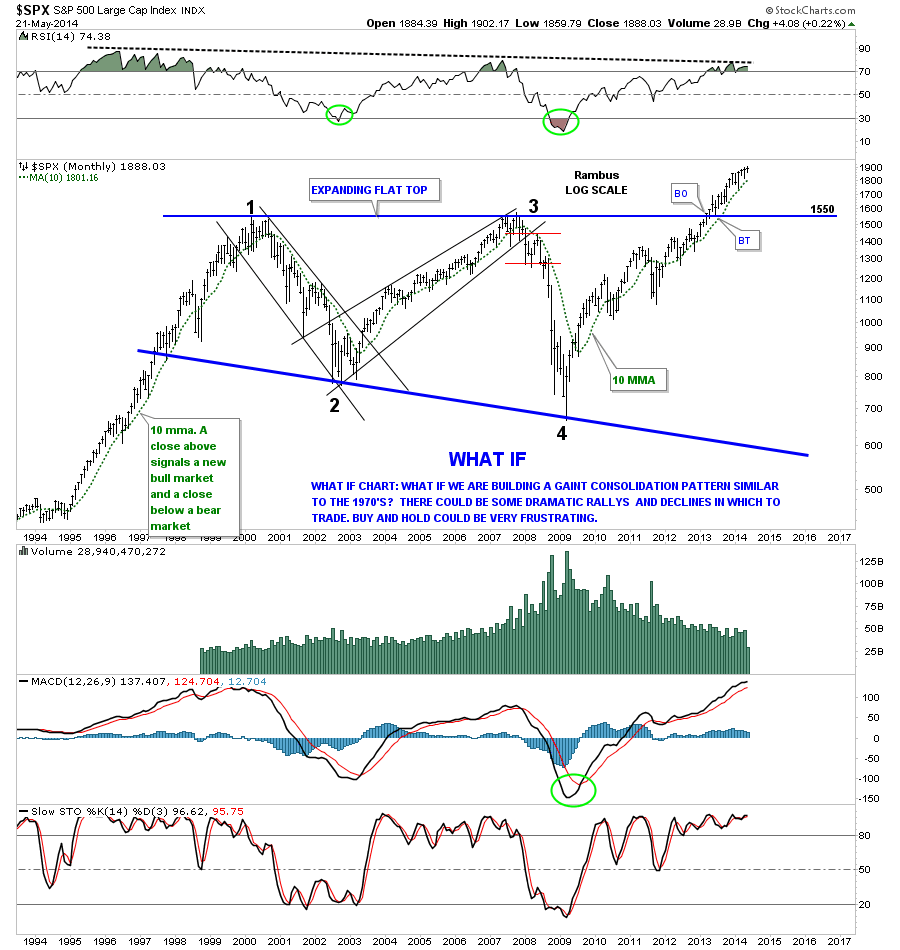
Of all of the stock market indexes the SPX has the most bullish look to it as it has already broken out of its expanding flat top triangle. The only thing lacking to make this chart super bullish is there is no backtest yet. A backtest down to the 1550 area, the old highs, would be a great buying opportunity if the SPX does a backtest.
The monthly chart for the SPX shows its been trading in a rising wedge formation since the bear market low in 2009. There is also a bit of a negative divergence taking place similar to the 2000 and 2007 tops.
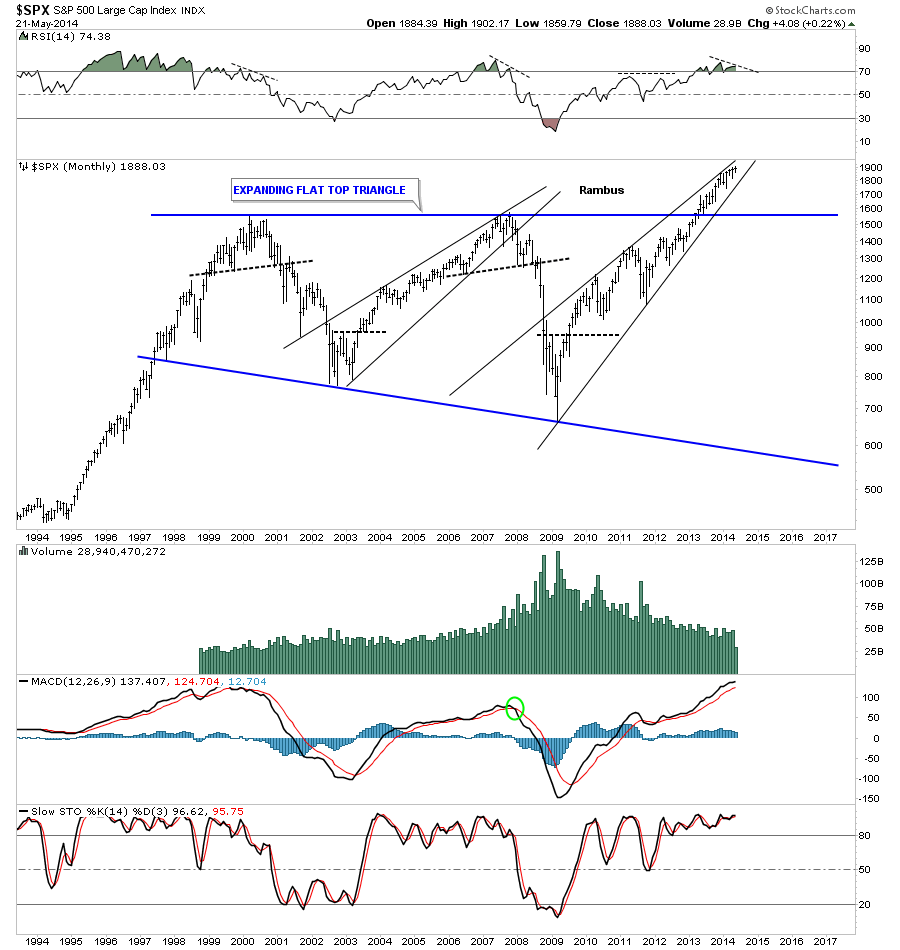
The quarterly chart for the SPX shows it has broken out of its expanding flat top triangle but no backtest so far. As you can see in the 70′s bear market the SPX did have a clean breakout and backtest before it started its secular bull market.

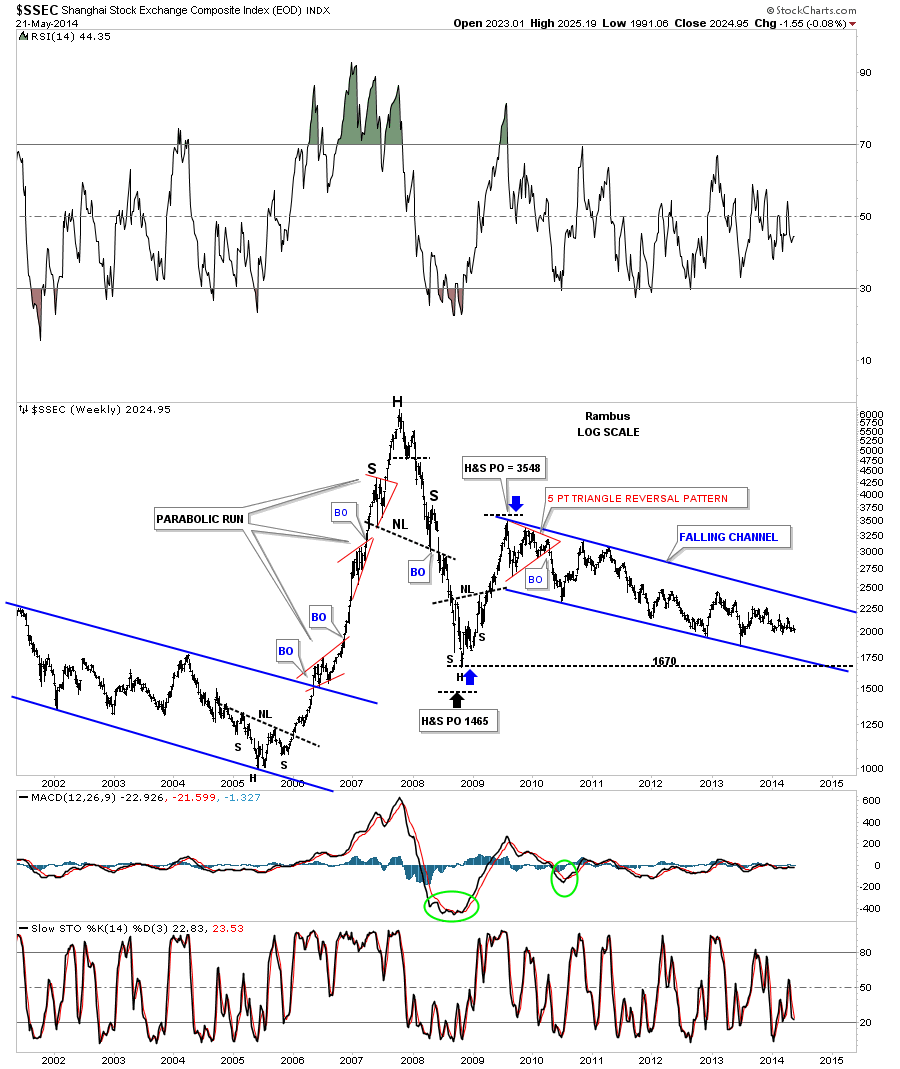
A lot of folks believe China is the cure all for just about everything out there. If China gets moving to the upside commodities will be soaring once again. China is supposed to be buying up all the available gold out there that should be bullish for the price of gold. As you can see on this chart below China has been in the doldrums since it put in its parabolic run in 2007. This is exactly how a stock looks after a parabolic blow off phase. After the initial decline from the parabolic top the SSEC had a counter trend rally back up to 3548 where it has been drifting lower for more than 5 years. There is nothing bullish about this chart.
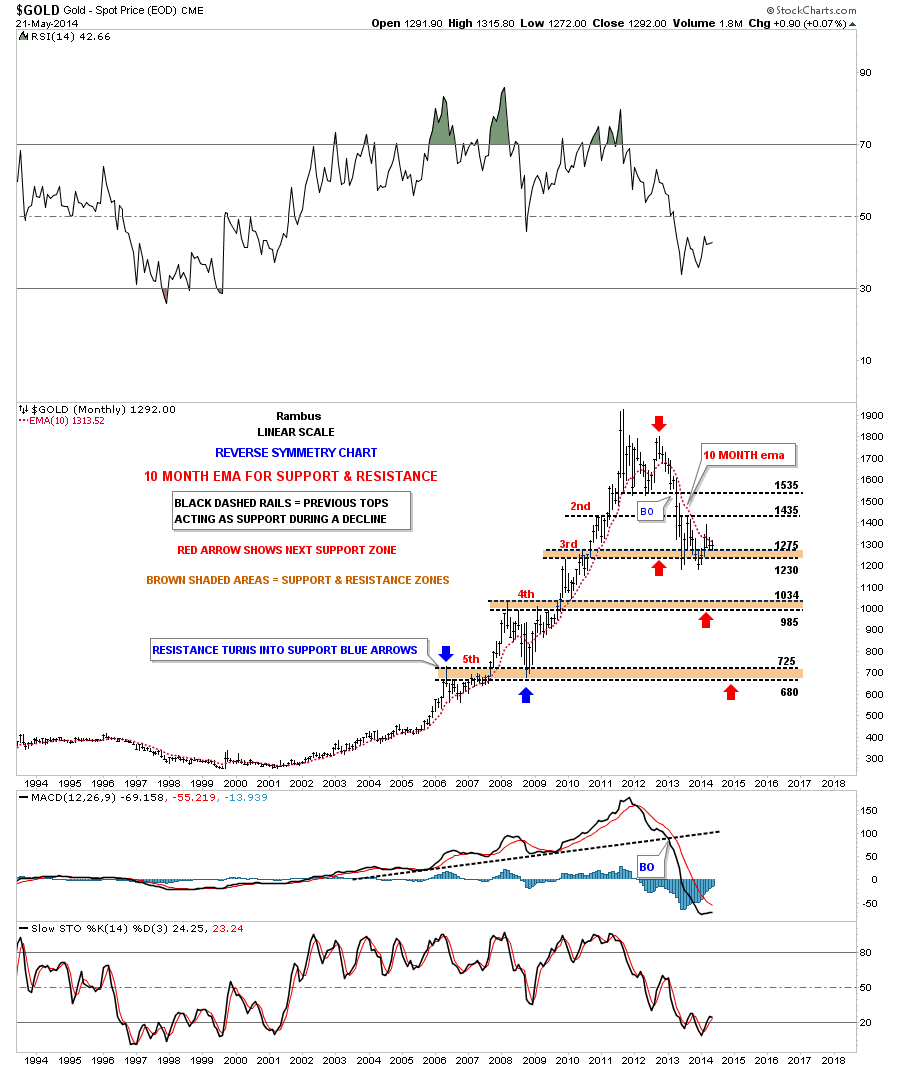
Does gold share the same fate as the SSEC after its parabolic run?
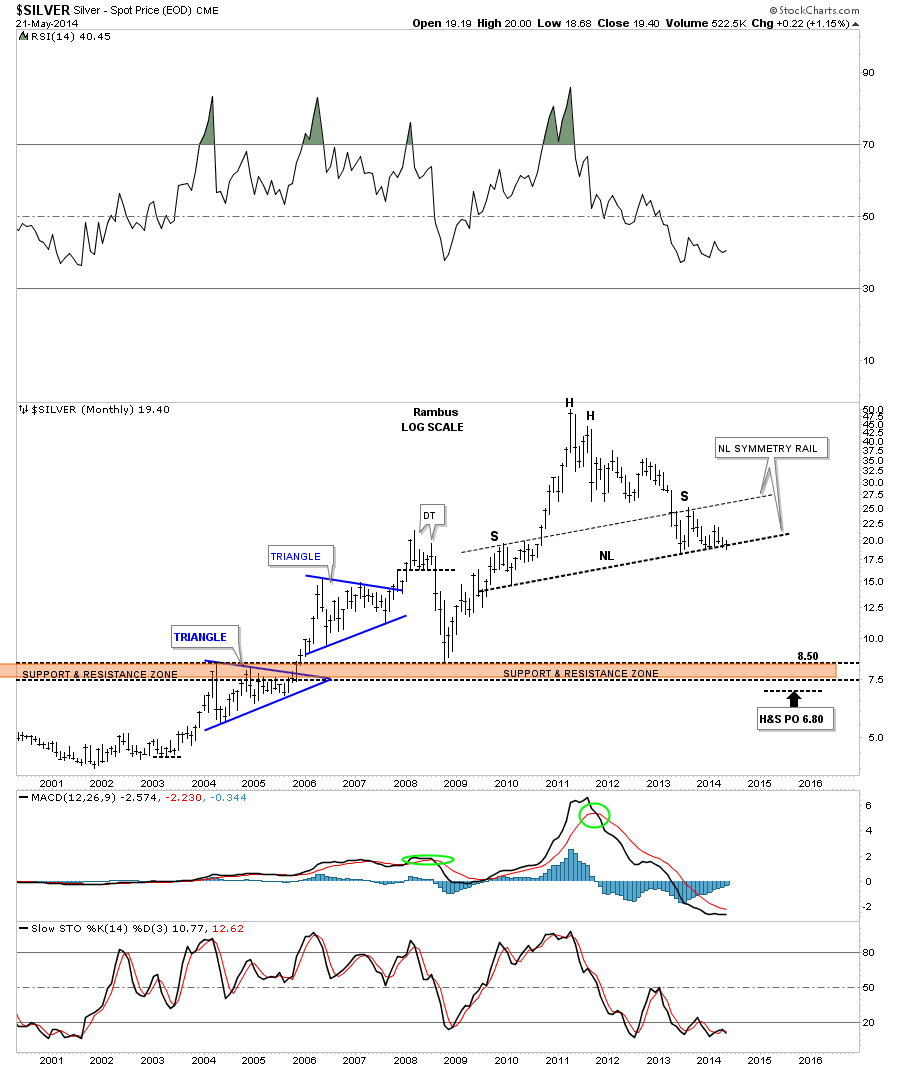
The last chart for tonight is the long term look at silver that we’ve been following for sometime now. Part of the frustration you are feeling with silver is the major support rail its been testing that has a good chance to be a neckline of a major H&S top. Big important trendlines like that don’t give up easily. As you can see this month of May has cracked the neckline but not decisively yet. There is still a week and a half of trading yet before this monthly chart shows the closing price. This is either the best buying opportunity or the greatest short of a lifetime right here and now. You know how I’m positioned. All the best…Rambus

“The risk is quite high over the coming summer months,” Jason Goepfert told me yesterday.
“For investors, I wouldn’t want to make any more additional purchases right now,” he continued. “I would hold back a little bit.”
When Jason talks, I listen…
I rely on Jason – more than anyone else – to help me figure out whether investments are “hated” or not…
Long time readers know that I want to buy “hated” investments. But how do I define hated? What do I look for? And how do I track it?
My go-to source for these answers for years has been Jason Goepfert of SentimenTrader.com.
Jason shared some key insights with me yesterday… and I wanted to pass those along to you today…
Jason tracks investor sentiment. He looks for times when investors are extremely optimistic (so he can sell), or when investors are extremely pessimistic (so he can buy).
Right now, in the U.S. stock market, investor sentiment is becoming overly optimistic. And when you see that, typically the upside potential won’t be good over the next few months. Specifically, Jason has a 1-10 scale of stock market “risk.” And right now, he says the risk level is 7 – “well above average.”
What does that mean? “At a risk level of 7, stocks have returned 1.1% on average over the following three months,” he explained. “For comparison, when the risk level is at 3, stocks have returned 5.4% on average over the following three months.” (That’s based on 10 years of data.)
When the risk level is at an extreme – in the 9 or 10 range – you lose money, on average, over the next three months. We are not at an extreme – yet.
I asked Jason what he looks at to determine whether investors are optimistic or pessimistic. He said he looks at two types of indicators:
- What people are saying (typically sentiment surveys).
- What they are doing (what real money is doing).
He says the “real money” gauges are typically more useful because “people don’t always do what they say they’re going to do in a survey.”
So when you see an extreme in sentiment, what happens next? How quickly do you need to act?
I thought Jason’s answer was interesting…
“Bottoms usually are immediate. When it’s that panic phase, everybody is selling. So when those indicators trigger an extreme, typically the market will bottom within days.”
“Looking at tops is much more difficult… The sentiment extreme typically starts to take effect in one-to-three months’ time.”
In my opinion, Jason Goepfert is the best at what he does. I personally rely on his work.
Right now, Jason says that – based on his main sentiment gauge – the risk is “quite high.”
I wouldn’t bet against him…
Good investing,
Steve
P.S. If you have a serious interest in learning more about investor sentiment, I highly recommend you check out his site, www.SentimenTrader.com. The service is fantastic, and it’s significantly underpriced for the quality of work he does.
MARKET NOTES
THE “OTHER” PRECIOUS METAL LEADS THE PACK

 Yesterday, I laid out the case for a Chinese real estate crisis. Lest I be accused of biased thinking (guilty as charged many times over I am sure), today I am sharing the case for Chinese reform and a relatively smooth transition to a more balanced economy. I agree with GaveKal on this issue (and utilized much of their brilliant research in this piece)—reform in China is required if the leadership’s goal (and we know it is) is to surpass the US economy, challenge the US dollar’s reserve status, and create a solid platform for geopolitical dominance. I shared this essay with Black Swan subscribers last week.
- China slows but succeeds in its reform process. China has already made progress even though growth is decelerating. In fact, the bullish argument doesn’t argue growth is slowing in China; they agree it will likely slow even more (slowing growth is in fact one indication of reform; a surge in growth is likely the result of another blanket liquidity injection leading to more overcapacity, bad loans, and higher speculation that will only make it harder to avoid a financial crisis).
Jack Crooks
President, Black Swan Capital

-
I know Mike is a very solid investor and respect his opinions very much. So if he says pay attention to this or that - I will.
~ Dale G.
-
I've started managing my own investments so view Michael's site as a one-stop shop from which to get information and perspectives.
~ Dave E.
-
Michael offers easy reading, honest, common sense information that anyone can use in a practical manner.
~ der_al.
-
A sane voice in a scrambled investment world.
~ Ed R.
Inside Edge Pro Contributors

Greg Weldon

Josef Schachter

Tyler Bollhorn

Ryan Irvine

Paul Beattie

Martin Straith

Patrick Ceresna

Mark Leibovit

James Thorne

Victor Adair