
Energy & Commodities
Summary
- Platinum, Palladium and Nickel are outperforming the S&P 500 by a wide margin in 2014.
- The relative strength is fundamentally due to declining supply from key regions such as South Africa, Russia and Indonesia.
- Growth for Platinum, Palladium and Nickel is very strong especially in growing economies in Asia which need catalytic converters and stainless steel.
- China has hardly any domestic PGM or nickel production. They must import.
- Focus on advanced PGM/Nickel development projects in stable jurisdictions in North America.
Not all is bad in the metals sector. On the periodic table there are three metals in a column that I will focus on as I believe they will continue to outperform.
Nickel, Palladium and Platinum have been the outperformers in 2014. Palladium is at multi-year highs.
Platinum Group Metals (PGM’s) outperformed the equity markets, 30 year bond and other metals except for nickel in 2014. Nickel is up more than 50% on the year.

Remember South Africa and Russia control the PGM market with over an 80% share of global supply.

Nickel supply was controlled by Indonesia which just announced an export ban.
PGM’s and nickel are outperforming for the following 10 reasons.
1) Ongoing Labor Strikes in South Africa
2) Tensions with Russia and Ukraine
3) Auto sales rising in China to record levels.
4) China requires increasing amounts of PGM’s used in catalytic converters to control air pollution.
5) Indonesia which represents about 25% of global nickel supply has announced export bans. This is comparable to announcing the OPEC nations cutting off oil supply.
6) In emerging economies cities are increasing in population requiriing the building of skyscrapers, pipelines, bridges and power plants which stainless steel is required.
7)Economic sanctions with Russia could be adding to nickel and palladium shortage.
8) Existing PGM and nickel production growth.
9) China the largest growing consumer of these metals have very little from their own domestic production.
10) Very few high quality and advanced mining projects in stable jurisdictions that are in the project cupboard.
In conclusion, focus on either the Platinum (PTM), Palladium (PALL) and Nickel (JJN) ETFs tracking the commodities. If looking for leverage to PGM and nickel prices look at the large cap miners such as Stillwater Mining (SWC) which is the only US palladium producer. Stillwater is making a major breakout into new two year highs.
For more speculative investors looking for outsized gains with additional risk should now study the junior miners who control advanced PGM and nickel projects preferably with Preliminary Economic Assessments and Feasibility Studies in top notch jurisdictions. Most of these stocks are smaller cap and trading on the Canadian Exchanges and will be the focus of additional articles.
By Jeb Handwerger,
Editor http://goldstocktrades.com


(1) Purpose High Interest Savings ET About To Put More Money In Your Pocket (TSE:PSA.CA) triggered: 05/28/2014
Read full article in a new window: Purpose High Interest Savings ET About To Put More Money In Your Pocket (TSE:PSA.CA)
![]()

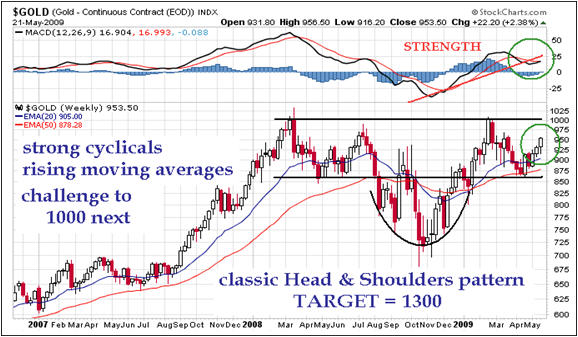
Gold moved sharply lower yesterday after days of indecision. Coupled with the break of the support at 1269, a further short-term decline is likely. A support stands at 1238. Hourly resistances can now be found at 1284 (21/05/2014 low) and 1304 (22/05/2014 high).
Ed Note: As Gold seems to be weakening, in case you missed it, Jim Rogers explains in this Saturday May24th article: GOLD IS A BUY UNDER $1,000 AN OUNCE; HERE’S WHY IT COULD GET THERE: JIM ROGERS

Longer term, we are sceptical that the horizontal range between the strong support at 1181 (28/06/2013 low) and the major resistance at 1434 (30/08/2013 high) is a long-term bullish reversal pattern. As a result, a decline towards the low of this range is eventually favoured.
Silver: Bearish breakout of the support at 19.26.

Silver has broken the support at 19.26, invalidating the recent succession of higher lows. Despite the support at 19.05, a new test of the key support at 18.84 is favoured. Hourly resistances are given by 19.39 (26/05/2014 low) and the declining trendline (around 19.72).
In the long-term, the trend is negative. However, the successful test of the support at 18.84 favours a consolidation phase. A resistance stands at 20.41 (24/02/2014 high). Another key support is at 18.23 (28/06/2013 low).

For some perspective on the post-financial crisis rally, today’s chart illustrates how much of the downturn that occurred as a result of the financial crisis has been retraced by each of the five major US stock market indexes. For example, the S&P 500 peaked at 1,565.15 back in October 9, 2007 and troughed at 676.53 back on March 9, 2009. The most recent close for the S&P 500 is 1,565.15 — it has retraced 139% of its financial crisis bear market decline. As today’s chart illustrates, each of these five major stock market indices has recouped all losses incurred during the financial crisis (i.e. all are above 100% on today’s chart). However, it has been the tech-laden Nasdaq and the often overlooked S&P 400 (mid-cap stocks) that have been the star performers with an impressive 186% gain since the financial crisis lows.

Quote of the Day
“The hidden strength of the U.S. economy has always been the flexibility of our economy to devour the weakest and redeploy that financial and human capital to companies and industries that are great users of capital.” – Tobin Smith
Events of the Day
June 07, 2014 – Belmont Stakes
June 09, 2014 – US Open golf tournament begins (ends June 15th)
Stocks of the Day
— Find out which stocks investors are focused on with the most active stocks today.
— Which stocks are making big money? Find out with the biggest stock gainers today.
— What are the largest companies? Find out with the largest companies by market cap.
— Which stocks are the biggest dividend payers? Find out with the highest dividend paying stocks.
— You can also quickly review the performance, dividend yield and market capitalization for each of the Dow Jones Industrial Average Companies as well as for each of the S&P 500 Companies.
Notes:
Where’s the Dow headed? The answer may surprise you. Find out right now with the exclusive & Barron’s recommended charts of Chart of the Day Plus
Simply enter and submit your email address HERE (we won’t share it with anyone) and you will receive one free chart per week and instantly receive the latest free Chart of the Day.
 Quotable
“The European single currency is bound to fail, economically, politically and indeed socially, though the timing, occasion and full consequences are still unclear […] The most important priority for non-Europeans is to see that European policies do as little harm as possible now or later to the world economy”.
Margaret Thatcher, 2002
Commentary & Analysis
FREE TRIAL: Follow up on GBP/USD…a winning trade.
Last Thursday, 22 May, I told you and showed you this:
The pound has been on a tear as you likely know; for good reason given the surprising rebound in the UK economy. Technically a case can be made the high is in place at 1.6996—time will tell. But given how far and fast the currency has run against the dollar, a decent and “playable” correction would be no surprise. That’s why Black Swan Forex subscribers entered this trade short today—the risk/reward looks quite good. Take a look at our hourly wave chart of GBP/USD:

Here was the recommendation to my Black Swan Forex subscribers on that same day:
RECOMMENDATION: Selling GBP/USD below 1.6855 [last 1.6865]
22 May 2014/7:04 a.m. ET
Issue #1131
I suggest you sell GBP/USD below 1.6855; risking to 1.6906; targeting 1.6552
Jack Crooks
Black Swan Capital
Today I told our subscribers to lock in some open profit, as here is what GBP/USD is doing now; it is testing key support at 1.6729 (so we have about 135 pips open profit on this position now):

We recently grabbed about 78 pips profit on a short AUD/USD position and have re-entered this morning; we have some open profit in short EUR/USD and looking for a gift from Mr. Draghi and are still like USD/CAD long, though we are taking some heat there.
If you would like to sample our forex service, I will set you up for a two week trial and you can see more of what we do and determine if Black Swan Forex could be a resource to help you make real money in the currency market.
Please click here to request a free trial.
We simply need your name and email address.
Thank you.
P.S. The US dollar reserve status and case for a continued bull market webinar went well last Friday. I will be sending a link to view the recording once it is setup by TopStep Trader.
Regards,
Jack Crooks
President, Black Swan Capital
Twitter: @bswancap


-
I know Mike is a very solid investor and respect his opinions very much. So if he says pay attention to this or that - I will.
~ Dale G.
-
I've started managing my own investments so view Michael's site as a one-stop shop from which to get information and perspectives.
~ Dave E.
-
Michael offers easy reading, honest, common sense information that anyone can use in a practical manner.
~ der_al.
-
A sane voice in a scrambled investment world.
~ Ed R.
Inside Edge Pro Contributors

Greg Weldon

Josef Schachter

Tyler Bollhorn

Ryan Irvine

Paul Beattie

Martin Straith

Patrick Ceresna

Mark Leibovit

James Thorne

Victor Adair