
Timing & trends
As the markets set up here, we are in the window for a top. While we’re waiting for weak price action to confirm a trading signal in our QQQ Trader service, this is a good time to start layering on some options and selling covered calls.
On Wednesdays, we start looking at weekly data (written @ 6/4/2014 5:50:23 AM). Here are the primary things we’re seeing in our weekly data:

Probably the most popular and quoted weekly surveys is the Investor intelligence bulls minus bear, which is about as high as it’s been in recent history.
A much less quoted data series, but equally as important:
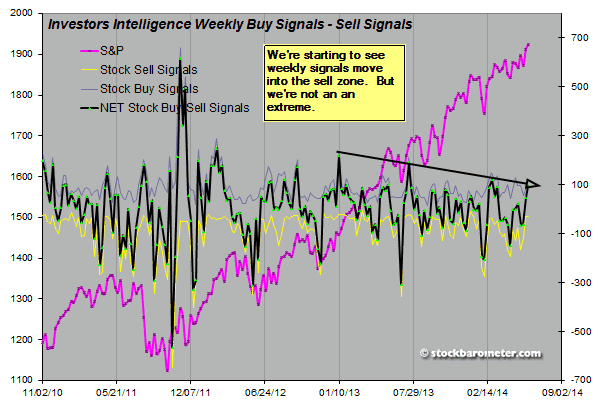
When indicators get to the top of the range, the potential of the market reduces. Also the potential for a move lower increases. Sentiment is pretty bullish here, so the market is even more vulnerable. Accordingly, we’ve recommended 20 or so PUT Option plays in our Stock Option Speculator service. The first 10 are from the Nasdaq 100. And the second 10 are the least efficiently priced options in the market overall. Here’s that list:

Our recommendations are sorted by the bearish percent to double. So the top option has to only move down less than 5% for the option to double in value. Visit www.stockbarometer.com to learn move.
We’ve also released our covered call list for the nasdaq 100, which has about 43 plays, including many popular stocks – if you’re holding them and plan on holding them, why not make some additional change as the market moves sideways or lower! Here’s the bottom of that covered call list:
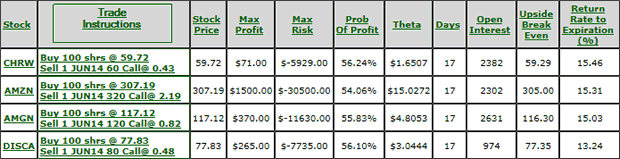
These are ranked by return rate to expiration, annualized. These numbers are pretty low above, but in the top of the list, the numbers are greater than 100%. That’s where you really want to be playing…
For our QQQ Trader Service, we’ll need to see more bearish price action to move us into Sell Mode. We also plan on bringing back a long/short stock service that will align with our timing signals. So stay tuned.
Regards,
Author: Stock Barometer
Stock Barometer is completely independent. We have never and will not ever accept compensation from any company whose stock we recommend.
Our goal is to make you money. We offer you the tools and information to do so and leave it to you, the individual investor, to apply them in the best way possible.

 Think interest rates are going to head higher soon with the Federal Reserve’s bond tapering program?
Keep dreaming…
The Fed is still buying tens of billions of dollars in bonds, which will continue to drive down rates. And the money supply is still increasing – just at a slower pace.
So the 10-year U.S. Treasury bond – which is yielding just under 2.5% – is bound to head lower still.
Of course, the United States isn’t the only country seeing lower rates…
The bond yield in Germany and France is actually more than 100 basis points below the United States’ 2.5%.
And in Italy and Bulgaria, the bond yield is only 50 and 75 basis points higher than in the United States, respectively.
With lower rates around the globe, two immediate concerns should come to mind…
Concern #1: Sluggish Growth Ahead. Low yields are usually a signal of slow growth in the months and years ahead.
Indeed, the only major global economy that’s growing right now is the United States. And even our economy experienced a setback with the latest GDP numbers, which showed a decrease in GDP in the first quarter by 1% (after a 2.6% increase in the fourth quarter of 2013).
Now, the decrease can be attributed to a harsh winter that forced many to curtail spending. But in a strong, growing economy, negative GDP numbers should never occur.
However, uneven growth is still preferable to the rest of the world – where markets like China are showing signs of a real slowdown in spending and consumption.
Concern #2: Are Oil Prices in Trouble? Shrinking GDP numbers and decreasing yields from the bond market can signal danger ahead for oil price growth.
But is it time to sell your oil stocks? Heck, no!
Granted, at best, the oil market will stay static from here – or grow slightly.
At worst, we’ll see oil prices tick down into the $90s, as there’s no lack of supply in the market. U.S. oil production is nearing the same levels as the boom times of the ‘70s. And Middle Eastern oil facilities are pumping out as much oil as they can, since their concerns are related more towards making money for their oil-financed economies.
The picture for oil prices might not look as robust as it did just a few months ago – when the global geo-political situation was in flux and the United States was in the midst of a stronger recovery. But it’s definitely not time to sell!
Holding Out Hope for a “Goldilocks Recovery”
There’s a chance that we’ll see a “Goldilocks recovery” – or an economy that’s “just right.”
In that case, global economies will respond to the cheap money and continue to post growth (albeit nothing spectacular).
That would support oil prices in a range of $90 to $110 – levels high enough for all to continue to make money and pay out dividends
If you’re looking for true earnings growth from the energy complex, though, you need to be investing in integrated oil and gas companies.
These opportunities will continue to benefit from the resurgence of natural gas prices, which are the standout in the energy sector today.
In an upcoming issue, I’ll feature a couple of my favorite plays in the sector.
And “the chase” continues,
Karim Rahemtulla
About Karim Rahemtulla
We’re currently in the midst of a “global resource chase.” So says Oil & Energy Daily’s Chief Investment Strategist, Karim Rahemtulla – a 20-year veteran of the global financial markets. What’s more, this increasingly intense chase for power and energy means there’s no better time to be an oil and energy investor. And with Karim on your side, you’re in great shape to profit. Learn More >>

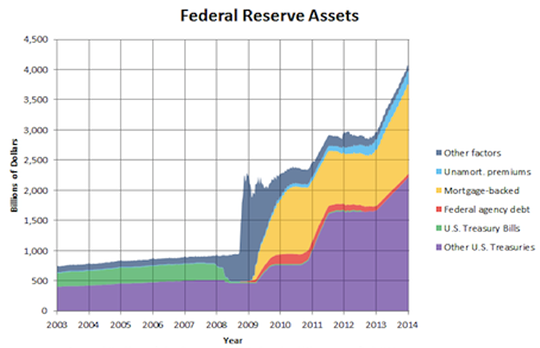
The response by central banks to the 2008 crash has been unprecedented.
As you can see from the chart below, the Fed’s balance sheet has ballooned to more than $4 trillion – or about one-quarter of annual GDP.
Legendary investment manager Jeff Gundlach, of DoubleLine Capital, has an investment rule that every prudent investor should be aware of.
He calls it Gundlach’s Rule of Investment Risk.
It holds that efforts to limit economic volatility in the near-term don’t eliminate risk. Ultimately, the “fixes” end up causing much larger problems further down the line. As he explains:
If you run things and you try to get them very smooth, without ever any downside, you’re trying essentially to eliminate the frequency of problems. I believe the frequency of problems times the severity of problems when they occur equals a constant. Frequency times severity equals a constant. That is Gundlach’s Rule of Investment Risk. When you try unnaturally to push into the future problems, and quantitative easing is designed to do that, you end up increasing the severity of the problem.
In other words, you can have two scenarios: (1) frequent, yet shallow recessions or (2) infrequent, yet deeper recessions.
The Fed, the Bank of England, the Bank of Japan and the European Central Bank have all gone for option No. 1.
If Gundlach is right, that means a much more severe problem down the line.
Further Reading: Bonner & Partners senior analyst Braden Copeland has prepared a special report for investors worried about the next crash… and what to do when it comes. Braden details six stocks to buy and hold in the next panic. Find out what they are here.

Quotable
“It ain’t over till it’s over.”
Yogi Berra
Commentary & Analysis
Dow Jones Industrial Average Daily [last 16,711]: In a modified wave methodology, larger wave patterns are counted as three wave moves—consistent with Dow Theory (whereas Elliott Wave looks at 5 waves to make up a sequence). In the chart below, the measuring distance or projection of Wave C (blow-off rally in the Dow Jones Industrial Average) targets 16,817. I had calculated that target a while back, but honestly didn’t believe we’d see the Dow move this high. That’s what you get from not believing in your charts.
At 16,817, wave A and C are equivalent—this is the highest probability target using a three-wave approach; but obviously it is no Holy Grail. “Nobody rings a bell at the top.” “Top picking is a mug’s game.” But, this technical analysis suggests we are getting very close to a major top.
Also notice on the chart (below) the interesting divergence pattern between price and momentum we saw last time we got a decent correction back in 2011.
Larger image Click HERE

Click HERE & scroll down a bit for a larger chart, further & a June 2nd article on USD/EUR
If you would like to sample our forex service, I will set you up for a two week trial and you can see more of what we do and determine if Black Swan Forex could be a resource to help you make real money in the currency market.
Please click here to request a free trial. We simply need your name and email address.
Thank you.
P.S. The US dollar reserve status and case for a continued bull market power point presentation has been posted to our homepage at the top: www.blackswantrading.com
Regards,
Jack Crooks
President, Black Swan Capital
Twitter: @bswancap


-
I know Mike is a very solid investor and respect his opinions very much. So if he says pay attention to this or that - I will.
~ Dale G.
-
I've started managing my own investments so view Michael's site as a one-stop shop from which to get information and perspectives.
~ Dave E.
-
Michael offers easy reading, honest, common sense information that anyone can use in a practical manner.
~ der_al.
-
A sane voice in a scrambled investment world.
~ Ed R.
Inside Edge Pro Contributors

Greg Weldon

Josef Schachter

Tyler Bollhorn

Ryan Irvine

Paul Beattie

Martin Straith

Patrick Ceresna

Mark Leibovit

James Thorne

Victor Adair