
Gold & Precious Metals
“As has been the case often lately, the precious metals are positive in pre-US open. These have tended to be fleeting positive vibes, but we should keep the technical parameters in view nonetheless because a) you don’t want to buy (or at least hold) a sucker bounce and b) just maybe the forces of right and good will one day break out of this funk. So we should stay tuned up on what constitutes bull and bear in the precious metals.” – From the last eLetter dated 5.22.14 (pardon the duration between letters):
The precious metals complex eventually broke down, testing the support in gold, silver and notably the critical HUI parameter of 205 also noted in that update. This parameter is the one that keeps the potential for a weekly bottoming pattern in play.
Gold stocks rallied today. So is this something real?
Stockcharts.com is down today, but we used backup Barchart.com to post a couple charts of GDX at the website, illustrating a potential bear flag, low volume and resistance on the daily chart: Gold Stocks at Resistance.

As you can see, the daily chart is at important resistance. It is considered a bear flag until this zone is successfully cleared, preferably with some conviction (read: volume).

Why do we continue to work this sector? Well, it sure is not due to current fundamentals (a subject for another day… or every week in NFTRH). It is due to the ongoing potential that GDX/HUI have been forming Inverted Head & Shoulders bottoming patterns and that technicals would lead fundamentals.
So I wanted to call your attention to the fact that GDX has not proven anything yet, despite today’s bullish activity and indeed the entire bounce of the last week, which we have been anticipating. The daily chart is the key to the weekly because if the bounce continues and morphs into a rally that starts clearing resistance levels, then the weekly pattern takes over… and it is bullish.
First things first, however.
Some notable posts at the website since the last eLetter:
- Two Sentiment Pictures A view of low mutual fund cash and gold and silver discounts of 6.5% (June 10)
- Pivotal Events from Bob Hoye (June 9)
- Bears Say “Rut Roh” The Russell 2000 (RUT) breaks out (June 5)
- Government’s Disastrous Reign Over US Money EWI on the grizzly details, includes a free report from Prechter. (June 3)
‘
Thank you again for reading. If you’d like an affordable weekly guide (with interim TA and Trading updates as needed) that is always on the job for its clients’ best interests, I’d be more than happy to welcome you to the Notes From the Rabbit Hole Premium subscriber base. –Gary Tanashian
“Many thanks for a really consistently great service.” –John C 6.5.14
Biiwii.com
Subscribe to NFTRH (premium)
Subscriber Testimonials
Twitter @BiiwiiNFTRH
About & ToS
Biiwii.com does not recommend that any trading or investment positions be taken based on views expressed in this eLetter. If you speculate or invest it is suggested that you consult a financial adviser qualified in your area of interest. See full Terms of Service (ToS) above.

DOW + 3 on 550 net declines
NASDAQ COMP +2 on 400 net declines
SHORT TERM TREND Bullish
INTERMEDIATE TERM TREND Bearish
STOCKS: We finally had a decline of sorts. The Dow was down almost 50 points, but the tendency to buy every two hour decline is still prevalent. This is the type of psychology that happens before more serious tops.
One of these days investors are going to buy a decline and it won’t rebound. I don’t think it’s going to be all that far off. Be sure to examine the chart.
GOLD: Gold was up $7.
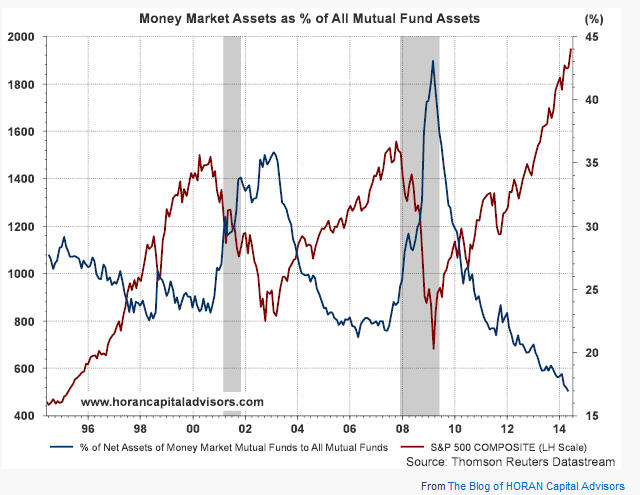
CHART: We keep hearing that there is a lot of cash on the sidelines and that this is one reason for the rally. Not if you look at money markets assets as a percentage of all mutual fund assets. This chart tells us that we are in danger of running out of money. Note how high it was when the market was at a bottom.
TORONTO EXCHANGE: Toronto was up 33.
S&P\TSX Venture Comp. The Venture Comp. was down 1.
BONDS: Bonds moved lower again.
THE REST: The dollar was higher as was silver, copper and crude oil.
BOTTOM LINE: Short Term Bullish – Intermediate Term Bearish
NEWS AND FUNDAMENTALS:
There were no important economic releases on Tuesday and there will be none on Wednesday.
Monetary conditions (+2 means the Fed is actively dropping rates; +1 means a bias toward easing. 0 means neutral, -1 means a bias toward tightening, -2 means actively raising rates). RSI (30 or below is oversold, 80 or above is overbought). McClellan Oscillator ( minus 100 is oversold. Plus 100 is overbought). Composite Gauge (5 or below is negative, 13 or above is positive). Composite Gauge five day m.a. (8.0 or below is overbought. 13.0 or above is oversold). CBOE Put Call Ratio ( .80 or below is a negative. 1.00 or above is a positive). Volatility Index, VIX (low teens bearish, high twenties bullish), VIX % single day change. + 5 or greater bullish. -5 or less, bearish. VIX % change 5 day m.a. +3.0 or above bullish, -3.0 or below, bearish. Advances minus declines three day m.a.( +500 is bearish. – 500 is bullish). Supply Demand 5 day m.a. (.45 or below is a positive. .80 or above is a negative).
No guarantees are made. Traders can and do lose money. The publisher may take positions in recommended securities.

 Marc Faber told Bloomberg in an interview that he will “never sell his gold” and that “I buy more every month.”“The momentum sell-off has caused internal market damage” and “svery asset in the world is over-inflated right now…”
Faber warns.“If one analyzes the data carefully” it is clear that “China is growing at most 4%.” Given the“gigantic credit bubble” the outlook is not hopeful as the sharp deceleration in growth is likely to continue.
Faber also has strong words for Western nations treatment of the rest of the world and “the US will have to back off.. because China is so important.”“I like the concept of Bitcoin”… “Bitcoin has its merits since you may not be able to carry gold across borders,” Faber said.“People think they know what the future holds… and what Central banks are up to.. they don’t… I will never sell my gold and I buy more every month… I would not be short gold,” Faber said.
…more from Marc:
Mario Draghi Easing More Important For Europe Than Emerging Economies
Just when you thought The Bakken couldn’t get any better—it does.
Oil producers are now “cracking the code” on the Torquay, or Three Forks formation below the Bakken, and coming up with incredible economics—these wells are paying back in only seven months.
This news has completely re-invigorated the Canadian side of the Bakken. And on the US side, the Three Forks is causing industry to leap-frog estimates of the amount of recoverable oil available–by about 57%!
It’s hard to imagine that the #1 oil play in all of North America could have such a huge increase in size—usually this happens in increments. This map from the Province of Manitoba shows how much potential the Torquay/Three Forks has—it ranges from 1.5 – 7 x as thick as the Bakken!

Results from Crescent Point Energy (CPG-TSX/NYSE) in Canada and Continental Resources (CLR-NYSE) on the US side of the border are showing this could be an incredible discovery. The Torquay/Three Forks could prove to be another multi-billion barrel catch for the North American oilpatch.
Now when I say discovery; what I really mean is the industry has discovered how to produce from it profitably. The industry has known it’s potential for several years now. But the Bakken source rock itself has been so prolific, there wasn’t much incentive to drill deeper and go through a new learning curve at the Three Forks.
On April 14 Crescent Point Energy (CPG-TSX) announced a Torquay discovery in its core Flat Lake area in southeast Saskatchewan, right along the US border. In just 12 months, the company grew production from 0 to over 5,000 boe/d by drilling 36 wells. These are low-decline, high-rate-of-return wells that payout in less than 7 months.
(A 7 month payback is incredible. It’s the simplest measurement for retail investors to know how good a play is. I like to see 12-15 month payouts, and don’t like to invest in plays that have more than 18 month payouts.)
CPG says each well costs $3.5 million all-in on a 1–mile horizontal. These well economics are fantastic:
1. More than $73/boe in operating netbacks (netback=profit per barrel)
2. A recycle ratio greater than 6–that’s profit divided by costs. That’s 6 times your money! 2 is good; 6 is great!
3 Generates an IRR > 300%. I like to invest in anything over 70% IRR.
CPG believes the Flat Lake Torquay discovery has the potential to match its core, Viewfield Bakken play in southeast Saskatchewan. The oil field is estimated to hold 4.6 billion bbls OOIP. 
This eye catching news triggered an acquisition spree; Crescent Point was the first mover with the acquisition of privately held CanEra Energy with 10,000 boe/d and a large Torquay land position only 10 days after its discovery announcement.

Crescent Point’s acquisition locked in more than 880 net sections of Torquay potential land with more than 280 net sections in its delineated core area. The largest Bakken producer in Canada is positioning itself to become the number one Torquay player.
Legacy oil and gas (LEG-TSX) and Vermillion Energy (VET-TSX) have also made acquisitions of their own buying up privately held companies with land in the emerging play at Flat Lake—all at high metrics of over $100,000 per flowing barrel.
Production out of the Torquay/Three Forks has a lot more history on the US side of the border.
GEOLOGY BACKGROUND
The Bakken formation is located within the Williston Basin encompassing 25,000 square miles across southern Saskatchewan, upper Montana, upper North Dakota and western Manitoba. Unlocking this formation propelled North Dakota from the 9th largest oil producer in 2006 to no 2 behind Texas with more than 900,000 barrels of oil per day.

The Bakken formation is actually three layers of rock—Upper, Middle and Lower–and is situated above theTorquay/Three Forks. The underlying Torquay actually has four layers of tight rock identified as TF1 (upper layer), TF2, TF3 and TF4 (deepest layer).
Last year, the US Geological Service (USGC) updated its assessment to include the upper part of the Torquay, about 50 feet in thickness. For the two formations, the US Geological Service USGS estimates mean recoverable oil resources of 7.38 billion barrels. Estimates for the Torquay account for 3.7 billion bbl.
These estimates seem very conservative to Continental Resources; the largest acreage holder in the Bakken is more optimistic about the total amount of oil that could ultimately be recovered.
In its own assessment, Continental believes that including the deeper parts of the Three Forks increases the total amount of oil originally in place (OOIP) from 577 billion barrels of oil to 903 billion, and the amount that is technically recoverable from 20 billion barrels to as much as 32 billion, 36 billion or even 45 billion.

Only the upper layer (TF1) of the Torquay has been de-risked leaving the remaining 3 layers up for exploration. Continental has a pretty good reason to be optimistic. The company got impressive IP rates from drilling into the lower layers of the Torquay/Three Forks formation in McKenzie Country, North Dakota.
In its Q1 release, the company reported drilling eight new wells (two in each of the MB, TF1, TF2 and TF3) with a combined maximum 24-hour initial rate of 22,460 Boe per day or 2,810 Boe per day per well.

Continental also reported that seven newly completed TF2 and TF3 initially produced at approximately 285 Boe per day in its Tragsrud Unit in Divide County, ND. That’s right across the border from the Flat Lake area.
For Continental the play is simply getting bigger and better. But despite these successes, the Torquay remains largely unexplored. Continental barely scratched the surface of this play as more wells will be needed to test the deeper layers of the formation.
For all this positive news, it’s important for investors to remember that the Torquay/Three Forks is still in its early stages and different areas and formations may respond differently. The Torquay is as much as 270 feet thick in the central part of the basin.
In Canada, the formation is shallower but with similar thickness. This translates into lower drilling & completion costs per well than the other side of the border.
The Torquay is heating up with the potential for being the next big light oil resource play. The size of the prize is just too big to ignore and bodes well for other smaller players in southeast Saskatchewan like Painted Pony (PPY-TSX) Spartan Energy (SPE-TSX), Legacy Oil and Gas (LEG-TSX), TORC OIL & GAS (TOG-TSX), Surge Energy (SGY-TSX), Vermillion Energy (VET-TSX) and Lightstream Resources (LTS-TSX).
In the US, companies like Amazing Eagle Energy (AMZG-OTCBB), Emerald Oil (EOX-NASD) and Triangle Petroleum (TPLM-NASD) stand to benefit from Torquay/Three Forks development.
To conclude, the Bakken was the hottest oil play in North America last decade. Investors made fortunes with the Bakken in its early years and a similar investment scenario may now unfold as the Torquay/Three Forks zone gets increasingly tested in the coming months.
PS–for small producers, payback times for a well really matter. I’ve found a producer whose core play has wells that often pay out in just six months–and don’t decline much at all! They are growing production and cash flow quickly, without growing the number of shares out. That’s the leverage I like. And it’s starting to perform. Click here to learn why I like this company so much.
The first chart is the gross short positions in Gold (as a percentage of open interest). This has accelerated in recent weeks. It was quite low a month ago.

Sticking with Gold, here is a look at our junior gold stock index against Gold. The index contains 20 stocks and most of the stocks are part of GDXJ. Gold is plotted in black and the ratio is plotted in blue. We know that the stocks versus the metals can be an important leading indicator for the sector. The stocks led the metal higher in 2006 and then turned down in spring 2007. Also note that the ratio kept rising in 2009 as Gold consolidated before breaking $1000/oz. The ratio declined sharply as Gold went parabolic. The ratio bottomed in summer 2013 and made a higher low before reaching a 14-month high.

Next here is our silver stock index against Silver. Silver is plotted in black and the index is plotted in blue. The stocks have consistently led Silver at key turning points. The stocks have been weak during the recent decline. The ratio has declined quite a bit. However, it was just at a 16-month high and appears to have bottomed.

Anyway, the stocks/metals relationship is a leading indicator but it isn’t necessarily an imminent leading indicator. It’s one of many things we like to keep an eye on. Nevertheless, we are nearing the end of the bear market and it’s a positive sign that these ratios are showing a positive divergence. That wasn’t the case at the last two bottoms. The stocks showed quite a bit of relative strength during the December to March period, reaching 14 and 16 month highs respectively (against the metals). It’s a reason to think that when the metals finally do bottom, look out above!
Thanks for reading. I wish you all great health and prosperity in 2014.
-Jordan
These are just three of many charts included in premium update #364 which was 30 pages. These charts are an example of the kind of charts we provide. We like to provide charts from which you can draw an insight or conclusion from. When we provide top-notch research and analysis, our subscribers can become better educated and empowered. They don’t need us to voice our opinions because we are providing actionable charts, information and analysis.
As we’ve noted in recent weeks, we’ve made some changes to our premium service that I’m very excited about. I think the quality of our premium service is now higher and with subscribers able to follow our trades (knowing our plans in advance) in the new portfolio, I expect our and their performance to be better. Click below to learn more about our service and watch the new video for details.
Disclaimer: Sponsor Companies are paid sponsor companies of TheDailyGold.com website and this free newsletter. Do not construe sponsorship with a recommendation. The author of this newsletter is not a registered investment advisor. This newsletter is intended for informational and educational purposes only and should not be considered personalized and individualized investment advice. Investment in the precious metals sector contains significant risks. You should consult with an investment advisor and due your own due diligence before making any investment decisions. This email may contain certain forward looking statements which are subject to risks, uncertainties and a multitude of factors that can cause results and outcomes to differ materially from those discussed herein.

-
I know Mike is a very solid investor and respect his opinions very much. So if he says pay attention to this or that - I will.
~ Dale G.
-
I've started managing my own investments so view Michael's site as a one-stop shop from which to get information and perspectives.
~ Dave E.
-
Michael offers easy reading, honest, common sense information that anyone can use in a practical manner.
~ der_al.
-
A sane voice in a scrambled investment world.
~ Ed R.
Inside Edge Pro Contributors

Greg Weldon

Josef Schachter

Tyler Bollhorn

Ryan Irvine

Paul Beattie

Martin Straith

Patrick Ceresna

Mark Leibovit

James Thorne

Victor Adair