
Timing & trends
Through innovation, the physical footprint of technology is becoming smaller day-by-day, and nanotech is the extreme. Nanotech is a vast overarching umbrella for technology in many industries (including energy, biotech, warfare, etc.), and it is garnering significant interest from both the private and public sector.
Nanotech’s reach in a wide range of industries is creating radical innovation across the board. Perhaps the most significant impact of nanotech is in health and medicine. Nanotech is being utilized in various forms of cancer treatment and it is progressively succeeding in fighting the deadly disease. Researchers have achieved promising results by applying gold nanoparticles to cancerous cells and heating the gold by using infrared lasers. In contrast to removing cancerous cells through surgery, this procedure is non-invasive and does no harm to healthy cells. Nanomedcine is a growing and promising industry. By some estimates, the market has the potential to be worth $177 billion by 2019.
Ray Kurzweil, renowned futurist and Director of Engineering at Google, has an interesting insight for the future of nanotech: “By the time we get to the 2040s, we’ll be able to multiply human intelligence a billionfold. That will be a profound change that’s singular in nature. Computers are going to keep getting smaller and smaller. Ultimately, they will go inside our bodies and brains and make us healthier, make us smarter.”

Original infographic from: Jabil

No pain, no gain. That is one comment regarding this seemingly terminal bottoming process in the precious metals complex. Multiple times as soon as conditions have strengthened enough for us to anticipate a breakout, the miners have put in a bearish reversal. At the same time, the metals and especially Gold have failed to gain any real traction. Throughout the past year we’ve been looking for that final low in Gold but it has eluded us multiple times. The recent reversal in the gold and silver miners coupled with a continued technical downtrend in Gold suggests that more pain is coming before sustained gain.
Gold and Silver miners have made some progress over the last year. As evidenced by our top 40 index, the best companies have bottomed with little question. The various indices put in a higher low at the end of May and rebounded with gusto. Daily momentum hit levels not seen since 2012. Meanwhile, the miners have outperformed the metals and closed the recent quarter at the highs. That did not happen in past quarters. However, the miners failed to break resistance and are now reversing their course yet again. We plot GDXJ (large juniors), GLDX (explorers) and SILJ (silver juniors). Note how they’ve reversed a near breakout two weeks ago.
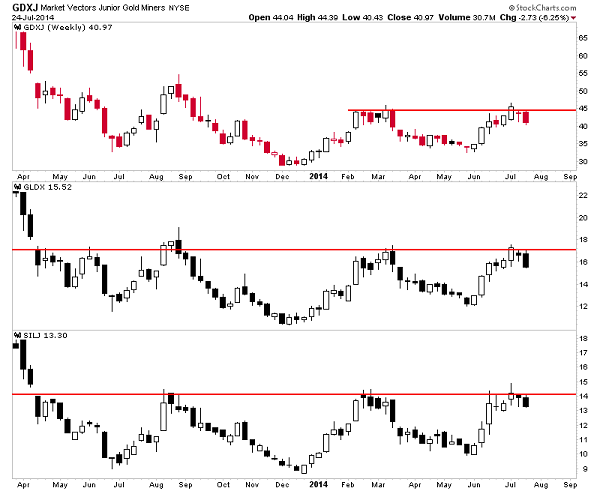
The message of the miners, as we posited last week is that Gold’s final bottom is ahead rather than behind. Had the miners blasted through resistance then it would have indicated a final bottom for Gold was in place. This view is also confirmed by the action in Gold itself. Gold peaked at $1346 and thus failed to come close to its March high at $1392. Last week Gold formed a bearish reversal and engulfed the previous three weeks of trading. A lower high and strong weekly reversal in Gold is a warning that more downside potential lies ahead.
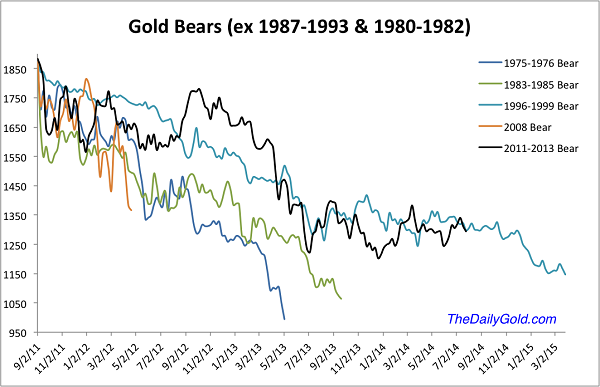
The Gold bears analog chart below (which excludes the most extreme bears in price (1980-1982) and time (1987-1993) shows that the trajectory of the current bear is similar to that of the 1996-1999 bear. In other words, this current bear is in line with history. The most severe bears in price tend to be the shortest while the most severe bears in time tend to be the smallest in price. The current bear is somewhat more severe in time than price.
The key support levels to watch in Gold on a weekly basis are $1250 and $1200. A close below $1250 would bring about a test of $1200 while a break below $1200 could usher in that final capitulation that has eluded us.
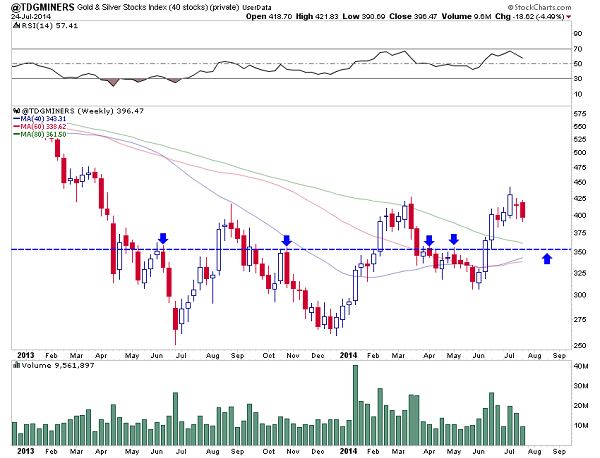
With regard to the miners (GDX, GDXJ, etc), keep an eye on the 200-day moving averages as well as the May lows. GDXJ would have to decline 10% to test its 200-day moving average and 20% to fall below its May low. Last week we noted 370 as support for our top 40 index seen below. The weekly chart shows long-term moving averages coalescing near a key pivot point of 353. That is about 11% downside.
This has been a difficult and confusing last year due to the disparity between the leading gold and silver stocks and the metals themselves. More hints of a bottom have come with each successive advance yet Gold in particular has not obliged. Our top 40 index shows that the worst was over for most quality companies a year ago. The index is up roughly 60% from that point and has endured two big corrections while making higher highs and higher lows. Select companies have vastly outperformed the metals.
However, we must give the Gold bears credit. They’ve been on the right track with respect to the metal. The risk has flipped again as Gold has likely started its final decline. This figures to pull the mining stocks down one last time before their fledgling bull market begins in earnest. The stocks that hold up the best during the selloff could be primed for leadership in the fall. We invite you to learn more about our premium service in which we highlight the best junior companies and trade and invest a real portfolio for subscribers benefit.
Good Luck!
Jordan Roy-Byrne, CMT


Oh yeah and there is a lot of perspective out there!
This is stated anecdotally with the growing list of headlines recording reckless financial and policy behaviour. This is being accompanied by technical measures of the action in stock and bonds that confirm compulsive behaviour by investors and central bankers.
And as the saying goes, “The tattoo machine does not have an eraser”. So both the technical and anecdotal sides are indelibly recorded.
And what we are seeing is “ending action”, which will be reviewed in our usual sections.
All players should be working to make sure they are on the right side of posterity on the developing contraction.
The quip in our shop yesterday morning was that the bond future, crude oil, most other commodities and precious metals get to trade from “overbought” to “oversold”, and back. Junk bonds and the S&P get to go from “overbought” to “overbought”.
The latter is outstanding and is becoming very precarious.
As individuals, some central bankers have been uttering cautionary statements and could be showing their concerns about personally being on the right side of financial history. However, the reversal, as in previous examples, won’t be due to a material change in Fed policy. The “taper” is in the market and we don’t consider it or the buying program to be instrumental in any market change. It has added to the confidence of the leveraged crowd, which behaviour will time the reversal. The Fed won’t trigger the reversal but once the credit markets start to change there will be FedSpeak about increasing rates. This will be an attempt to look in charge of the markets.
As the mania for risk fades, the bond future continues its rally. The low was 134.85 set early in the month and it has made it to 138.25 today. There is some resistance at this level. However, the action is not overbought and around 140 seems possible.
Going the other way, JNK set its high at 41.62 on July 24th and has declined to 41.15 earlier today. This has had a pause so near-term support has been taken out. Also taken out is the 50-Day ma that has provided support a couple of times this year.
Taking out the 40-Week, which is around 40.25 would signal serious trouble in global credit markets.
The low in the DX with the financial party cycle was set at 78.93 in early May. Of importance is that this week’s rise has broken above both the 50-Day and 200-Day moving averages. At 80.6 now, rising through resistance at 80.9 would be a significant breakout.
This would also signal a step towards the next contraction.
The anti-Fed crowd which includes gold and silver bugs still believes that with the full catastrophe, the dollar will crash to zero. History suggests otherwise. A catastrophe of any dimension will be highly inflated assets going down as the dollar heads up.
Last week we changed our positive on the Canadian dollar to negative. Friday accomplished a big reversal from 94.10 to 93.3. At 93 now, both 50-Day and 200-Day moving averages are at 92.6. Taking that out would suggest a decline to support at 91.
“[The] 1901 [bull market] was . . . speculative demonstration based . . . on the assumption that we were living in a new era; that the old rules and principles and precedent of finance were obsolete; that things could safely be done today which had been dangerous or impossible in the past. The illusion seized on the public mind in 1901 quite as firmly as it did in 1929. It differed only in the fact that there were no college professors in 1901 who preached the popular illusion as their new political economy.” – Alexander Dana Noyes, 1930
In the 1920s, Noyes was the pre-eminent financial journalist in America and his backward look on the 1929 Bubble is a classic. It is doubtful that he could imagine anything as reckless as a non-banker running the Fed, let alone a college professor. Mister Noyes, wherever you are, please meet Professor Bernanke.
Our case has been that the precious metals sector is completing the bottom of a cyclical bear market that followed the measurable blow-off of 2011.
The ChartWorks has had a series of pieces outlining the building of an important bottom in gold’s price. This is within the “model” of a post-bubble collapse pattern such as followed 1929, or the Nikkei in 1989, etc.
The latest was yesterday and it noted that rising above 1326 would mark the breakout. Today’s New York high was 1325.
However, the rally in both gold and silver is on exceptional developments in Gaza and with the shooting down of a commercial airliner over Ukraine.
Silver outperformed gold and this may not last too long. The real reason for a significant advance in gold would be the advent of another cyclical credit contraction. This could soon be discovered and we should watch for another momentum high in the silver/gold ratio.
On the silver stocks, SLW declined from 27.66 to 25.53 on Tuesday. A test of the high was required and so far it has popped to 26.78.
It is interesting that gold has outperformed the CRB today which will advance our GCI.
We will stay with our theme that gold, in real terms, will continue to act contra-cyclical to orthodox markets. This is presenting a cyclical opportunity to buy the gold stocks.
Today is not that opportunity, as the big stock market is getting close to rolling over. Spreading liquidity pressures could put a lid on gold stocks and could even drive them down.
The invasion of Gaza will soon be completed.

- The Rising Wedge pattern records an increasing urge to get into the play.
- In the examples shown, the break below the lower trend line was followed by a
- significant setback.
- This was associated with tradable declines in the stock market.
- HYG broke below the line at the first of the month.

- We use our Gold/Commodities Index (GCI) as a proxy for gold’s real price.
- The index was established to avoid having gold above and below the divisor.
- Besides that gold is not a commodity.
- Major reversals in the GCI have anticipated major changes in the financial markets.
- The turn up on June 21, 2007 was associated with the reversal in credit spreads and the yield curve.
- This integrated change was behind our observation that “The greatest train wreck in the history of credit” had started.
- The turn down on February 20, 2009, nicely led the end of the financial panic on March 9.
- As we have been noting, the turn up on June 2nd would likely lead the end of the financial party by around four weeks.
- JNK and HYG seem to be failing.
Today the HYG/TLT has taken out the May low. Credit spreads are widening.
Link to July 18 Bob Hoye interview on TalkDigitalNetwork.com: http://talkdigitalnetwork.com/2014/07/chinese-corruption-threatening-world-markets/
BOB HOYE, INSTITUTIONAL ADVISORS
E-MAIL bhoye.institutionaladvisors@telus.net
WEBSITE: www.institutionaladvisors.com
….expect us to be quiet about this outrageous behavior…..
{mp3}/mikesdailycomment/mc072514{/mp3}

 Although Fed Chairwoman Janet Yellen said nothing new in her carefully manicured semi-annual testimony to Congress last week, her performance there, taken within the context of a lengthy profile in the New Yorker (that came to press at around the same time), should confirm that she is very different from any of her predecessors in the job. Put simply, she is likely the most dovish and politically leftist Fed Chair in the Central Bank’s history.
While her tenure thus far may feel like a seamless extension of the Greenspan/Bernanke era, investors should understand how much further Yellen is likely to push the stimulus envelope into unexplored territory. She does not seem to see the Fed’s mission as primarily to maintain the value of the dollar, promote stable financial markets, or to fight inflation. Rather she sees it as a tool to promote progressive social policy and to essentially pick up where formal Federal social programs leave off.
Despite her good intentions, the Fed’s blunt instrument policy tools of low interest rates and money supply expansion can do nothing to raise real incomes, lift people out of poverty, or create jobs. Instead these moves deter savings and capital investment, prevent the creation of high paying jobs, and increase the cost of living, especially for the poor (They are also giving rise to greater international financial tensions, which I explore more deeply in my just released quarterly newsletter). On the “plus” side, these policies have created huge speculative profits on Wall Street. Unfortunately, Yellen does not seem to understand any of this. But she likely has a greater understanding of how the Fed’s monetization of government debt (through Quantitative Easing) has prevented the government from having to raise taxes sharply or cut the programs she believes are so vital to economic health.
But as these policies have also been responsible for pushing up prices for basic necessities such as food, energy, and shelter, these “victories” come at a heavy cost. Recent data shows that consumers are paying more for the things they need and spending less on the things they want. But Yellen simply brushes off this evidence as temporary noise.
In her Congressional appearances, Yellen made clear that the end of the Fed’s six-year experiment with zero percent interest rates is nowhere in sight. In fact, the event is less identifiable today than it was before she took office and before the economy supposedly improved to the point where such support would no longer be needed. The Bernanke Fed had given us some guidance in the form of a 6.5% unemployment rate that could be considered a milestone in the journey towards policy normalization. Later on these triggers became targets, which then became simply factors in a larger decision-making process. But Yellen has gone farther, disregarding all fixed thresholds and claiming that she will keep stimulating as long as she believes that there is “slack” in the economy (which she defines as any level of unemployment above the level of “full employment.”) Where that mythical level may be is open for interpretation, which is likely why she prefers it.
The Fed’s traditional “dual mandate” seeks to balance the need for job creation and price stability. But Yellen clearly sees jobs as her top priority. Any hope that she will put these priorities aside and move forcefully to fight inflation when it officially flares up should be abandoned.
These sentiments are brought into focus in the New Yorker piece, in which she unabashedly presents herself as a pure disciple of John Maynard Keynes and an opponent of Milton Friedman, Ronald Reagan, and Alan Greenspan, figures who are widely credited with having led the rightward movement of U.S. economic policy in the last three decades of the 20th Century. (Yellen refers to that era as “a dark period of economics.”)
Perhaps the most telling passage in the eleven-page piece is an incident in the mid-1990s (related by Alan Blinder who was then a Fed governor along with Janet Yellen). The two were apparently successful in nudging then Fed Chairman Alan Greenspan into a more dovish position on monetary policy. When the shift was made, the two agreed “…we might have just saved 500,000 jobs.” The belief that central bankers are empowered with the ability to talk jobs in and out of existence is a dangerous delusion. As her commitment to social justice and progressivism is a matter of record, there is ample reason to believe that extremist monetary policy will be in play at the Yellen Fed for the duration of her tenure.
For the present, other central bankers have helped by taking the sting out of the Fed’s bad policy. On July 16 the Wall Street Journal reported that the Chinese government had gone on a torrid buying spree of U.S. Treasury debt, adding $107 billion through the first five months of 2014. This works out to an annualized pace of approximately $256 billion per year, or more than three times the 2013 pace (when the Chinese government bought “just” $81 billion for the entire calendar year). The new buying pushed Chinese holdings up to $1.27 trillion.
At the same time, Bloomberg reports that other emerging market central banks (not counting China) bought $49 billion in Treasuries in the 2nd Quarter of 2014, more than any quarter since 3rd Quarter of 2012. These purchases come on the heels of the mysterious $50 billion in purchases made by a shadowy entity operating out of Belgium in the early months of this year (see story).
So it’s clear that while the Fed is tapering its QE purchases of Treasury bonds, other central banks have more than picked up the slack. Not only has this spared the U.S economy from a rise in long-term interest rates, which would likely prick the Fed-fueled twin bubbles in stocks and real estate, but it has also enabled the U.S. to export much of its inflation.As long as this continues, the illusion that Yellen can keep the floodgates open without unleashing high inflation will gain traction. She may feel that there is no risk to continue indefinitely.
But as the global economic status quo is facing a major crisis (as is examined in this newsletter), there is reason to believe that we may be on the cusp of a major realignment of global priorities. Despite her good intentions, if Yellen and her dovish colleagues do not receive the kind of open-ended international support that we have enjoyed thus far in 2014, the full inflationary pain of her policies will fall heaviest on those residents of Main Street for whom she has expressed such deep concern.
Peter Schiff is the CEO and Chief Global Strategist of Euro Pacific Capital, best-selling author and host of syndicated Peter Schiff Show.
Catch Peter’s latest thoughts on the U.S. and International markets in the Euro Pacific Capital Summer 2014 Global Investor Newsletter!

-
I know Mike is a very solid investor and respect his opinions very much. So if he says pay attention to this or that - I will.
~ Dale G.
-
I've started managing my own investments so view Michael's site as a one-stop shop from which to get information and perspectives.
~ Dave E.
-
Michael offers easy reading, honest, common sense information that anyone can use in a practical manner.
~ der_al.
-
A sane voice in a scrambled investment world.
~ Ed R.
Inside Edge Pro Contributors

Greg Weldon

Josef Schachter

Tyler Bollhorn

Ryan Irvine

Paul Beattie

Martin Straith

Patrick Ceresna

Mark Leibovit

James Thorne

Victor Adair