
Stocks & Equities
All major U.S. indices closed higher for the third consecutive week, led by the Dow Jones Industrial Average, which was up 2%. Year to date, by far the strongest major index has been the tech-heavy Nasdaq 100 (NDX), which is up 12.8%. This leadership by technology has been a key catalyst in the 2014 broad market advance, helping the SP 500 post a 7.6% gain despite a weak small cap sector. This strength in tech must continue to keep the broader market headed higher.
From a sector standpoint, last week’s advance was led by financials, industrials and consumer discretionary, but all sectors of the SP 500 ended in positive territory.
Key Indices Held Major Support Levels in August
Many key indices, including the SP 500, Dow Jones Industrial Average and PHLX Semiconductor Index, have rebounded nicely from major support levels that were tested during the first week of August, and finished last week at or near their 2014 highs.
The SPDR Dow Jones Industrial Average (NYSE: DIA), which I first mentioned as a potential buying opportunity in the May 12 Market Outlook, closed out last week 3.7% above its Aug. 7 test of its 200-day moving average, a widely watched major trend proxy, and less than 1% below its July 17 all-time high of $171.32.

Although I remain cautiously positive on DIA heading into this week, I am still apprehensive about its more intermediate-term sustainability due to frothy investor sentiment, weak August-to-September seasonality, and major overhead resistance in the market-leading Nasdaq 100.
Technology Faces a Formidable Challenge
The next chart plots the Nasdaq 100 monthly since 1994, and shows that Friday’s 4,053 closing level positions the index just 2.3% below its 4,147 September 2000 high.

Major benchmark highs like this one are seldom meaningfully and sustainably broken without at least a multi-week corrective decline first. So, especially considering that technology issues have led and fueled the 2014 broader market advance, I am watching the Nasdaq 100’s reaction to 4,147 as a potential coincident or leading indication of an upcoming market correction.
Bearishness in Europe Could Spread to Our Shores
Another potential pothole to be aware of this quarter is European stocks, which are positively correlated to the SP 500 and whose economies have much more to lose than the United States on any further geopolitical tensions in Ukraine.
The next chart shows that, unlike the major U.S. indices, the iShares MSCI Germany (NYSE: EWG) recently declined below its 200-day moving average and its Feb. 3 low, indicating an emerging major bearish trend change. Moreover, the 50-day moving average (minor trend proxy) crossed below the 200-day, which I view as more evidence that a tangible bearish shift in intermediate-term price momentum has occurred.

Considering EWG closely tracks Germany’s DAX index, and that the DAX has maintained a positive correlation to the SP 500 for the past 25 years, this suggests that either the 25-year correlation has suddenly become irrelevant, or one of these two indices is temporarily mispriced. I’m inclined to go with the latter, and more specifically, I think Germany is better handicapping upcoming economic and/or geopolitical risk in Europe that will eventually have an adverse effect on the U.S. market.
U.S. Bond Market Isn’t Enthusiastic Either
Recent apprehension in the U.S. bond market appears to be increasing. In the July 28 Market Outlook, I pointed out that the 2-year/10-year yield curve had flattened below its March 2012 steep (meaning wide) extreme at 200 basis points (bps), saying, “This clears the way for an additional 15 bps of flattening to the next key level at 180 bps.” I also pointed out this was likely to coincide with a decline in the yield of the 10-Year Treasury note.
The next chart shows that the curve has since flattened to 187 bps. Meanwhile, the yield on the 10-year note has coincidentally declined to as low as 2.3%.

A flattening yield curve amid declining long-term interest rates suggest that the typically prescient bond market sees some economic trouble/weakness ahead, which I view as another good reason to watch the Nasdaq 100’s reaction to 4,147 overhead resistance during the next several weeks. Last week’s flattening in the curve clears the way for at least an additional 7 bps move to the next key level at 180 bps.
Putting It All Together
Many key U.S. stock indices tested, held and aggressively rebounded from major support levels earlier this month, which, at best, means that investors still collectively believe the market is headed even higher this year and, at the least, indicates that the “buy the dip” mentality is alive and well as managers remain terrified of missing the next quantitative easing-fueled leg higher.
I am still cautiously positive on this market on a near-term basis, but I also believe investors need to be acutely aware of potential problems ahead due to a number of things including extreme bullish investor sentiment, an historically weak August-to-September period, an emerging bearish trend change in the German stock market, and falling long-term U.S. interest rates.
Considering these factors, I would view the Nasdaq 100’s inability to rise and hold above overhead resistance at 4,147 as a good reason to more aggressively protect profits on long positions.
Editor’s note: One way to add some protection now while still participating in any potential upside is to “rent” your stocks for extra monthly income. If you’re not familiar with Amber Hestla’s Maximum Income service and want to learn how you could earn an extra 9%-plus monthly income from the stocks you already own, click here.
This Week’s News

In the past year, Street Authority recommendations on individual stocks have gained +72%, +26% and +60% all in less than six months… and recently, their trades could have made you +26% in 42 days and +42% in less than one month. Click here to get the free trading advisory — Trade of the Week.

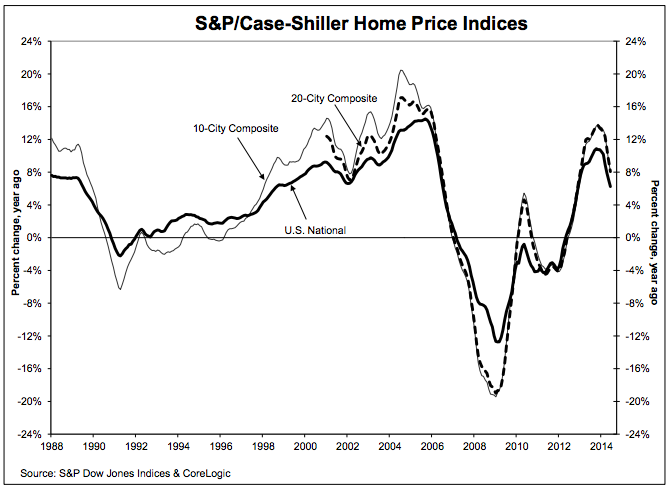
S&P’s Case-Shiller home price index have declined for the second-straight month.
June prices fell 0.2%, worse than the consensus estimate for no change, and even with the decline seen in May.
Year-over-year, prices climbed 8.1%, about in-line with forecasts but slower than a revised 9.4% gain for May.
The 20-city index hit 172.33, about in-line with forecasts and up from a revised 170.68 in June 2013.
“Home price gains continue to ease as they have since last fall,” David M. Blitzer, Chairman of
the Index Committee at S&P Dow Jones Indices, said in a release. “For the first time since February 2008, all cities showed lower annual rates than the previous month. Other housing indicators – starts, existing home sales and builders’ sentiment – are positive. Taken together, these point to a more normal housing
sector.”
Here’s what it’s looked like recently:
WIDESPREAD SLOWDOWN IN US HOME PRICE GAINS
S&P’s Case-Shiller home price index have declined for the second-straight month.
June prices fell 0.2%, worse than the consensus estimate for no change, and even with the decline seen in May.
Year-over-year, prices climbed 8.1%, about in-line with forecasts but slower than a revised 9.4% gain for May.
The 20-city index hit 172.33, about in-line with forecasts and up from a revised 170.68 in June 2013.
“Home price gains continue to ease as they have since last fall,” David M. Blitzer, Chairman of
the Index Committee at S&P Dow Jones Indices, said in a release. “For the first time since February 2008, all cities showed lower annual rates than the previous month. Other housing indicators – starts, existing home sales and builders’ sentiment – are positive. Taken together, these point to a more normal housing
sector.”
Here’s what it’s looked like recently:

What can we say? We are in the dog days of summer and precious metals miners remain in a consolidation. Last week was a down week but it occurred on lower volume and the stocks didn’t threaten support.
Here is a weekly chart of our top 40 index. Look at how the index is holding up at present and digesting the early summer gains, as compared to the end of last summer and earlier this year. The index hasn’t even retraced more than 38% of the move from 310 to 440.
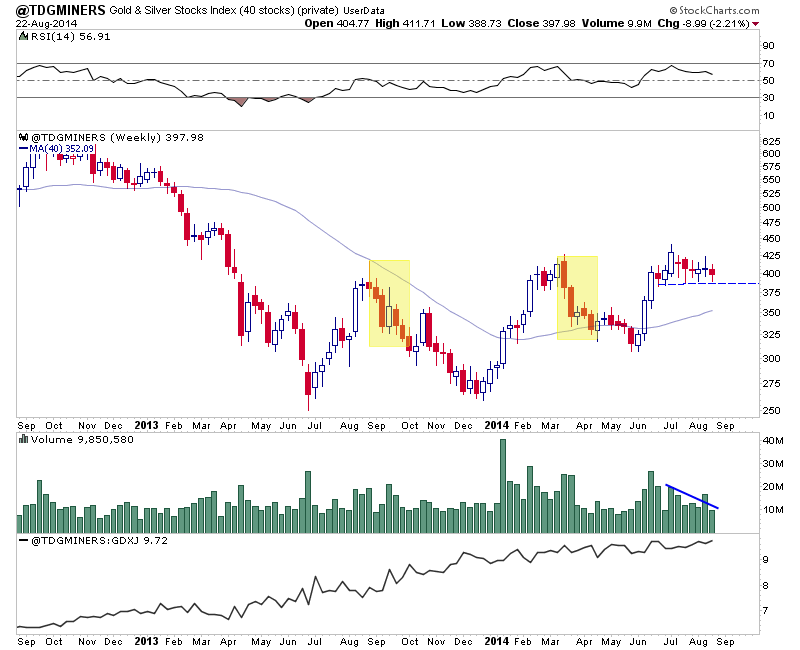
The evidence in my opinion is bullish until the market tells us otherwise. Commodities have corrected big, the US$ has rebounded strongly, the COTs are a concern yet gold and silver stocks have held in well. The mining indices haven’t even tested their 50% retracement and remain above their 200-day moving averages. Furthermore, 78% of the stocks in the HUI are trading above their 200-day moving averages. That figure was a bit higher a week ago but other than that its at the highest level since late 2009.
These reasons among others why I am positioned for a breakout. Sit tight and be right until the evidence changes.
Here are the links for this past week…..
My Interview with Wall Street Window
This was recorded on Tuesday. Thoughts on precious metals, September, what I’m looking for as far as price action and thoughts on the manipulation meme.
What’s Next for Precious Metals?
Great post from Tiho.
Dan Norcini: Aggressive Hedge Fund Selling Plagues Silver
Dan shares his thoughts on Silver as well as his contempt for the kind of analysis that the permabulls provide.
The Bearish Scenario for Gold & Silver
One can look at the bear analogs for Gold & Silver and make a case that the bear has more to go. I don’t agree with that, however, it is always important to keep all reasonable scenarios in mind.
Argonaut Gold’s Maiden Resource for San Agustin is 1.28M oz Au-eq
I’m expecting San Agustin to become Argonaut’s next mine by late 2015. The Silver resource will provide a good kicker.
Balmoral Drills More High Grade Nickel
Balmoral has been one of the biggest early winners of this fledgling bull market and I think it can continue to move higher. It has two projects with strong takeover potential.
Consider a subscription to our premium service as I believe we have one of the best services available. We are the only credentialed technical analyst who is the editor of a service. Secondly, we are one of only a few people who run a real money portfolio. That means our goals are 100% aligned with our subscribers.
Thanks for reading. I wish you all great health and prosperity in 2014 and beyond.
-Jordan
Disclaimer: Sponsor Companies are paid sponsor companies of TheDailyGold.com website and this free newsletter. Do not construe sponsorship with a recommendation. The author of this newsletter is not a registered investment advisor. This newsletter is intended for informational and educational purposes only and should not be considered personalized and individualized investment advice. Investment in the precious metals sector contains significant risks. You should consult with an investment advisor and due your own due diligence before making any investment decisions. This email may contain certain forward looking statements which are subject to risks, uncertainties and a multitude of factors that can cause results and outcomes to differ materially from those discussed herein.

Quotable
“If you try to change it, you will ruin it. Try to hold it, and you will lose it.”
― Lao Tzu, Tao Te Ching
Commentary & Analysis
A note on Chinese real estate concerns – Aussie seems the play on the FX side
As you probably know, real estate prices in China are falling. You only have to Google the following: “Chinese Ghost Cities,” to get a sense of how pronounced the over building seems in China.

EMPTY ROADS IN ZHENGZHOU, CHINA
But, despite rising concerns from many analysts, the question is this: Can China really afford a real estate crisis?
The short answer is no. Not only because real estate represents such a huge proportion of the country’s GDP, but according to the Financial Times:
“More than 90 per cent of urban households already own at least one home, and for those households that own apartments, nearly 76 per cent of their assets are in real estate,according to Gan Li, director of the Survey and Research Centre for China Household Finance in China.”
The total number of urban households is not defined in the article. But I think we can assume two things: 1) there are a lot of them, and 2) those households who have the money to invest in real estate are also the core consumer class in China. And according to reports, real estate has been a prime source of savings for young and old in China; thus it cuts across all generations. Thus, the potential for social unrest is there. But beyond that, I think we can conclude a real estate crisis will hit Chinese consumption hard, just as it did to US consumption. This is not a healthy prospect for the country given consumption to GDP is already at historically world-beating lows.
The Party seems serious about reform, which may be one reason why all those corrupt officials keep “jumping” out of windows. My bet is China runs out of corrupt officials before it runs out of windows (maybe this is an idea Washington D.C. can get behind). A key to reform is a transition away from massive investment stimulus, aka malinvestment into said Ghost Cities, to a more balanced consumer-based economy. The old economic model which served them well is dead. The leadership knows that. But knowing that and implementing change without major blow-back and social turmoil are two different things.
It seems the demand for liquidity in China is rising. This liquidity demand coincides with the mandate for banking reform, which by its nature reduces liquidity. And external sources of liquidity seem likely to fade, as:
1) The US Fed drains dollar liquidity out of the market
2) European banking continues to delever
So, can we expect another massive wave of stimulus from the Chinese government soon? Betting against this in the past has proved fruitless despite warning about the malinvestment risks. But even if we see more stimulus efforts to help real estate buyers in China, it is unlikely to have the same impact externally.
Because I don’t expect more building (anywhere relative to what we have seen) it’s unlikely another wave of raw materials demand will flow from China even if the government helps engineer a soft-landing in real estate. I say that because the banking reform mandate suggests any stimulus will be more closely monitored and targeted, as opposed to the blanket variety stimulus which in past seeped everywhere, was multiplied by Shadow Banking and supported a good portion of the massive overbuild and demand for commodities as its extension.
We can’t discount completely the possibility this time if different and real crisis will erupt in the real estate market (though we should probably place low probability on this event considering how China seems to cope so effectively with problems viewed as “a budding crisis” from the perspective of Western-based analysts applying conventional economic analysis). So given those as rationales, my favorite way to play this from a currency perspective is through the Australian dollar.

I’ve written here before (and maybe it is a bit of hyperbole on my part) saying Australia has become a satellite country of China, from an economic perspective. Maybe that isn’t true, but there still seems plenty of fallout left for the Australian economy whose massive build in mining capacity coincided nicely with the boom in Chinese real estate.
AUD/USD Weekly:

Jack Crooks
President, Black Swan Capital
Twitter: @bswancap

 Peter Schiff and John Browne on the Global Market Forecast:


-
I know Mike is a very solid investor and respect his opinions very much. So if he says pay attention to this or that - I will.
~ Dale G.
-
I've started managing my own investments so view Michael's site as a one-stop shop from which to get information and perspectives.
~ Dave E.
-
Michael offers easy reading, honest, common sense information that anyone can use in a practical manner.
~ der_al.
-
A sane voice in a scrambled investment world.
~ Ed R.
Inside Edge Pro Contributors

Greg Weldon

Josef Schachter

Tyler Bollhorn

Ryan Irvine

Paul Beattie

Martin Straith

Patrick Ceresna

Mark Leibovit

James Thorne

Victor Adair