

 How would you like it if you had, say 500,000 euros in a European bank and …
 Making matters worse …
 Many mining stocks have performed well in 2014 and the move has largely been motivated by several factors.
First, gold bullion itself has found a footing. The gold price has traded in a range of $1,250–1,350/oz, which is fairly narrow compared to how gold prices have moved in the past three to five years. Investors are becoming comfortable with the idea that gold will remain range bound for the coming 12 months or more, and concerns that gold could drop significantly over a short period seems to be waning with gold seeing support around $1,250/oz.
While some profit taking on strong first half share performance is certainly justifiable, I continue to recommend buying gold stocks with a focus on companies that are currently generating healthy margins and could enjoy higher trading multiples as they gravitate up toward longer-term averages. I also like gold stocks that have underperformed relative to their peers in 2014 that are projecting improving operations or have meaningful catalysts in the near term.
TGR: What do you expect the trading range for gold to be through the end of 2015?
JK: Our gold price estimate for 2015 is $1,300/oz. Next year is likely to look a lot like 2014 with typical seasonal moves and maintaining that price range of roughly $1,250–1,350/oz for the year.
TGR: Do you think the Market Vectors Junior Gold Miners ETF (GDXJ:NYSEArca) will be up another 30% through the first eight months of 2015?
JK: That would be difficult. There could be stocks that realize some strong performance in the back half of this year and into next year, but I don’t think it will be as broad based as we saw early in 2014.
TGR: In the near term do you expect gold buying to gain steam or have seasonal gold buying trends become something of the past?
JK: We’ve spent a lot of time tracking gold’s seasonal price patterns over 5-, 10- and 15-year trends. Plotting the relative performance of gold prices over those periods shows a fairly consistent seasonal pattern. A move in the gold price in early June on the back of geopolitical tensions was unexpected and may have taken some of the steam out of a fall rally, but we need to realize that the typical fall rally is largely spurred by physical demand from the East. I don’t see a reason why typical physical demand wouldn’t materialize in 2014 and we expect the gold price to do well over the next few months.
 TGR: One division of CIBC World Markets uses quantitative models to identify predictive relationships and broad market trends. What are these models telling investors about small-cap gold stocks and the gold space?
JK: Our quantitative analyst, Jeff Evans, has been promoting the idea that gold stocks, especially the more volatile small- to mid-cap gold stocks, have high beta outperformance relative to the S&P 500 and the Toronto Stock Exchange given the current environment for stable or marginally upward moving interest rates over the long term. That’s from a technical standpoint.
With that in mind, we have to be cognizant of the fact that we’ve seen better downside support and some strong moves in the gold price in 2014 that weren’t necessarily expected and I’m sure that has helped move some gold stocks upward. But interest rates are having an effect on how people look at gold and gold equities, and using that as a trigger to buy or sell gold stocks makes sense to me.
TGR: In June 2013 positive news had largely stopped moving equity prices. You told us then that it would be temporary. What news is moving producer and developer equities in this market?
JK: On the producer side, improving operations has been the biggest motivator for share prices. Although I expect a lot of the cost improvements in the gold mining space have already been incorporated into operations, the market is thinking about how sustainable those cost improvements might be. Companies that maintain lower costs through 2014, relative to where they may have been in previous years, are likely to get attention as investors think about 2015 performance and if they should consider increasing their estimates for company earnings and cash flow. Such a scenario could generate further share support for good operators. Of course, companies that realize further cost improvements in the second half of 2014 are also likely to get investors’ attention.
TGR: What about developers?
JK: On the developer side, we’re starting to see share prices get rewarded for good drill results, resource growth and even new discoveries. When we spoke back in mid-2013 I recommended that investors stick to the cash-and-catalyst mentality because an exploration stock needs to have a strong balance sheet and material near-term catalysts. That approach was the right one and I’d stick with that concept today.
 In 2013, Premier Gold Mines Ltd. (PG:TSX) was one stock I highlighted as being a company with lots of cash and that would have meaningful developments over the following 12 months. In 2014 the company produced a preliminary economic assessment (PEA) and increased the total resource for its Hardrock project in northern Ontario. That has improved Premier’s estimated return on paper. Meanwhile, Premier has increased the mineralized footprint and consolidated its Cove project with the neighboring McCoy mine in Nevada. Its strong balance sheet and the ability to unlock value in its assets are a big part of Premier’s share price performance—it’s up almost 80% year-to-date. That cash-and-catalyst requirement should still be prevalent in investors’ minds.
TGR: Would you make any modifications to the cash-and-catalyst thesis given what has transpired between then and now?
JK: Cash and catalysts are not the only components that a company must have. The main project has to have gold grades that are amenable to the type of process it is proposing, and the economics have to work at current gold prices to have a realistic chance of seeing a takeover offer. A company definitely has to have a solid management team to navigate today’s tricky financing waters or wisely allocate capital.
TGR: Which types of companies are seeing interest from institutional investors?
JK: My producer coverage is in the small to intermediate market cap in the gold space. The intermediate producers tend to have a higher beta to the bullion price so that segment of my coverage seems to have sustained greater institutional interest in 2014. Despite some merger and acquisition (M&A) activity in 2014, the general feeling among investors is that although M&A is likely to continue, it’s expected to come in the form of smaller consolidations or the sale of noncore assets by majors. In that context, exploration companies are struggling to attract attention from the institutional market.
Investors are apprehensive to build meaningful takeout premiums into a company’s share price. But the gold exploration stocks that are still on the radar for institutional investors are companies like Premier,Continental Gold Ltd. (CNL:TSX; CGOOF:OTCQX), Pretium Resources Inc. (PVG:TSX; PVG:NYSE), Pilot Gold Inc. (PLG:TSX) and Asanko Gold Inc. (AKG:TSX; AKG:NYSE.MKT). Those are developers under coverage that are getting the most attention from institutional buyers.
TGR: What are your top picks in the junior and midtier producer space?
JK: My top pick would still be B2Gold Corp. (BTG:NYSE; BTO:TSX; B2G:NSX). The company is spread out geographically, but it is continuing to incrementally improve the performance at the operations in production. B2Gold is going to bring on another leg of meaningful growth with the Otjikoto mine in Namibia later this year. Although the pace of acquisitions has been high over the last few years, B2Gold has been able to build a solid pipeline of projects—the next likely being the Fekola project in Mali. B2Gold will see fairly significant production growth over the next couple of years and that growth should come with improving costs. That’s the kind of dynamic that investors are looking for given the concept that gold may stay range bound here in the near term.
TGR: You visit a substantial number of mining projects each year. Please share some of your takeaways from recent visits.
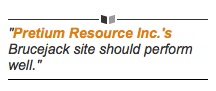
JK: In late August I visited Pretium Resources’ Brucejack project in northern British Columbia. This was my third time there and my focus was to have a closer look at the underground bulk sample area of the Valley of the Kings deposit and see how both the geology and the mineralization compare with some of the interpretations and estimates Pretium has laid out. I looked at the stockwork veining that hosts much of the gold and silver mineralization and witnessed how the company has assessed its resource. I returned from the trip with an improved comfort level around the company’s interpretations. Questions from the broader market about the realized mine grade will persist until it goes into operation, but nonetheless the site should perform well.
TGR: Boston-based Liberty Metals & Mining Holdings recently took a position in Pretium. Does the market see that as a vote of confidence in Brucejack?
JK: That type of investment often gives investors the idea that there is further financial support available for an asset like Brucejack. That builds some confidence from the market’s perspective that Pretium will be able to find financing to move the project forward. But no single investor investing in an asset could build full confidence in any one project. It’s a positive step, yet many other pieces would have to fall into place to get a complete stamp of approval from the market.
TGR: Is Pretium fairly valued?
JK: We rate it a Sector Outperformer so we think it’s certainly a stock with upside. At CIBC we have taken a more conservative approach to modeling Brucejack and the Valley of the Kings deposit relative to how the company designed its feasibility study. Even so, our net asset value (NAV) for Brucejack alone is north of $11 based on Pretium’s current share count. I would note, though, that a takeout premium is priced into our $11.50 target because most stocks in the junior space are trading in the 0.4-0.6x NAV range. In order to build and sustain a significant takeout premium, Pretium will have to undertake a few more derisking steps over the next 12 months.
TGR: Please tell us about some other recent visits.
JK: I recently visited its Premier’s Hardrock project in northern Ontario. Similar to my trip to Pretium, I was looking at how the geology and mineralization on surface compares to the company’s estimates. Premier has exposed some of the geology on surface and interpretations of that geology based on computer models are being validated through surface sampling. Also in focus were some steps it is taking toward producing a feasibility study early next year.
Premier has done a lot of geotechnical drilling over the last year and found that it has good rock stability, so it’s likely that we’ll see slightly steeper pit walls in the feasibility study relative to the PEA of January 2013; this could improve the overall strip ratio and improve costs. The bottom line is that Hardrock is certainly the company’s focus. The work the company will do over the next 6 to 12 months should at least marginally improve Hardrock’s economics, which could bring people’s eyes back to that project.
TGR: What’s Premier’s likely course with Hardrock once the feasibility is published in 2015?
JK: Once it gets Hardrock past the feasibility stage, Premier must seriously consider how it would finance a mine. Financing this mine will be one of the bigger challenges Premier faces. Hardrock is a “modest capital expenditure” project in the range of $500 million and it could be attractive to a midtier or senior producer because the cost is not in the billions.
TGR: Does Premier Gold Mines President and CEO Ewan Downie still see himself as an asset developer or is he thinking about becoming a miner?
JK: With senior management additions like Chairman Ebe Scherkus and a number of other engineering and resource-modeling professionals, we can see that this company is transforming. Ebe and the team that Premier has brought in are focused on properly designing Hardrock and are moving that project through the development phase. But this is still a junior exploration company. If its project looks attractive from an M&A standpoint, I expect that Premier would be willing negotiators provided that the numbers make sense.
TGR: Perhaps maybe one or two more recent site visits.
JK: Sure. Every year we have a mine tour that goes across the Abitibi in northern Ontario and Québec. I visited a number of sites including Primero Mining Corp.’s (PPP:NYSE; P:TSX) recently acquired Black Fox gold mine. That’s certainly a big part of Primero’s story in 2014. It went from owning a single asset—the San Dimas mine in Mexico—to being a multi-asset company with Black Fox. Primero has some work to do at Black Fox in getting development meters completed and underground production back to mid-2013 levels.
The larger part of the story—and what the market is really paying attention to—is the current drill program. The mine life at Black Fox is just over five years. Primero is drilling down dip from the main ore body at Black Fox with the goal of adding to the overall resource. Drill results released since Primero acquired the asset in 2014 suggest that the resource will grow, but the company will need to finish the current drilling campaign to get a better understanding of the resource growth potential at Black Fox.
TGR: That’s the near-term focus. Do you see Primero continuing to consolidate that camp given Black Fox’s proximity to other assets?
JK: At this point Primero is focused on Black Fox. Down the road there could be some opportunities for consolidation. St Andrew Goldfields Ltd. (SAS:TSX), for instance, is one of Primero’s neighbors. St Andrew has been working toward getting the Taylor mine up and running. Once that mine is in operation, St Andrew’s mill would be east of Black Fox and Primero’s Stock mill whereas Taylor is west. St Andrew would effectively be passing right by Primero’s mill to travel to its mill. Do I think that there could be further consolidation in the district? It’s possible but I don’t think that is as likely. Developing working agreements between companies to improve efficiency is a more likely outcome in my mind.
TGR: What are some other stories under coverage?
JK: Argonaut Gold Inc. (AR:TSX) recently released an initial resource for its San Agustin project in Mexico. Why it’s interesting is that San Agustin is the neighboring project to the company’s flagship mine, El Castillo, about 10 kilometers away. Argonaut performed well in 2013, yet its shares have underperformed in 2014. I think part of that underperformance has stemmed from some concern about Argonaut’s next leg of growth—but the initial San Agustin resource could be that next leg of growth. With an average gold grade of about 0.32 grams per ton (0.32 g/t) in its resource statement, I wouldn’t call the grades flashy but the neighboring El Castillo mine has a reserve grade of 0.36 g/t. A PEA for San Agustin before the end of 2014 could be another meaningful catalyst for Argonaut.
TGR: Maybe one more?
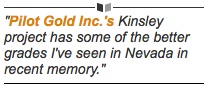
JK: One junior that continues to get attention is Pilot Gold, largely on the back of its good work in Turkey and Nevada. We’ve seen some great results from its Kinsley project in Nevada—some of the better grades I’ve seen in Nevada in recent memory. How big is the Kinsley deposit? The overall footprint is still fairly small so there is more work to be done to conceptualize the size of the deposit and get investors fully engaged. Nonetheless, the grades are robust and have garnered some market attention.
In Turkey, Pilot identified several new zones at the TV Tower project, a joint venture with Teck Resources Ltd. (TCK:TSX; TCK:NYSE). Again, oxidized mineralization in some cases and showing consistent mineralization patterns. Bottom line: There seems to be a fairly clear path to adding ounces at both projects. Those are the kinds of things that get the market’s attention.
TGR: One recent drill result at TV Tower was 130.9 meters grading 1.5 g/t Au and 0.48% Cu starting at surface. You model results like these all the time. What does that look like to you?
JK: No project is a single drill hole, but to have a single hole with those kinds of numbers is an excellent start. If you put several intercepts like that together you can quickly build pounds and ounces. Being able to validate a surface geological interpretation is big and a great starting point for any drill program.
TGR: What’s your sense of where we are in the recovery of precious metals equities?
JK: I get the feeling that we have hit the bottom and taken the first leg up—but the next leg up could take some time to materialize. There are individual stocks that should have good performance through the back half of 2014 and over the next 12 to 18 months.
From a broader perspective, a lot of the cost improvements have already materialized and I think there is little producers can do to significantly improve margins or cash flow. To accomplish those things we need to see a few things happen: more fundamental support from the gold price and an increase in physical demand in India and the rest of Asia. Better yields will catalyze the generalist investor back to investing in gold stocks.
TGR: Thank you, Jeff, for your insight.
Jeff Killeen has been with the CIBC Mining Research team since early 2011. He covers and provides technical assessment of junior and intermediate exploration and mining companies worldwide. Prior to joining CIBC, Killeen worked as an exploration and mine geologist in several major mining camps, including the Sudbury basin and the Kirkland Lake region. Killeen earned his Bachelor of Science degree from Carleton University.
Read what other experts are saying about:
Want to read more Gold Report interviews like this? Sign up for our free e-newsletter, and you’ll learn when new articles have been published. To see recent interviews with industry analysts and commentators, visit our Streetwise Interviews page.
Related Articles
- Jeff Killeen: A Picky Player’s Guide to a Cautiously Optimistic Mining Market
- Filipe Martins: African Miners that Can Generate Cash Flow and Dividends
- Sprott’s Charles Oliver: Gold at $1,500 by Christmas?
DISCLOSURE:
1) Brian Sylvester conducted this interview for Streetwise Reports LLC, publisher of The Gold Report, The Energy Report, The Life Sciences Report and The Mining Report, and provides services to Streetwise Reports as an independent contractor. He owns, or his family owns, shares of the following companies mentioned in this interview: None.
2) The following companies mentioned in the interview are sponsors of Streetwise Reports: Argonaut Gold Inc., Asanko Gold Inc, Continental Gold Ltd., Pilot Gold Inc., Premier Gold Mines Ltd., Pretium Resources Inc., Primero Mining Corp. and St Andrew Goldfields Ltd. Streetwise Reports does not accept stock in exchange for its services.
3) Jeff Killeen: I own, or my family owns, shares of the following companies mentioned in this interview: None. I personally am, or my family is, paid by the following companies mentioned in this interview: None. My company has a financial relationship with the following companies mentioned in this interview: None. I was not paid by Streetwise Reports for participating in this interview. Comments and opinions expressed are my own comments and opinions. I had the opportunity to review the interview for accuracy as of the date of the interview and am responsible for the content of the interview.
4) Interviews are edited for clarity. Streetwise Reports does not make editorial comments or change experts’ statements without their consent.
5) The interview does not constitute investment advice. Each reader is encouraged to consult with his or her individual financial professional and any action a reader takes as a result of information presented here is his or her own responsibility. By opening this page, each reader accepts and agrees to Streetwise Reports’ terms of use and full legal disclaimer.
6) From time to time, Streetwise Reports LLC and its directors, officers, employees or members of their families, as well as persons interviewed for articles and interviews on the site, may have a long or short position in securities mentioned. Directors, officers, employees or members of their families are prohibited from making purchases and/or sales of those securities in the open market or otherwise during the up-to-four-week interval from the time of the interview until after it publishes.

 For the terrorist group known as the Islamic State, Syria and Iraq were a good place to start their campaign, but in order to survive and prosper it knew from the outset that it had no choice but to set its sights on the ultimate prize: the oil fields of Saudi Arabia.


