
Asset protection
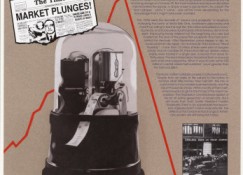 US stock markets tumbled again yesterday as the recent sell off gathers speed. Traders note that the markets are now very close to their 200-day moving averages and when those are passed there is every possibility of a major crash for the most overvalued equities in the world whose internal support has been hollowed out over the past year.
After the falls on Tuesday the Dow is under 200 points away from the 200-day moving average trigger line, and the Nasdaq is even closer to this tripwire with 90 points to go. Automated selling could turn into a market panic to get out at this point.
Exhausted rally
The long rally is exhausted. The QE3 money machine is coming to an end. Where are the buyers going to come from now? Besides the small caps have been selling down for ages. This is a hollow shell of a market just waiting for the big guys to join the rout.
It’s also a market exhibiting every sign of the madness of crowd buying, from the all-time high for margin debt to the leveraging of corporate balance sheets to buy back stocks on an epic scale. The most overvalued stock market in the world now faces a global recession and high dollar.
Subscribers to our highly regarded monthly newsletter have been aware of this for some time and will have crash proof portfolios if they have heeded our advice (subscribe here). How well are you positioned for a Black Monday 1987-style of a 2010-vintage Flash Crash?
Inevitable
We are close to the brink now with not a sign of anything on the horizon to alter this inevitable fate.
Have we gotten this sort of prediction right before? Well have a look back at our whacky prediction of a crash back in October 2008 (click here). How was that for timing and accuracy about the level of the fall?
Where to this time round? Dow at 6,000 anybody?

As the market goes deeper into corrective mode, we’ll take a look at our weekly indicators and our cycle timer.
Since it’s Wednesday, we get our first updates on weekly sentiment. The bulls/bears data is made up of two parts (obviously). But the divergence in bulls and bears is concerning. The bulls are the fewest in some time.

This leaves the market vulnerable. The bulls are right where they were last time we looked. At the middle of their range. But the following indicator is reaching an extreme:

Now this isn’t the most precise indicator, but when it reaches an extreme, it’s worth considering. This extreme is actually bullish for the market.
Another indicator on the bullish side:

For the past few years, this level has suggested the market is close to a bottom. This is more of a technical indicator than a sentiment indicator because it’s based on price action, so I rank this higher than the above.
And finally, our 10/20/40 week cycle chart:

We have been looking for this 10/1 correction all year, but it’s coming a little late (which is bearish).
So where does that leave us?
At the end of the day (I always say that) the market is vulnerable here, since fear is not growing as prices move lower and we’re still in the window of the crash I predicted a few weeks ago. That being said, we’re approaching a level on some measures where we would begin to expect the markets to rebound. So we’ll watch the markets even closer now for action in our services. I.e. in our QQQtrader, we’re short the Qs. In our options service, we’re still short oil and gold. And we issued our covered call recommendations near the top, so they should all pan out as we move into this expiration.
And expiration will be key – as I believe markets reverse into expiration, so that’d be my target date for the bottom to be set. If fear builds to the right levels, the market could rally strongly out of expirations.
On an administrative note, we’re going to consolidate all our Barometer services as we make room for our next trader, who’ll not only incorporate his techniques on stocks, but on forex and futures as well. His name is Ian Mitchell and we’re excited to have him joining our team later this month. Again, we’re broadening our scope of services to help you profit from the coming markets over the next decade as we are moving into a period where we expect substandard market returns. That means the Buy and Hold strategies that worked since the March 2009 bottom will need to be replaced by strategic portfolio management. So stay tuned!
Regards,
About Stock Barometer
Stock Barometer is a paid subscription service comprised of several newsletters for both investors and traders. Written by our trading experts Stock Barometer specializes in using his sophisticated methods of market analysis to uncover the most promising short-term trading opportunities as well as long-term investments.
Stock Barometer is completely independent. We have never and will not ever accept compensation from any company whose stock we recommend.
Our goal is to make you money. We offer you the tools and information to do so and leave it to you, the individual investor, to apply them in the best way possible.

Przemyslaw was correctly short Gold until covering here just recently. He is now bullish & recommending the following position, actual trading positions & stops in the summary at the bottom – Money Talks Ed
Briefly: In our opinion speculative long positions (full) in gold, silver and mining stocks are justified from the risk/reward perspective.
The precious metals market finally rallied yesterday. Gold moved lower in the first hours of the session, getting very close to the Dec. 2013 low, but it rallied before the session was over, finally closing over $16 higher. Is the final bottom in?
The final bottom – not likely. The local bottom – very likely. Let’s examine the charts and see what actually changed (charts courtesy of http://stockcharts.com).
Yesterday, we wrote the following:
The Friday’s rally was huge and it’s no wonder that metals and miners declined. The move took place right after the cyclical turning point, so the odds are that we will not have to wait long for a reversal.
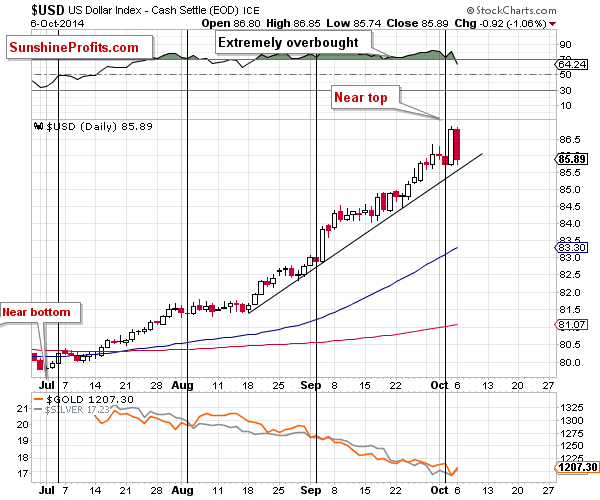
All in all, the outlook for the USD Index is still bearish based on the extremely overbought status, the turning point, and the fact that previous similar breakouts (as seen on the weekly chart) were invalidated.
We already saw a significant daily decline yesterday, so it could be the case that the corrective downswing in the USD Index is already underway. The odds will further increase once we see a move below the rising short-term support line (which is likely to be seen shortly).
What about the precious metals market? It rallied and it’s likely to rally even more.

Larger Image (click twice for super large)
Gold moved almost to its Dec. 2013 intra-day low, which is a very important support, so this fact by itself makes a move higher very likely. The fact that gold rallied shortly after declining to this level and ended the session over $16 higher (and forming a reversal hammer candlestick) makes the situation even more bullish. This kind of action is likely to be followed by further rallying.

Larger Image (click twice for super large)
We recently commented about the gold to USD Index ratio as something that could provide us with technical confirmations. Based on Friday’s and today’s price moves we saw a small decline below the 2008 high (and 2013 low) that was followed by another move higher. Before viewing the decline as a breakdown, please note that back in 2008 the ratio also moved very temporarily below the horizontal support only to invalidate this move and rally shortly thereafter. It seems that we are seeing this type of action once again.

Larger Image (click twice for super large)
Silver moved higher and is once again visibly above the rising, long-term support line. The white metal is likely to rally based on this support combined with its heavily oversold status.

Larger Image (click twice for super large)
Today, we would like to cover a very interesting event that happened in the platinum market yesterday. More precisely, it concerns the platinum to gold ratio. Namely, platinum became, very temporarily, cheaper than gold, and this situation was quickly reversed. The entire event happened on huge volume in the ratio (the ratio of volumes). This kind of action (significant events, reversals and huge-volume sessions) quite often happens at the end of a given move. In this case, the preceding move was definitely down.

Larger Image (click twice for super large)
As far as the mining stocks are concerned, our previous comments remain up-to-date:
Gold stocks are now very close (almost at) their 2013 low, which is a major support level. Combined with a strong support for gold and silver and their oversold status, the above provides us with bullish implications also for the mining stocks sector.
Just a little more strength in the HUI Index will mean an invalidation of the breakdown below 2 support levels, which will be another strong bullish sign.
Summing up, the situation in the precious metals market is still bullish for the short term, even if Friday’s intra-day action might suggest otherwise. Monday’s price action seems to be the true direction in which the market is likely to head next – up. The corrective downswing in the USD Index has probably already begun. The same goes for the precious metals sector, only in this case, the correction would be to the upside. A lot of money has been saved by staying out of the precious metals market in the past months with one’s long-term investments (details below), and it seems that the corrective upswing will provide additional profits from the trading capital.
To summarize:
Trading capital (our opinion):
It seems that having speculative (full) long positions in gold, silver and mining stocks is a good idea:
- Gold: stop-loss: $1,172, initial target price: $1,249, stop loss for the UGLD ETF $11.29, initial target price for the UGLD ETF $13.56
- Silver: stop-loss: $16.47, initial target price: $18.07, stop loss for USLV ETF $23.94, initial target price for the USLV ETF $31.73
- Mining stocks (price levels for the GDX ETF): stop-loss: $19.94, initial target price: $23.37, stop loss for the NUGT ETF $18.25, initial target price for the NUGT ETF $28.99,
In case one wants to bet on higher junior mining stock ETFs, here are the stop-loss details and initial target prices:
- GDXJ stop-loss: $28.40, initial target price: $37.14
- JNUG stop-loss: $6.19, initial target price: $16.34
Long-term capital (our opinion): No positions
Insurance capital (our opinion): Full position
Thank you.
You will find details on our thoughts on gold portfolio structuring in the Key Insights section on our website.
As always, we’ll keep our subscribers updated should our views on the market change. We will continue to send them our Gold & Silver Trading Alerts on each trading day and we will send additional ones whenever appropriate. If you’d like to receive them, please subscribe today.

“So, what gives, Larry? For years, you have been right as rain on gold and silver, and now, it seems like you’re way off the mark!
“You told us the precious metals had bottomed. Instead, they are tanking now, with gold below $1,200 and no bottom in sight and silver crashing.
“And recently, you told us to expect a bounce before the metals fell any further. Wrong again.
“Have you lost your bearings, Larry? Or worse, are you profiting from the decline in the precious metals while we either sit on the sidelines or suffer losses?”
That summarizes a lot of the emails I’ve been getting lately. So let me respond now.
I appreciate everyone’s comments. Yes, I have missed the mark lately.
But let’s put everything in perspective:
First, the short-term swings, in any market, are always extremely difficult to pin down — and even far more difficult when entering a period where a major trend turn is expected.
Second, I am 100 percent confident that the metals are now moving much lower. To sub–$1,000 gold and probably to $15 and even lower in silver.
Third, I am also 100 percent confident that the profits that will be available, both on the way down, and perhaps more importantly when gold and silver do bottom, will be all that much greater.
Fourth, we are merely witnessing a temporary extension of the bear market. All the underlying fundamental, cyclical and technical conditions for gold and silver’s long-term bull markets remain in place. The most important one: The rising tide of the war cycles and geo-political stress.
 On that note, let me assure you, if you think the state of chaos in the world now is bad, you haven’t seen anything yet. The war cycles are still in the very early stages, with nearly six more years of ramping up to go.
In the months and years ahead, you are going to see domestic and international unrest that will make the current environment look like a walk in the park. This force, geo-political unrest, while also temporarily bearish, will invert and become the number one reason gold and silver soar.
But first, it looks like we’re going to have to see the die-hard bulls get decimated.
Fifth, my long-term track record in gold is unbeatable. I have nailed everything from …
- The 1980 high to the low in 2000, to buying the pullback in the middle of the financial crisis in 2008/09.
- To declaring the top was in mere days after gold hit its record $1,921 high in September 2011.
- To nearly the entire three-year bear market since September 2011.
Even my most recent calls were prescient and not all that bad. While I did tell everyone to start dipping their toes in the water again earlier this year, at roughly the $1,300 level in gold …
It was just a couple weeks ago, when gold broke the $1,240 level, that I also declared the bear market was temporarily back.
So I missed about a $60 move. No big deal in my opinion. Gold’s fallen over $800 since its high of $1,921 in September 2011. I was bearish for that entire move, but for a $60 screw-up.
Moreover, had you listened to me and not gotten too aggressive in physicals, ETFs or mining shares, any loss you sustained should be minimal.
Am I defending myself? You bet I am. A) I don’t know anyone in the business with a better track record than I have in the precious metals.
B) I remain 100 percent confident that my successful long-term track record will continue well into the future. And C) …
The extremely high level of investor emotions in gold and silver right now also tells me that there are still way too many bulls in the market and that they will have to be bloodied before these markets bottom.
And you, if you follow me, will keep your capital intact and ready to be deployed precisely at the right moment, when gold and silver do bottom, when the die-hard bulls’ blood is running in the streets.
Now, let me give you a more detailed explanation of what’s happening in gold and silver.
As I recently told my Real Wealth Report subscribers, it appears that …
A. Deflation — with a capital “D” — now has the upper hand in almost ALL markets.
You can see it in the grain markets, where the prices of wheat, corn, soybeans are collapsing.
You can see it in the soft commodities markets, where sugar is sliding and the prices of cocoa and coffee are about to get hit hard.
You can see it in the base metals, like tin, iron, zinc, where prices are collapsing.
And you can even see it in the price of crude oil, which is now fulfilling my original forecast of a move down to below $80 a barrel.
Moreover, you are now starting to see it in the stock markets, where the initial turn lower is at hand. Yes, the equity market has to correct before it too heads higher. It’s as simple as that.
Naturally, both cause and effect is that …
B. The dollar is soaring like an eagle. And let me remind you that as bearish as I am long-term on the dollar, I have stood virtually alone in the field warning you that the dollar was entering a temporary bull market, and that inflation, or worse, hyperinflation were not going to be a problem.
The strength in the dollar is shocking to most. In terms of a basket of currencies such as the Dollar Index, the dollar has jumped a whopping 9.9 percent since early May and is now up almost 20 percent since its bottom in 2011.
And again, for all those hyperinflations out there, you have to ask yourself: With all that money printing the Fed did, how come the dollar bottomed in 2011?!!
The answer is simple: The threat we face is not inflation, but deflation, with a capital “D.”
Later, we will indeed see inflation. Not hyperinflation. But first, all the excesses of the past several years will need to be wrung out of the system.
At the same time …
C. Europe is now going down the crapper. Europe is in such bad shape, economically and geo-politically, that even I am amazed at how quickly it’s now falling apart.
Even Germany’s economy, the only economy in the euro-region that had shown growth, is now starting to slump. France is a basket case. So is Italy. So is Spain. So is Portugal. So is Greece.
They are all going down the tubes and as they do, a tidal wave of capital will leave Europe, pushing the dollar even higher and the euro even lower.
And yet here too, these very same forces, temporarily bearish for the precious metals, will also invert and eventually become bullish forces.
For when Europe’s investors realize they are merely jumping from the fire into the frying pan (the U.S.) …
They will start buying gold en masse, along with investors from other countries and regions of the world where the war cycles are wreaking havoc …
And the long-term bull markets in the precious metals will indeed reassert themselves, stronger than ever.
Keep in mind that nothing is ever black and white in the markets, in life for that matter. The global economy today is like a complex rainforest, where everything is interlinked, related and interdependent.
Right now, deflation has the upper hand. Investors in most parts of the globe are upping for cash, the dollar. They are anxious, uncertain, scared. They don’t know where to turn.
It is a temporary period that will give way to massive new trends in the not too distant future, especially the precious metals.
You just have to have the insight, objectivity, patience, and steel will to see it though. The world is changing in ways most can’t even fathom, and it’s all happening right before our very eyes.
In my Sept. 24 column, I recommended purchasing inverse ETFs to hedge any precious metals or mining shares you didn’t want to, or couldn’t, exit. Those recommendations still stand:
- ProShares Ultra Gold (UGL) or PowerShares DB Gold Double Short ETN (DZZ) for gold.
- ProShares UltraShort Silver (ZSL) for silver.
- Direxion Daily Gold Miners Bear 3X ETF (DUST) for mining shares.
If you haven’t bought them, for whatever reason, I suggest you do so as soon as you can and preferably on a bounce, which is coming. The metals are deeply oversold and a bounce can come at any time. Use it to your advantage!
Best wishes,
Larry

 World Economic Outlook
The International Monetary Fund (IMF) published their most recent outlook for the global economy Tuesday. While most of the headlines covered the IMF’s relatively tame outlook, the report also warned investors about financial excess. From the IMF:
Easy financial conditions, and the resulting search for yield, could fuel financial excess. Markets may have underpriced risks by not fully internalizing the uncertainties around the global outlook. A larger-than-expected increase in U.S. long-term interest rates, geopolitical events, or major growth disappointments could trigger widespread disruption.
How Concerned Should We Be?
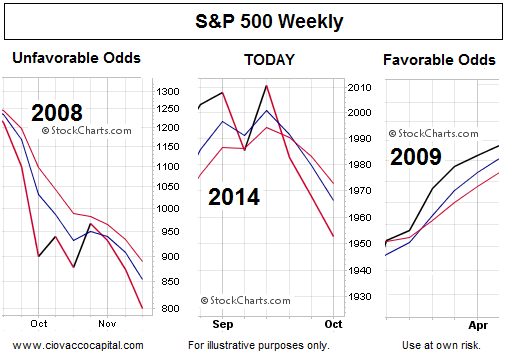
The charts below show the S&P 500 weekly during Tuesday’s session (middle), the S&P 500 in 2008 (left), and the S&P 500 in 2009 (right). While the market can find its footing at any time, the present day market is telling us to “pay closer attention to risk management” in the coming weeks. The charts below are described in more detail in a October 3 video clip.
Investment Implications – The Weight Of The Evidence
As noted in recent weeks, our market model has already called for a significant reduction in equity exposure based on the evidence we have in hand. Since it is not possible for stocks to drop for several weeks or several months without first taking out the S&P 500 levels shown below, we can use them as bull/bear guideposts in the coming sessions.
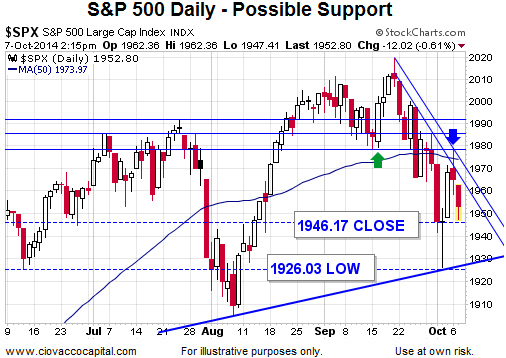
If the S&P 500 closes below last Thursday’s closing level of 1946, we will consider cutting our exposure to stocks (SPY) again. If the markets can respond favorably to the Fed minutes or Fed speakers this week, while remaining above 1946, we will try to exercise some “let’s see how things play out” patience.
About Chris Ciovacco
Chris Ciovacco is the Chief Investment Officer for Ciovacco Capital Management, LLC.

-
I know Mike is a very solid investor and respect his opinions very much. So if he says pay attention to this or that - I will.
~ Dale G.
-
I've started managing my own investments so view Michael's site as a one-stop shop from which to get information and perspectives.
~ Dave E.
-
Michael offers easy reading, honest, common sense information that anyone can use in a practical manner.
~ der_al.
-
A sane voice in a scrambled investment world.
~ Ed R.
Inside Edge Pro Contributors

Greg Weldon

Josef Schachter

Tyler Bollhorn

Ryan Irvine

Paul Beattie

Martin Straith

Patrick Ceresna

Mark Leibovit

James Thorne

Victor Adair