
Asset protection
Interest rates, oil prices, earnings, GDP, wars, peace, terrorism, inflation, monetary policy, etc. — NONE have a reliable effect on the stock market
You may remember that after the 2008-2009 crash, many called into question traditional economic models. Why did they fail?
And more importantly, will they warn us of a new approaching doomsday, should there be one?
This series gives you a well-researched answer. Here is Part VI; come back soon for Part VII.
Myth #6: “Wars are bullish/bearish for stocks.”
By Robert Prechter (excerpted from the monthly Elliott Wave Theorist; published since 1979)
… If the stock market is not reflecting macroeconomic realities, what else could it possibly be doing? Well, how about political news? Maybe political events trump macroeconomic events.
It is common for economists to offer a forecast for the stock market yet add a caveat to the effect that “If a war shock or terrorist attack occurs, then I would have to modify my outlook.”
For such statements to have any validity, there must be a relationship between war, peace and terrorist attacks on the one hand and the stock market on the other. Surely, since economists say these things, we can assume that they must have access to a study showing that such events affect the stock market, right?
The answer is no, for the same reason that they do not check relationships between interest rates, oil prices or the trade balance and the stock market. The causality just seems too sensible to doubt.
Claim #6: “Wars are bullish/bearish for stock prices.”
Observe in the form of this claim that you have a choice for the outcome of the event. Economists have in fact argued both sides of this one. Some have held that war stimulates the economy, because the government spends money furiously and induces companies to gear up for production of war materials. Makes sense.
Others have argued that war hurts the economy because it diverts resources from productive enterprise, not to mention that is usually ends up destroying cities, factories and capital goods. Hmm; that makes sense, too.
I will not take sides here. We can negate both cases just by looking at a few charts.
Figure 11 shows a time of war when stock values rose, then fell.
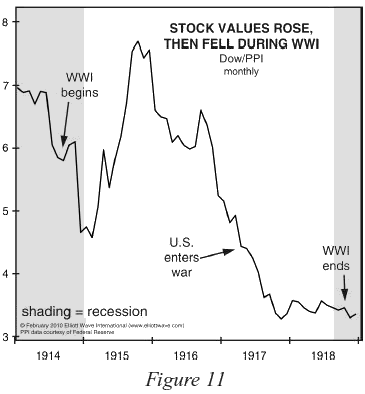
Figure 12 shows a time of war when stock values fell, then rose.
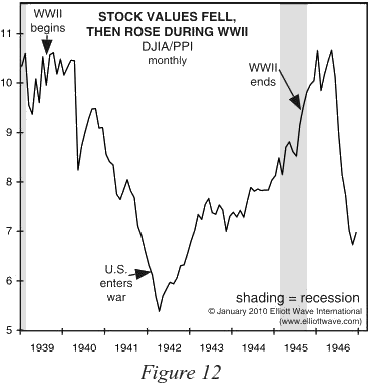
Figure 13 shows a time when stock values rose throughout.
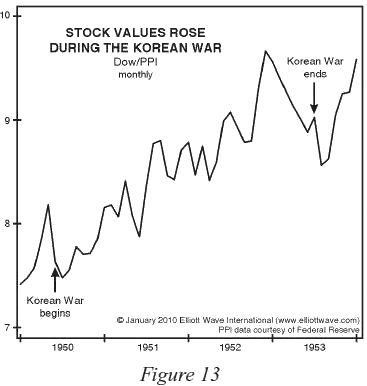
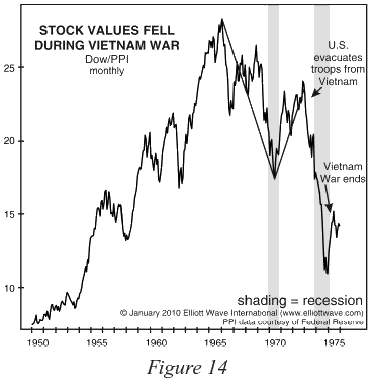
Figure 14 shows a time when stock values fell throughout.
Who wins the war seems to mean little, either. A group of Allies won World War I as stock values reached 14-year lows; and nearly the same group of Allies won World War II as stock values neared 14-year highs.
Given such conflicting relationships, why and how, exactly, does an economist expect war to affect his economic forecasts?
(Stay tuned for Part VII of this important series, where Prechter examines another popular investment myth: Namely, that “Peace is bullish for stocks.”)Free Report:

Stock Extended Their Sell-Off – Will Downtrend Continue?
Briefly: In our opinion, no speculative positions are justified at this moment. We will close our profitable short position with entry price of 2,000.5 (on August 27th, S&P 500 index) at the open of today’s trading session (cash market), as the S&P 500 is reaching our potential profit target of 1,900.
Our intraday outlook is neutral, and our short-term outlook is neutral:
Intraday (next 24 hours) outlook: neutral
Short-term (next 1-2 weeks) outlook: neutral
Medium-term (next 1-3 months) outlook: neutral
Long-term outlook (next year): bullish
The U.S. stock market indexes lost between 0.7% and 2.5% on Friday, extending their recent downtrend, as investors continued to sell stocks ahead of corporate quarterly earnings releases, among others. Our Friday’s bearish intraday outlook has proved accurate. The S&P 500 index got close to the level of 1,900, as it reached level of support marked by the early August local low and April-May consolidation. On the other hand, the nearest important resistance level is at around 1,920-1,925, marked by recent local lows, as we can see on the daily chart:

Expectations before the opening of today’s trading session are slightly positive, with index futures currently up 0.1- 0.2%. The main European stock market indexes have gained 0.1-0.5% so far. The S&P 500 futures contract (CFD) extended its downtrend earlier in the morning. However, it later managed to bounce off the support level at around 1,880. The nearest important level of resistance is at 1,900, marked by previous support level, as the 15-minute chart shows.

The technology Nasdaq 100 was relatively weaker as it accelerated a sell-off, getting closer to the level of 3,800. The nearest important support level is at around 3,800-3,820. On the other hand, the level of resistance is at 3,880-3,900, among others:

Concluding, the broad stock market accelerated its downtrend on Friday, breaking below last week’s consolidation. The S&P 500 index has almost reached our profit target level at 1,900. So, we decided to close our speculative short position at the open of today’s trading session (cash market). There are some short-term oversold conditions which may lead to an upward correction or downtrend reversal. Therefore, we prefer to be out of the market at this moment. We will let you know when we think it is safe to get back in the market.
Thank you.

 When it comes to commodities, you’ll usually find a set of countervailing forces that keep prices at an equilibrium. Yet when it comes to oil, all of the factors behind price swings are heading in the same direction. As oil prices head lower yet, investors will feel both pain and gain — depending on the make-up of their portfolios.
A Perfect Storm
For much of the past year, a barrel of West Texas Intermediate Crude fetched around $100 a barrel on the spot market. Yet since late July, a series of factors have conspired to push prices lower:
— A rally in the dollar, which tends to push all commodity prices lower.
— A further slowing in the European, Japanese and Chinese economies, which crimps demand.
— A surge in output in Libya to 800,000 barrels a day, up from 240,000 barrels a day in June amid civil war skirmishes near key oil installations.
— An oil production surge in Russia, which is back at peak post-Soviet era levels.
— A rapidly rising output in Kurdistan as new key oil installations come on line.
— OPEC’s recent inability to curtail production as much as the market had hoped, leading to talk that this cartel may be weakening as market share becomes more important than pricing discipline.
Of course, the elephant in the room is the United States, which is single-handedly disrupting the global supply and demand trends on a massive scale. U.S. oil production has already surged from five million barrels a day in 2008 to 8.5 million barrels a day in August 2014, according to the Energy Information Administration. The more we produce, the less oil we import. Analysts at Citigroup note that oil imports are now nine million barrels per day lower than they were in 2007. It’s important to note that some of the reduction is due to a drop in consumption as we now drive more fuel-efficient cars.
Foreign Affairs magazine was ahead of the curve, anticipating the current events in the oil market back in its May/June 2014 issue. The issue led off with a piece by Edward Morse, global head of commodities at Citigroup, who noted that “U.S. oil production could reach 12 million or more barrels per day or more in a few years and be sustained there for a very long time.” Morse thinks we’re headed for an era of $70-to-$90 oil over the long-term, a process which appears to have begun unfolding in recent weeks.
Before we focus on the winners in such a scenario, let’s look at the losers.
Falling oil prices begin to make major exploration projects economically infeasible. Domestically-produced oil in shale formations is fairly low cost. Citi’s Morse thinks most domestic wells will remain profitable as long as the spot market stays above $50. Some foreign producers, such as Saudi Arabia, also have low production costs and will simply see their oil revenues diminish, but not disappear.
Yet many other regions, either offshore or in remote inland regions, are very expensive to develop. And if oil moves below $80, then you’ll start to hear about canceled projects. That’s a tough backdrop for oil services companies such as Schlumberger Ltd (NYSE: SLB), Halliburton Co. (NYSE: HAL), Weatherford International Plc (NYSE: WFT) and many others.
Companies that lease and operate offshore oil rigs, such as Transocean Ltd (NYSE: RIG) and Diamond Offshore Drilling, Inc. (NYSE: DO) are already seeing an industry slowdown, and it may only get worse in coming quarters. Industry leader Schlumberger is a cautionary bellwether. Shares have pulled back in recent months to below $100, but they stood below $40 back in 2007, the last time this sector sharply slowed.
Notably, Schlumberger’s 2015 profit forecasts have barely budged over the past 90 days, even as oil price stumble. Management is likely to dampen 2015 expectations when quarterly results are released later this month. More broadly, any company that is dependent on either oil prices or oil drilling activity — especially offshore — may be poised for downward estimate revisions.
The Upside
Of course a slump in crude oil brings a wealth of benefits. For starters, consumers will soon see gasoline prices move to multi-year lows, providing spending power as we head into the holiday shopping season. The Energy Information Administration looked at this topic earlier this year, when oil was trading at $100 a barrel, and concluded that a move to $70 oil by the end of the decade would save U.S. households roughly $30 billion annually. They add that gasoline costs could drop, from 5% of total disposable income today to 3% by then.
Of course, airlines would also be a huge beneficiary of lower oil prices. Jet fuel prices have already dropped 7% from a month ago, according to International Air Transport Association and could drop further from here. Fuel is the second-largest expense for airlines, behind labor costs.
Beyond the issue of oil prices themselves, the growth in domestic output is altering the U.S. economy in another powerful way. In, 2011, the United States ran a $354 billion petroleum trade deficit. In a few years, that figure appears set to move into surplus. More than one million Americans are now working in the U.S. energy sector, providing an economic lift there as well.
Risks to Consider: The biggest factors behind a potential rebound in China is accelerating demand in China — which led to the 2008 “SuperSpike” in oil prices — or military conflict.
Action to Take — For several years, we’ve been reading about the United States’ rising oil production. Now we’re feeling the impact. Our growing supply is altering the equilibrium in global markets and when you consider that the United States, Russia and other countries aim to produce even more oil in coming years, oil’s move below $80 a barrel becomes increasingly likely. Shares prices have only just begun to respond to this new reality, and you need to scrub your portfolio of any companies that stand to lose from the changing energy industry dynamics.
Click here to get the free trading advisory — Trade of the Week.

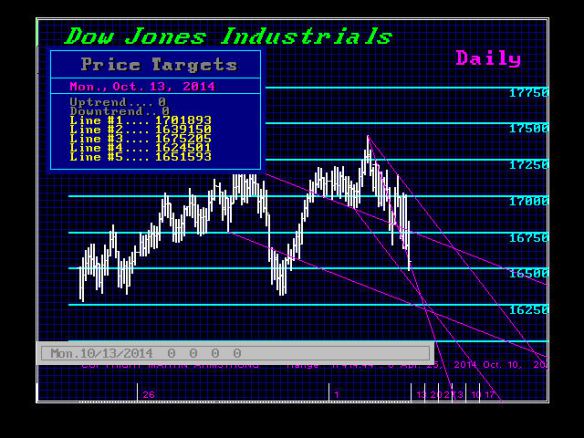
We have elected a Weekly sell signal in the Dow and this is warning that we may yet see that November low during the week of November 3rd. The critical support now lies at 15961 and a weekly closing beneath this area will warn of a sharp correction that will make people’s nose bleed. Nevertheless, our models show next week as a turning point with Directional Changes back-to-back for the next 2 weeks and high volatility for the week of 11/03. Critical support also lies at 15555/ Only a monthly closing below this area would warn of a sustained correction.
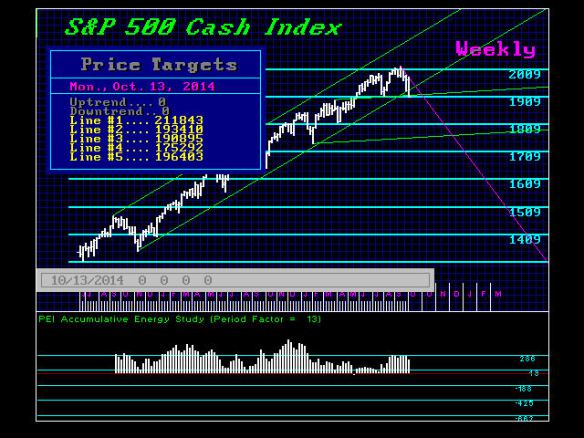
When we look at the cash S&P500, the market is stronger than the Dow reflecting the shift is still in place for the broader market leading. Our energy models are still bullish for the broad-term. Here we do see support lies at 1814 and 1766. We would need to see a monthly closing below 1814 to signal a sustained correction is possible. Where the Dow tends to target November, the S&P 500 targets December for a turning point with high volatility in November. The weekly turning points still show choppiness 10/13, 10/27, and 11/10. Key days next week will be Monday and Friday. This is the same targets in the Dow on a daily level.
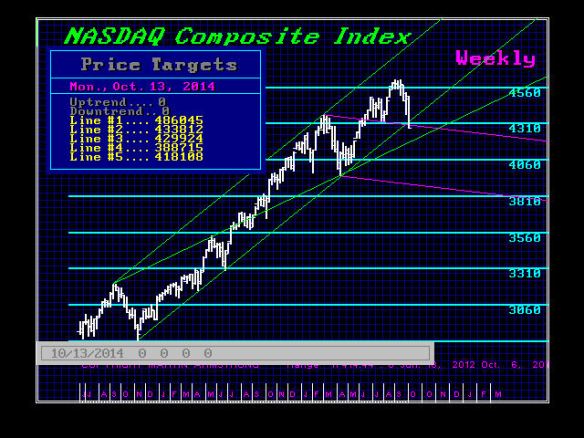
In the NASDAQ composite we see 10/13, 10/15, and 10/17 as daily targets with Wed showing high volatility. Here the key weekly targets are 10/13 and 10/27 followed by 11/10. Key support beings at 4239 and 4207. A monthly closing BELOW 4020 will signal a sustained correction. Keep in mind that November will be 72 months from the 2008 low in the NASDAQ. A low at that time on our long-range volatility models would imply we could set the stage for a strong rally after February.
….related from Martin: The Pending Phase Transition & Cycle Inversion
 Research Philosophy
The more we attend conferences across North America one of the many questions we continually entertain is that of our particular “investment philosophy.” Essentially, investors like to know what approach or style we use to uncover the stocks we recommend to our clients.
GARP (Growth at a Reasonable Price)
A significant portion of our strategy involves the search for GARP or Growth at a Reasonable Price. This means that we will recommend a stock because we believe the company to be a strong business that will grow over time and because we believe we are buying this company at a price that is significantly below its real or ‘intrinsic’ value (undervalued). The paragraphs below provide descriptions of a few of the attributes to which we pay very close attention.
Resilient Business Model
One thing we look at very closely is the resilience of a company’s business model. The business model is the plan that a company uses to convert whatever it does (product or service) into positive cash flow. There are a multitude of different types of business models out there, some of which are highly risky and some of which don’t make sense at all
(a common criticism of technology companies during the dot com boom). We look for business models that make sense and provide their respective companies with a great chance of growing during strong markets and at the very least, surviving during challenging markets. A resilient business model provides a unique or even essential product or service to customers that can easily afford to pay for it. An example would be a company that provides linen cleaning services under contract to hospitals. Another would be a company that owns and operates ATMs (automated teller machines) in strategic locations across the country. Yet another would be a company that processes and packages food products for distribution to international markets.
Profitability and Earnings Growth
As fundamental investors, first and foremost, we require that a company we research already be profitable and at the very least, provide strong potential for earnings growth. The earnings growth is what will drive the stock over the long term and provide the company with flexibility to grow their dividends. There are numerous companies in the market that are not profitable (may never have been profitable), but will attract themselves to investors under the promise of future profitability. The problem is that until these companies have achieved profitability, they will be entirely dependent on the market for raising funds to finance their survival (pay wages, pay bills, and invest in the business). If the markets, or that company’s particular industry, encounter any kind of danger, the very survival of the unprofitable company will be in serious jeopardy, as they will be unable to raise money or will be forced to raise money at terms injurious to the current shareholders. So for us, the unprofitable companies present too much risk.
Acceptable Level of Financial Risk – Healthy Balance Sheet
Financial risk refers primarily to the level of debt a company has incurred. All things equal, more debt means more financial risk and a higher likelihood of financial distress. A good deal of this risk is captured in the company’s balance sheet, which lists assets and liabilities. Ideally, we are looking for companies with large cash balances and little or no debt. Some companies that we research do maintain a debt balance; however, we believe this balance to reasonable respective to the company’s financial position. We look at the total debt balance, the regular interest payments, and the required principle payments and ascertain whether or not the company will have problems meeting its obligations. If debt is too high, the company is at high risk of suffering financial distress should the market enter a downturn. We therefore look for companies with acceptable levels of financial risk.
Strong Management Teams
Everyone has heard that they should invest in companies with strong management teams, but what exactly does that mean? What constitutes a strong management team? Analyzing management can be one of the more difficult steps in the research process. It means more than just getting along with the CEO. For us, we look not at what management is saying but what they are doing and what they have done. Analyzing management involves looking back as far as you can and tracking the correlation of what they have said they were going to do with what they have actually done. Have they made targets and met them? Have they managed the company prudently? Do they have a demonstrated track record of providing value to shareholders? Perhaps most importantly, do they hold significant shares in their own company – aligning their interests with shareholders.
Value – What We Pay For is What We Get
Value is the final ingredient in our investment equation. Understanding the value is important because “a good company is not necessarily a good stock.” What makes a good company a good stock is the price you pay for it. As a rule, we are looking for companies that we can buy at a significant discount. To ascertain this, we use a variety of tools including: ratios such as dividend yield, price-to-earnings, price-to-cash flow, and price-to-tangible book value. If our research tells us that we are getting a great deal on a stock then we may buy it. Conversely, if we own the stock and our research tells us that it is becoming overpriced, we may sell it.
For more insight on our philosophy in reference to our two key areas of research, click on the links below.
KeyStone’s Income Stock Service
KeyStone’s Latest Reports Section


-
I know Mike is a very solid investor and respect his opinions very much. So if he says pay attention to this or that - I will.
~ Dale G.
-
I've started managing my own investments so view Michael's site as a one-stop shop from which to get information and perspectives.
~ Dave E.
-
Michael offers easy reading, honest, common sense information that anyone can use in a practical manner.
~ der_al.
-
A sane voice in a scrambled investment world.
~ Ed R.
Inside Edge Pro Contributors

Greg Weldon

Josef Schachter

Tyler Bollhorn

Ryan Irvine

Paul Beattie

Martin Straith

Patrick Ceresna

Mark Leibovit

James Thorne

Victor Adair