Here is the latest Investors Intelligence report along with the all-important sentiment chart: Last Friday’s close showed a major rebound from Wednesday’s lows but the major averages still fell for the fourth straight week. There were turnaround signs with some indicator upturns and over 600 stock selling climaxes. Consecutive sessions with new stock buy signals in the majority added conviction to a positive momentum shift. The speed and size of the rebound wasn’t yet acknowledged by the advisors who remain overall cautious. As we go to print they are not yet convinced that the correction is over. That is a positive sign as they will have to increase their exposure if the rally gains traction. That should add fuel for more gains.

 sIBM went down hard on its quarterly earnings report this week. This made a splash in the news because, well, it’s IBM, and also Warren Buffett owns it, so it was a rare moment of human fallibility for him. But there is a lot more to the story than that. Very sophisticated people have been keeping an eye on IBM for some time.
 War, severe weather and record natural gas production are buffeting energy stock prices. Where can investors turn for safety? In this interview with
 The Energy Report: Energy stocks have faced a number of headwinds this year—everything from severe weather on the East Coast to conflicts in Eastern Europe and the Middle East to growing oil and gas production in the U.S. Are midstream master limited partnerships (MLPs) immune to the volatility of the commodities they carry?
John Edwards: Midstream MLPs are not immune to price changes, but they have less volatility than other kinds of energy stocks. Let me explain. With most MLPs, the assets are contracted. They’re fee-based, so they have minimal direct commodity risk. If MLP clients are not profitable, that will impact demand for the services that the midstream providers offer. So while MLPs don’t have direct commodity exposure, they certainly have indirect commodity exposure. A prolonged price slump would ultimately impact the return on upstream companies, and that would subsequently impact the demand for midstream services.
As long as oil prices stay above $80 a barrel ($80/bbl), we think producers will continue to produce as much as they can. If oil prices dip below $70/bbl, there could start to be curtailments. That would have a negative impact on MLPs because it would slow down demand for infrastructure.
TER: You recently stated that compared to the Standard & Poor’s 500, MLPs capture market upside swings better, without being as affected by the downside. What causes that?
 Source: Alerian.com; CS Estimates through Aug. 29, 2014
 Source: Alerian.com; CS Estimates
JE: During difficult economic times, people curtail purchases that can be postponed, like buying a car or a large appliance, or even eating out. But people are a lot less willing to freeze in their homes in the winter, whether they have income or not. Natural gas and crude oil are more stable in terms of demand than many other products. The bottom line is that the preponderance of long-term contracts results in stable revenues for midstream MLPs.
At the same time, we are in the midst of a technological shift. Demand for crude oil has been flat, despite the economic recovery, due to advances in fuel efficiency. On the other hand, the industry continues to access product in remote areas, thus increasing demand for infrastructure to get the product from where it’s produced to where it’s consumed. That infrastructure is typically contracted on a fixed fee basis, making the basic economics of that arrangement less volatile than the economy generally. That helps explain why MLPs are less volatile than the broader economic markets.
TER: Are MLPs vulnerable to the impact of sovereign debt and increasing interest rates?
JE: Let’s talk about interest rates first. Distributable cash flow for investors is calculated based on earnings before interest, taxes, depreciation and amortization (EBITDA), minus interest expense, maintenance capital and other items. That means when interest rates rise, there is less cash available for paying out distributions. It is that simple.
 Sovereign debt issues are more of a macroeconomic risk. Almost every financial crisis that has occurred in the U.S.—and for that matter, around the world—stemmed from an overabundance of debt. Today, there is too much debt on the balance sheets of almost every developed country in the world, including the U.S. That poses a rising risk to the overall well-being of the economy, because as long as countries overspend relative to revenue, they are dependent on external capital to finance that spending.
Absent changes in spending and borrowing behavior, Western countries face rising risk in having to pay a lot more to attract capital, particularly if such spending is rising relative to gross domestic product (GDP), just as smaller countries did during the financial crisis of 2009. Ultimately, oil and gas demand are at risk due to the risk of a debt-induced recession, and the pipelines that carry those resources could suffer hits to volume. The U.S. cumulative deficit relative to GDP is at record levels now, though annual deficit has recently come down in both absolute and percentage terms as the recovery has continued, albeit more slowly and at a lower magnitude than anyone would like.
TER: Do you think the market understands MLP fundamentals and is valuing the companies fairly?
JE: Are MLPs overvalued or undervalued? In view of recent volatility, both in the broader market as well as in energy and energy MLPs, that is a very interesting question. Investors have to consider their appetite for exposure to this sector, and what kind of total return they’re likely to experience. At the end of August, MLPs were trading at the lowest yields ever. Also, some individual issues may be overvalued or fully valued.
We argued last month that the sector was in the process of undertaking a revaluation due to the strong and visible fundamentals, which may run through the end of this decade. Traditionally, this sector has averaged 6% yields, although it has been up and down over the last few years. By the end of August, the Alerian MLP Index (AMZ:NYSE) was in the low 5% yield range and the Cushing MLP Total Return Fund (SRV:NYSE) was in the high 4% yield range. We argued that there is scarcity value because no other asset class has this combination of solid income potential and strong growth.
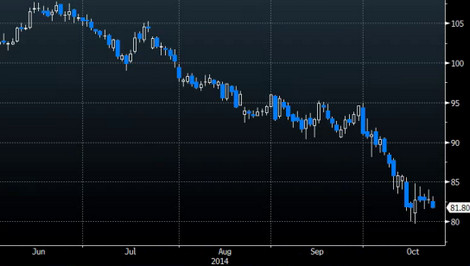
 Not long after we made the revaluation or rerating thesis, the MLP sector went through a very volatile few weeks, giving up virtually all the gains it had accumulated during the year, and bottoming out on Oct. 14. The whole energy complex also dropped sharply in response to weakening oil prices and moves by the Saudis to press for market share in the global oil market rather than cut production, as most investors in energy had expected.
Effectively, global crude supply was roughly 1.3 MMbbl/d above expectations this year, due to Libya reentering the crude export market, demand being less than expected, and North American oil supply from shale plays being greater than expected. Despite limited direct commodity price exposure, MLPs sold off hard before recovering most of that selloff in the span of just one week. Now MLPs sit roughly 5% below the peak they reached at the end of August.
We still contend that a rerating of MLPs is underway, given the combination of yield and growth potential. But if commodity prices drop below $70/bbl for crude and $3/thousand cubic feet for gas—and such drops were sustained—then the capital spending outlook, and ultimately the distribution growth outlook, would be adversely impacted. Consequently, MLP valuations would also be negatively impacted under that scenario.
However, given the Saudis’ track record and their role as the “central bankers of oil,” as Jan Stuart on our energy team likes to say, we believe they are more likely going to act to stabilize the crude market. All things considered, we believe oil is likely to stay in the $80/bbl range. Other than perhaps a potential wobble to the capital spending outlook, the distribution growth trajectory is likely to stay in the 6–9% range for the next several years.
Where the yields on MLPs ultimately settle out is harder to say, but we think there is greater recognition today of what MLPs have to offer investors.
TER: Let’s talk about the source of growth. As shale production moves from some of the established plays in the Bakken, Permian and Eagle Ford to some of the developing areas, like the Tuscaloosa and Mississippi Lime, is that creating demand for more pipelines and storage?
JE: Yes. We would argue that there is still a lot of demand for natural gas processing assets and pipelines in the Bakken, to process product otherwise going to waste. The Eagle Ford is clearly more established, but we’re still seeing areas in West Texas with rising productivity that will create demand for more assets.
 One area you didn’t mention was the Marcellus. That’s an area where we think there will be tremendous growth and production between now and the end of the decade. Over the last six years, production has gone from 1 billion cubic feet per day (1 Bcf/d) to 16 Bcf/d, which is an astounding number. We expect that, by the end of the decade, production will grow another 50%. That is creating tremendous demand for either reversing flows on pipelines or for additional pipelines.
TER: What are your estimates for the amount that will be spent on midstream infrastructure in 2014 and 2015?
JE: Our estimate for 2014 is $45 billion ($45B), and we foresee about the same level of spending in 2015. Overall, midstream spending depends upon which macro study you believe. A study by the American Petroleum Institute (API) indicated $890B of spending on midstream infrastructure over the next 11 years. Another study, by the Interstate Natural Gas Association of America, indicated $640B in spending over 20 years. That is a wide range—$81B/year compared to $32B/year. We think the API study is closer to the mark. Either way, there is still a tremendous amount of capex spending expected over the next decade.
TER: What is the fastest-growing segment of the MLP market? Is it oil and gas transportation or processing?
JE: We estimate oil and gas transportation to account for approximately 60% of capital spending, and gas gathering and processing to account for about 20%. We also expect a lot of investment to occur in the export of natural gas in the form of liquefied natural gas. Gathering, terminals and rail transportation are also growing areas.
TER: Which companies should we be watching during the historically busy fall MLP buying season?
JE: I don’t know if I’d call the fall an MLP buying season. We typically see stronger buying during the first month of each quarter because investors are positioning themselves to capture the distributions declared somewhere between the fourth and the sixth weeks of the quarter. Companies go into the market to raise capital in the middle of the quarter, so returns are typically lower during that time. In the third month of the quarter, investors start to position toward the end of that month for the expected distribution capture for the first month of the quarter, and the cycle repeats.
As far as which companies we like, in the wake of the recent volatility, pullback and the ensuing rebound, we like Williams Companies (WMB:NYSE), Targa Resources Corp. (TRGP:NYSE), Kinder Morgan Inc. (KMI:NYSE), EnLink Midstream LLC (ENLC:NYSE),EnLink Midstream Partners L.P. (ENLK:NYSE), Tallgrass Energy Partners L.P. (TEP:NYSE), Enterprise Products Partners L.P. (EPD:NYSE) and NiSource (NI:NYSE), just to name a few.
We think Kinder Morgan’s decision to consolidate its MLPs into the owner of the general partner, Kinder Morgan Inc., is going to put it in position to grow a lot faster. In particular, it’s going to lower its cost of capital by removing the burden of incentive distribution rights.
TER: Is the $70B consolidation deal aimed at enabling growth or enhancing value?
JE: Kinder Morgan had outgrown the usefulness of the incentive distribution rights. They were becoming a burden. The cost of capital was uncompetitive relative to other companies despite the fact that Kinder has an absolutely gigantic footprint and is very successful. Some of the other large companies, such as Enterprise Products Partners, took out their general partners four years ago. That meant Enterprise could outbid Kinder all day long and could grow distributions faster than Kinder. It was getting a much better valuation as well. The time had come to do something. We expect shareholders to approve the consolidation transaction and expect it to close by the end of this year.
TER: EnLink’s growth has been both through acquisition and expansion so far. Are you expecting it to focus more on one of those going forward?
JE: I think it is going to be a combination of both. EnLink came into existence as a result of a merger between the old Crosstex Energy L.P. (XTEX:NASDAQ) and Devon Energy Corp. (DVN:NYSE). A number of assets that reside at the Devon midstream level are going to be dropped down into EnLink. Crosstex also brought with it significant capital spending opportunities, on the order of about $1B. In addition, a number of acquisitions and organic opportunities are being evaluated. We believe EnLink will continue to execute on its plan to double its EBITDA by 2017. We don’t think the valuation fully reflects the objectives that have been set out by management.
TER: Investors can gain exposure to EnLink through the general partnership or the MLP. What are the pros and cons for both retail and institutional investors?
JE: I don’t think it makes that much difference if an investor is retail or institutional. The consideration is whether investors want to participate in the lower-yield but faster-growing general partner, or the slower-growing but higher-yield limited partner. Currently, in terms of our total return outlook, we’re relatively indifferent. We think the total return opportunity is similar.
TER: You also watch Williams. What catalysts are on the radar there?
JE: Williams is on the Credit Suisse Focus List. The market does not appear to be fully valuing what we believe is the dividend growth potential of the company. One thing that has held Williams back is the restart of its Geismar Olefins steam cracker, which went down about a year ago. It could restart in Q4/14.
 Williams also has a very large backlog of projects. It has multiple billions of dollars in opportunities going forward. An activist investor has triggered a restructuring of some of the underlying limited partners. That has provided a catalyst for the general partner. At the general partner level, we’re still expecting dividend growth over the next few years to be in excess of 20%. It could be 25%+ in the next couple of years, and in the mid-teens over the next five years.
TER: Another company that you mentioned is Tallgrass. It recently announced an expansion to its Pony Express pipeline, in which it has a one-third ownership interest. How will this impact the stock?
JE: We see that as a very positive development for Tallgrass. It was an expansion we weren’t specifically expecting.
We are assigning a 50% probability of the expansion happening, which we estimate is worth approximately $5/unit. Even without the expansion, we expect distribution growth in the mid-teens over the next five years, and investors still can get a high 3s yield on the units, which is pretty attractive in our view.
TER: Do you see yields overall increasing going forward, or are some sectors and companies going to pay out more than others? How will those yields compare to U.S. treasuries?
JE: That is the question on a lot of investors’ minds right now. We think distribution growth in general is rising. We project 2014 Alerian MLP index distribution should average about 7%, maybe 7.25%. We think that number will go up next year, somewhere in the neighborhood of 50 to 75 basis points. The overall average—on an equal-weighted basis as opposed to a market cap-weighted basis—is going to be even higher, probably in the 9% range. The median is about 6% right now, but we expect those numbers to push higher in the next few years given the amount of capital being deployed.
As the Federal Reserve eases back on bond buying, and interest rates start to move up in the next year, we could see a tug of war. MLP growth rates can do a lot to offset potential headwinds from interest rates. Assuming the interest rate move is relatively smooth, we think the sector will handle it just as it has in the past.
TER: Thank you for your time.
JE: Thank you.
John Edwards joined Credit Suisse in April 2012 as a director and senior equity research analyst covering publicly traded MLPs involved in energy and energy infrastructure, along with pipeline companies and companies that own the general partners to energy MLPs. Prior to joining Credit Suisse, he was senior vice president and senior equity research analyst for Morgan Keegan & Company Inc. Edwards also worked in equities research with Deutsche Bank Securities as a vice president and senior analyst covering natural gas pipelines. Prior to working in equities research, he held positions in project finance and business development for an affiliate of Edison International. He received his bachelor‘s degree in economics from Occidental College, and a master‘s degree in business s administration from California State University, Fullerton. He is a member of the Financial Analysts Society of Houston, Texas, and holds the CFA designation from the CFA Institute.
Want to read more Energy Report interviews like this? Sign up for our free e-newsletter, and you’ll learn when new articles have been published. To see a list of recent interviews with industry analysts and commentators, visit our Exclusive Interviews page.
Related Articles
- Play Defense and Offense with MLPs: John Edwards
- Energy Master Limited Partnerships Go Mainstream: Baird’s Ethan Bellamy
- How to Exploit the Coming Natural Gas Export Explosion: Frank Curzio
DISCLOSURE:
1) JT Long conducted this interview for Streetwise Reports LLC, publisher of The Gold Report, The Energy Report, The Life Sciences Report and The Mining Report, and provides services to Streetwise Reports as an independent contractor. She owns, or his family owns, shares of the following companies mentioned in this interview: None.
2) The following companies mentioned in the interview are sponsors of Streetwise Reports: None. The companies mentioned in this interview were not involved in any aspect of the interview preparation or post-interview editing so the expert could speak independently about the sector. Streetwise Reports does not accept stock in exchange for its services.
3) John Edwards: I own, or my family owns, shares of the following companies mentioned in this interview: None. I personally am, or my family is, paid by the following companies mentioned in this interview: None. I was not paid by Streetwise Reports for participating in this interview. Williams Companies, Kinder Morgan Inc., EnLink Midstream LLC, EnLink Midstream Partners, Tallgrass Energy Partners, Targa Resources Partners L.P. (Targa Resources Corp.) and NiSource currently are or have been clients of Credit Suisse during the past 12 months. Credit Suisse has provided investment banking services and received financial compensation from Williams Companies, EnLink Midstream LLC, EnLink Midstream Partners and Tallgrass Energy Partners within the past 12 months. Credit Suisse expects to receive, or intends to seek, investment banking-related compensation from Targa Resources Partners L.P. (Targa Resources Corp.), EnLink Midstream LLC, EnLink Midstream Partners, Enterprise Products Partners, Tallgrass Energy Partners and NiSource within the next three months. Credit Suisse has acted as lead manager or syndicate member in a public offering of the securities of Williams Companies, Tallgrass Energy Partners, EnLink Midstream LLC and EnLink Midstream Partners within the past three years. Comments and opinions expressed are my own comments and opinions. I determined and had final say over what companies would be included in the interview based on my research, understanding of the sector and interview theme. I had the opportunity to review the interview for accuracy as of the date of the interview and am responsible for the content of the interview.
4) Interviews are edited for clarity. Streetwise Reports does not make editorial comments or change experts’ statements without their consent.
5) The interview does not constitute investment advice. Each reader is encouraged to consult with his or her individual financial professional and any action a reader takes as a result of information presented here is his or her own responsibility. By opening this page, each reader accepts and agrees to Streetwise Reports’ terms of use and full legal disclaimer.
6) From time to time, Streetwise Reports LLC and its directors, officers, employees or members of their families, as well as persons interviewed for articles and interviews on the site, may have a long or short position in securities mentioned. Directors, officers, employees or members of their families are prohibited from making purchases and/or sales of those securities in the open market or otherwise during the up-to-four-week interval from the time of the interview until after it publishes.