
Asset protection
 We’ve all heard horror stories of Canadians in the US without travel or medical insurance.
What you may not know about are losses by Canadians who own US recreation or investment properties. Flash floods in Palm Springs and Arizona, wild fire and windstorm damage to name a few.
If you have questions about your US home, auto, travel or medical protection – we can help.
Call HUB’s toll free line 1-844-SNO-BIRD that’s 1-844-766-2473
Or CLICK HERE to email us with a suggested time you would like to be contacted by a HUB cross-border representative. Please include your phone # and hometown.


Ttoday’s videos:
Silver Key Moving Averages Charts Analysis
Dow Technical Deterioration Charts Analysis
TLT (T-Bond Proxy) Volume-Based Breakout Charts Analysis
Gold Needed Pullback Is Here Charts Analysis
Gold Stock Drawdowns Avoidance Charts Analysis
GDXJ Bullish Non-Confirmation Charts Analysis
Thanks,
Morris
Morris Hubbartt
trading@superforcesignals.com
trading@superforce60.com
Super Force Precious Metals Video Analysis
posted Oct 24, 2014
| Friday Oct 24, 2014 Super Force Signals special offer for Money Talks Readers: Send an email to trading@superforcesignals.com and I’ll send you 3 of my next Super Force Surge Signals free of charge, as I send them to paid subscribers. Also, to understand why the upcoming referendum on gold in Switzerland is important, please click this video link. |
The SuperForce Proprietary SURGE index SIGNALS:
25 Surge Index Buy or 25 Surge Index Sell: Solid Power.
50 Surge Index Buy or 50 Surge Index Sell: Stronger Power.
75 Surge Index Buy or 75 Surge Index Sell: Maximum Power.
100 Surge Index Buy or 100 Surge Index Sell: “Over The Top” Power.
Stay alert for our surge signals, sent by email to subscribers, for both the daily charts on Super Force Signals at www.superforcesignals.com and for the 60 minute charts atwww.superforce60.com
About Super Force Signals:
Our Surge Index Signals are created thru our proprietary blend of the highest quality technical analysis and many years of successful business building. We are two business owners with excellent synergy. We understand risk and reward. Our subscribers are generally successfully business owners, people like yourself with speculative funds, looking for serious management of your risk and reward in the market.
Frank Johnson: Executive Editor, Macro Risk Manager.
Morris Hubbartt: Chief Market Analyst, Trading Risk Specialist.
website: www.superforcesignals.com
email: trading@superforcesignals.com
email: trading@superforce60.com
SFS Web Services
1170 Bay Street, Suite #143
Toronto, Ontario, M5S 2B4
Canada
###
Oct 24, 2014
Morris Hubbartt

Summary:
- Global stock markets lost over $5.5 trillion in value during recent sell off.
- Central bankers took to the speaking circuit to arrest the market decline.
- Fear readings and oversold conditions last seen in 2011.
- Strength of current bounce to help settle bull and bear debate.
- Several supports argue for near-term bullish outlook.
Over $5.5 trillion in value has been erased in global equities since they peaked in September and stabilized last Wednesday. The S&P 500 lost nearly 200 points with the Dow shedding nearly 1500 during the correction. Commodities took a nosedive as well West Texas Intermediate Crude, which fell nearly $28/barrel from a high of $107.73 in June to $79.78 last week. Selling climaxed when the Dow fell over 450 points last Wednesday; though panic selling quickly turned into panic buying as selling pressure was exhausted.

The historical chart for the index shows last week’s readings were the lowest in two years as investors’ risk appetites evaporated:
….continue reading HERE
Emotionally shattered from seeing their wealth cut in half twice – once in 2000 and again in 2007-2008, 55% of Americans have no money in the stock market at all, according to a Federal Reserve Board analysis from last year.
According to Keith Fitz-Gerald, that would be different if only those people would look at this chart of the Dow Jones over the last 114 years:
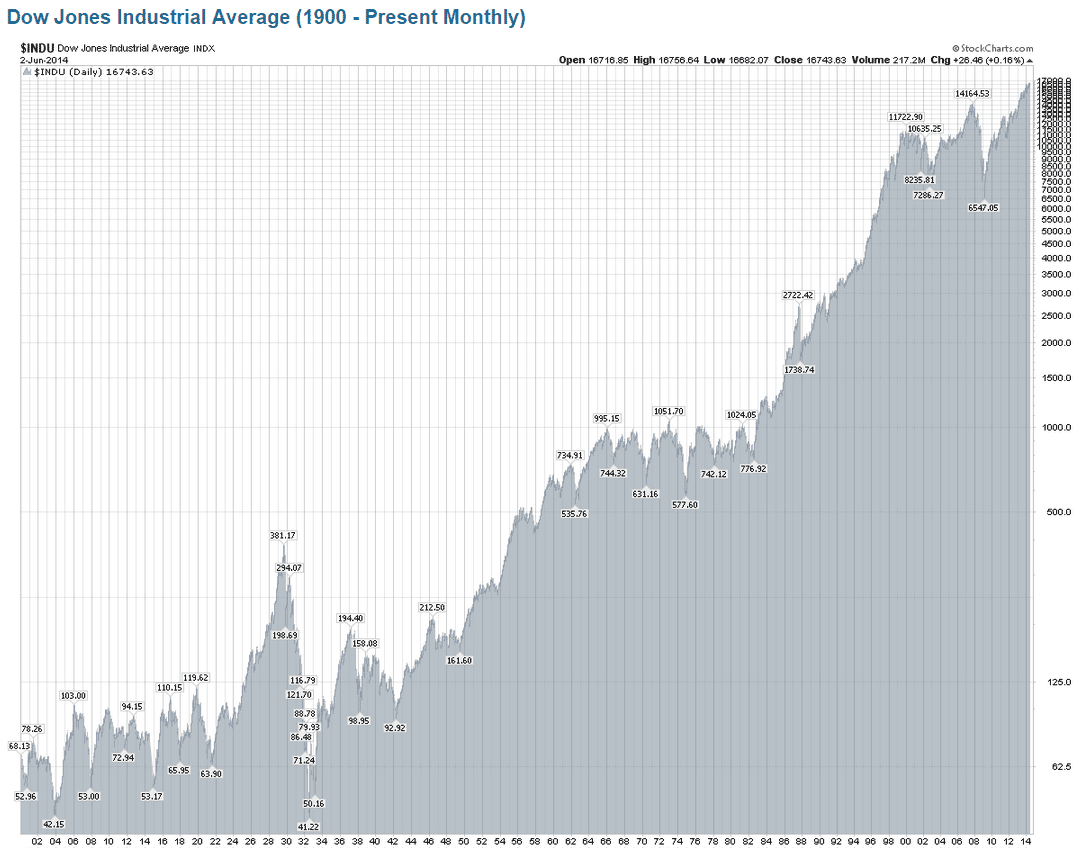
Despite two world wars, multiple invasions, presidential assassinations, the Cold War, hot wars, recession, depression, and all manner of events that no doubt seemed “catastrophic” at the time, it continued to push higher.
Since 1900, it rose a staggering 24,285%.
Why did it keep going up?
…continue reading HERE

As the increasingly volatile stock markets bounced back higher today, JP Morgan experienced one of the largest withdrawals of gold from its inventories this year. In just one day, a stunning 321,500 oz of gold (10 metric tons) were removed from JP Morgan’s Eligible inventories.
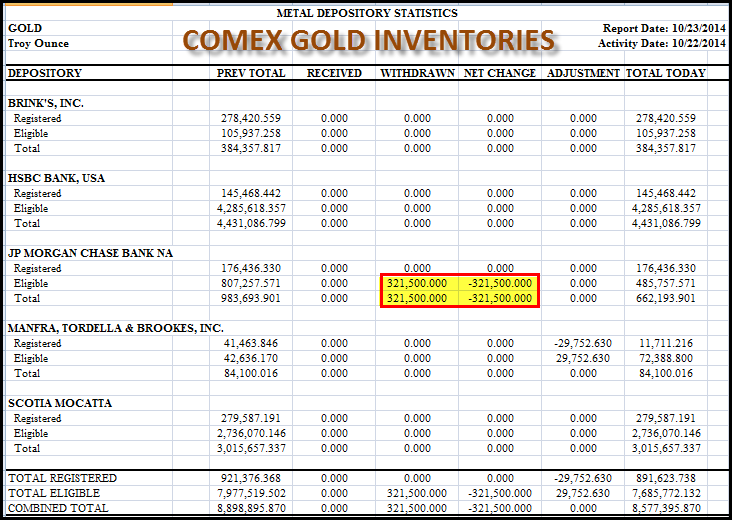
Total gold inventories at JP Morgan fell 33% from 983,693 oz yesterday, to 662,193 today. Of course, this had to come from JP Morgan’s Eligible inventories, because there are only 176,436 oz of gold in their Registered inventories.
You will notice, that the amount is exactly 321,500 oz (10 metric tons) to the TEE… and as Harvey Organ and Bill Holter have commented, it’s extremely rare for a gold bar or series of gold bars to equal exactly 10 metric tons. Instead, we should see a fraction of an amount shown as an example in the MANFRA, TORDELLA & BROOKES gold transfer of 29,752.630 oz from the Registered category to Eligible.
Looks like this transfer was LEGIT as we can see the fraction of 0.630 oz shown in the transfer. I gather JP MORGAN feels that it doesn’t need to be bothered with accounting for these silly fractions, when they have to deal with much larger numbers such as the $70 trillion of Derivatives on their balance sheet.
It will be interesting to see if this 10 metric ton gold withdrawal from JP Morgan becomes an entry in one of the other Bank’s vaults in the next day or so. Or maybe, it’s on its way to CHINA or INDIA. Either way… just another interesting data point taking place as the broader stock markets continue to CONVULSE up and down like someone suffering from a HEART-ATTACK.
Please check back for new articles and updates at the SRSrocco Report.


-
I know Mike is a very solid investor and respect his opinions very much. So if he says pay attention to this or that - I will.
~ Dale G.
-
I've started managing my own investments so view Michael's site as a one-stop shop from which to get information and perspectives.
~ Dave E.
-
Michael offers easy reading, honest, common sense information that anyone can use in a practical manner.
~ der_al.
-
A sane voice in a scrambled investment world.
~ Ed R.
Inside Edge Pro Contributors

Greg Weldon

Josef Schachter

Tyler Bollhorn

Ryan Irvine

Paul Beattie

Martin Straith

Patrick Ceresna

Mark Leibovit

James Thorne

Victor Adair