
Gold & Precious Metals
Last week we argued that the underperformance of the gold miners during Gold’s rebound was a bad sign. Since then the miners have plunged to new lows while Gold appears to be at the doorstep of a major breakdown below $1180. It shouldn’t be a surprise as it would simply be following the miners and Silver. The current bear market is getting very long in the tooth but it is not yet over. We see more losses ahead before a potential lifetime buying opportunity.
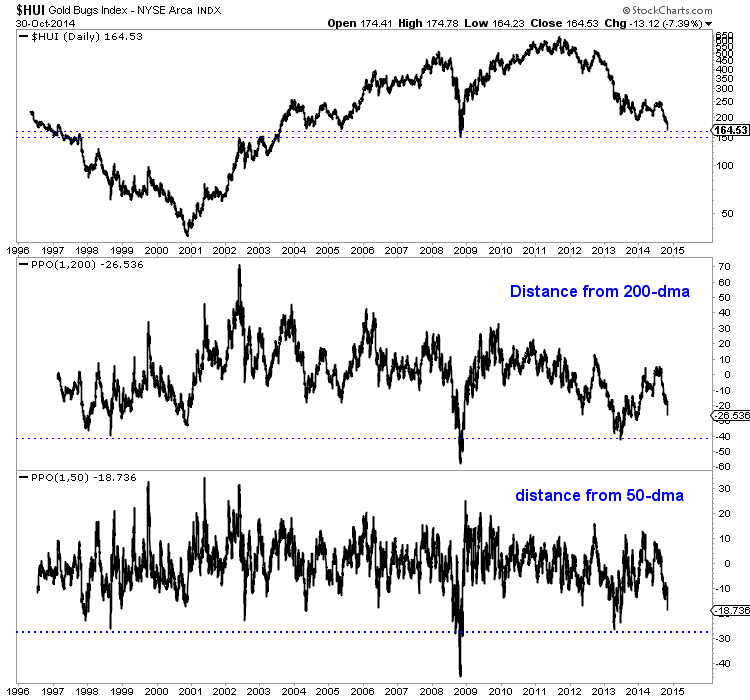
The HUI Gold Bugs Index is obviously very oversold but its not yet at strong support. It closed Thursday at 164 but should fall another 9% to support at 150. Currently the HUI is 26% below its 200-day exponential moving average and 19% below its 50-day moving average. The chart argues that those figures need to reach 40% and 27% before we deem the oversold condition extreme. If the HUI trades below 150 then it would mark an 11-year low. That is extreme!
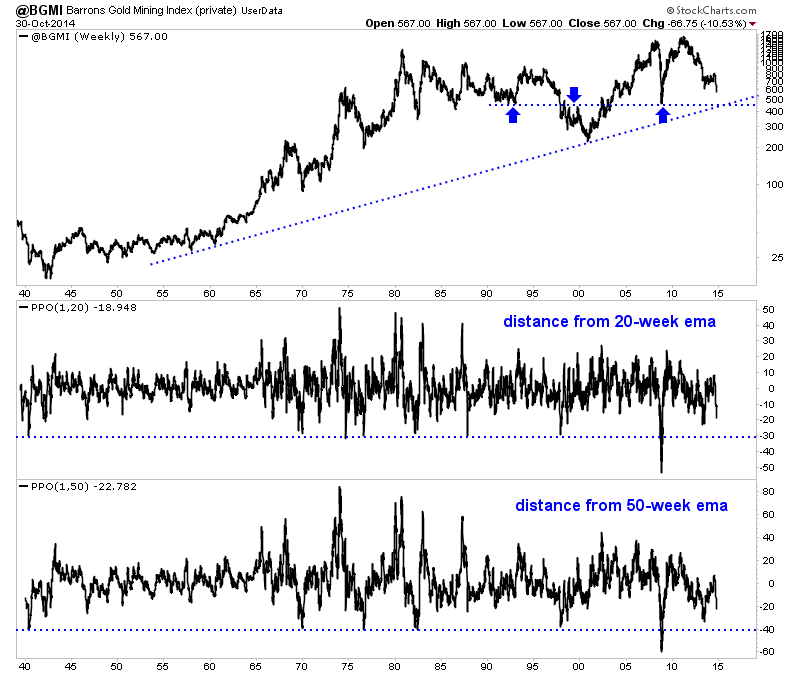
Nick Laird of ShareLynx provided me data from the Barron’s Gold Mining Index (BGMI) which I uploaded to stockcharts.com. This index dates back to 1938 and allows for greater historical perspective. Data is updated weekly so I had to estimate the current price. The HUI, XAU and GDX are all down 10% or 11% on the week so I calculated a 10.5% loss on the week which is a price of 567. Lateral support, which dates back to the early 1990s as well as trendline support that dates back 50 years provide a strong confluence of support in the mid 400s. That is roughly 20% downside.
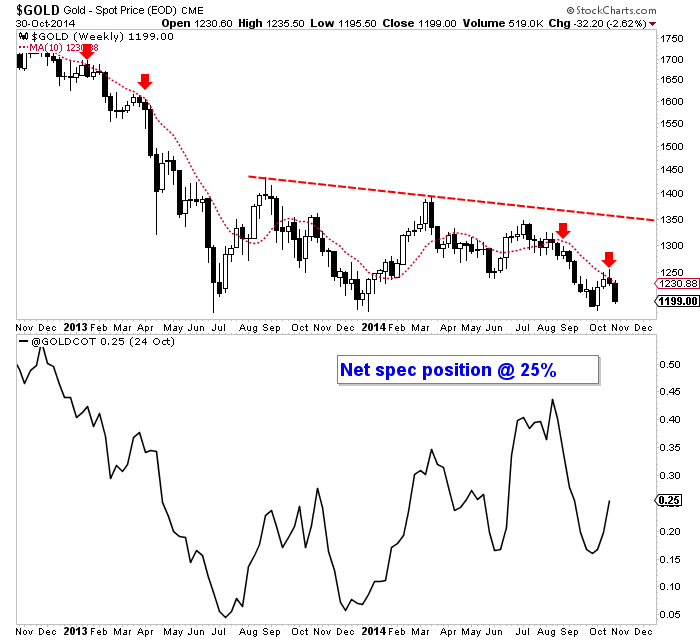
Another reason to expect more downside is Gold hasn’t even broken $1180 yet, though it may have by the time you read this. The price action has been textbook bearish. Gold failed to rally up to trendline resistance in the summer and then it declined in nine of twelve weeks. It rebounded for two weeks but quickly reversed at the 10-week moving average which is sloping down sharply. Also, the net speculative position in Gold as of a week ago was 25% of open interest. There are a fair amount of longs left to capitulate. Gold’s downside support targets are $1080, $1040 and $1000.
We’ve been warning for several weeks of the near-term downside potential in precious metals. It is being realized but that does not mean its over. The miners plunged to new lows in recent days yet they are likely to move lower before a major turn. Our work above suggests a minimum of 9% downside potential and as much as 20%. Meanwhile, Gold could fall another 15% to strong support at $1000. Opportunities are coming but they are not here yet. We want to see Gold and gold stocks decline further so that they become extremely oversold as they reach major support levels. That is the combination that could produce a lifetime buying opportunity in the weeks or months ahead. Consider learning more about our premium service including a report on our top 5 stocks to buy at the coming bottom.
Good Luck!
Jordan Roy-Byrne, CMT

As noted in detail on May 14, it is always important to understand both the bullish and bearish case for stocks. We recently noted two potentially bullish developments: an unprecedented drop in investor fear, and what appears to be a successful retest of a long-term breakout for the broad NYSE Composite Index. While the headline number for Thursday’s GDP report was impressive, the report contained something that may keep the Fed in a market-friendly mode.
A Dovish GDP Report?
 A case can be made that this week’s GDP report was skewed favorably by Uncle Sam. From Bloomberg:
“The GDP number’s fine, not spectacular,” Michael Block, chief equity strategist at Rhino Trading Partners LLC in New York, said by phone. “The inflation data isn’t great and the quality of the GDP beat isn’t great as a lot of it is from government and defense spending. It adds to dovishness.”
Fear Of Deflation Impacts Fed
Low inflation can eventually slip into deflation territory. Once deflation takes hold, it can morph into a negative feedback loop know as a deflationary spiral. If you were surprised that bonds started strongly Thursday after what appeared to be a strong GDP report, there is a logical explanation. Bond buyers were focused on the inflation data. From The Wall Street Journal:
The lack of inflation in the U.S. and around the world remains a concern for economy watchers and a key factor keeping bond buyers around. Within Thursday’s GDP report, the price index for personal consumption expenditures rose at a 1.2% annual rate in the third quarter, from 2.3% in the second quarter.
Investment Implications – The Weight Of The Evidence
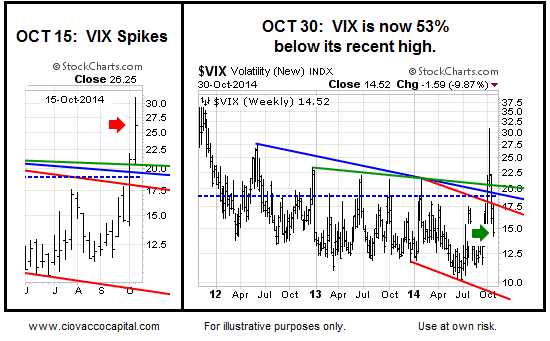
As noted in last week’s video, the improvement in the hard evidence has allowed us to scale into equity positions numerous times in the past two weeks. The “fear reset” in the VIX is still holding in a bullish manner for equities (see below). If the market can continue to gain traction based on earnings, GDP, and tame inflation data, we will most likely continue to increase equity exposure.
Concerns Remain
Europe’s economy and low inflation could eventually impact the USA. We must also continue to keep an open mind about all outcomes as the Fed begins to normalize interest rates.


Investors fear a stock market collapse. What they should really fear is a bond market collapse or more specifically a debt collapse. A stock market collapse can cause considerable damage. Debt collapse could lead to bankruptcy and an economic depression.
There is a lot more debt in the world then there are equities. The global stock market is estimated to be about $64 trillion. Total global indebtedness, according to ING Economics is $223.3 trillion. And that was back in 2013. Given that debt is estimated to grow by at least 10% annually total debt today could be $246 trillion. The debt number includes public sector debt, financial sector debt and household and corporate debt. It does not include the Chinese shadow banking system. Given an estimate of global GDP at about $72 trillion, that gives rise to a global debt/GDP ratio of 342%.
A ratio of 342% is not far off of the total debt/GDP ratio of the US estimated at 348%. The US is not the highest. Great Britain is closer to 550% and Japan is closer to 650%. Is a high debt/GDP ratio a problem? Debt is not a problem as long as the debtor has sufficient cash flow to cover debt service (interest). The principal? Well as long as the country, the corporation or the individual has sufficient resources and the capability to service the debt, the debt most likely is just rolled over. The problems start when the country, the corporation or the individual no longer has the capability to service the debt let alone have the resources to pay it back.
Trouble is the inability to service the debt happens more often than people would like to admit. History is replete with “this time is different” when debt levels pile up and then everyone is shocked when the financial crisis breaks – whether it was currency debasements, banking panics or the more recent subprime collapse of 2007-2009. In 1998, a Russian default triggered the collapse of Long Term Capital Management (LTCM) a giant hedge fund. The collapse of LTCM almost brought down the financial system. It was saved by a bailout from Wall Street with assistance from the Federal Reserve.
But it doesn’t stop there. From 2000-2002 the financial system was once again put under severe pressure with the collapse of the high tech/internet bubble coupled with 9/11. The Fed came to the rescue slashing interest rates and flooding the financial system with liquidity. That set in motion the housing bubble that culminated in the subprime collapse and the financial crisis of 2007-2009. Not only did the Fed have to come to the rescue, Governments had to come to the rescue with a bailout of the banking system including billions of taxpayer funds as well as flood the financial system with liquidity and lower interest rates to zero in order to save the financial system from complete collapse.
Since then the Fed has gone through three iterations of quantitative easing (QE) and have maintained official interest rates at 0-0.25% for an unprecedented five years with few if any signs of lifting low interest rates any time soon despite speculation that they might sometime in the future. The period 2009-2014 has seen at best tepid uneven growth despite the addition of trillions of dollars in QE in an attempt to kick start the economy.
The Fed’s balance sheet has exploded from roughly $800 billion to $4 trillion in five short years. US Government debt has soared from $9.7 trillion at the end of 2007 to $17.8 trillion today. GDP not so much, growing from $14.3 trillion in 2007 to $16.6 trillion today. Some fear that the next financial crisis could overwhelm the Fed. Maybe that is why the major OECD countries have changed from a regime of “bailouts” to one of “bail-ins” where the depositor pays rather than the taxpayer.
Of course, it does not stop with the US. The European Union zone has been through financial crisis after financial crisis for the past five years and they are now entering their third recession during that period. The ill-conceived European Union (EU) using the Euro as the currency left a neutered central bank (the ECB) to coordinate the economies of effectively 28 member states each of who maintained their own central banks and ability to run their own economies and in some cases (Great Britain) maintained their own currency. Using a common currency, the weak economies were able to borrow huge amounts of money in order to bring their standards up towards the highest standard Germany. Whether they had the capability to service the debt let alone repay it seemed to be an afterthought.

Source: www.stlouisfed.org
Japan has been through a series of rolling recessions since they first collapsed in 1990. This has happened despite a huge build-up of debt that has now created a Government debt/GDP ratio of 235%. Debt growth has been relentless. As noted, global debt has been growing at roughly 10-11% annually even as global GDP has been growing at only 3-3.5% and the advanced economies have been experiencing growth in the 2-2.5% range.
There is little thought at this time of a debt collapse in the US or even Japan. But the EU is potentially a problem. Debt has grown to unsustainable levels in a number of “periphery” EU economies. They are Portugal, Ireland, Italy, Greece and Spain or as some like to call them “the PIGS”. During the recent stock market sell-off yields on government debt of these countries leaped. Yields on weak corporates in the EU zone also jumped. The PIGS have considerable problems. They have high total debt/GDP ratios ranging from close to 300% for Italy to in excess of 400% for Ireland. It doesn’t sound that bad when compared to the US, Great Britain and Japan but then their economies do not have the economic depth and capability of those countries. The headline unemployment rates in the PIGS are respectively 15.4%, 11.4%, 12.3%, 26.4% and 24.4%. Youth unemployment is upwards of 50% in some cases.
QE is ending in the US. Supposedly, it is a sign that the US economy has been performing well. Headline unemployment is down to 5.9% but according to Shadow Stats www.shadowstats.com the unemployment rate is 23.1% when one counts all of the long-term discouraged workers unemployed and those working part time seeking full time positions. Long-term discouraged workers are not considered a part of the US labour force. US economic growth has been very uneven with the upper 20% of the economy doing well while the remaining 80% continues to hang on – barely. The housing market despite supposedly strong growth remains sharply below the peak of 2006. Corporate earnings have surpassed previous periods but they are now at levels higher than they were prior to the 2008 financial collapse.
The end of QE in the US has been problematic for numerous other countries. Countries that are dependent on international financing to finance their deficits are now having trouble raising foreign capital. Countries such as Turkey, Brazil, India, South Africa and Indonesia have seen a move out of their currencies that are now exacerbating domestic problems. The yanking back of QE in the US is resulting in a drying up of liquidity for international markets. QE acted as a stimulus not just for the US economy but also for the rest of the world. Take away the QE and problems start to develop. That is how dependent the world was on the US’s QE. But without QE the tepid growth seen in the past five years would most likely not have happened.
No one is stepping up to replace the US’s QE. The EU has constantly vacillated about QE and has never really put in place what one would call a QE program comparable to what the US had. It is hard because Germany runs the EU and the Germans are understand the dangers of programs such as that. Instead austerity replaced QE and that in turn has also been a disaster as the EU economies teeter between tepid growth and outright recession. The times have given rise to numerous anti-EU political parties including xenophobic parties eager to blame immigrants and others for the problems. This is not dissimilar to what was seen in the 1930’s with the rise of the Nazi party in Germany.
Japan, who was the first to really use QE, has moved back and forth with its program but ultimately they are not capable of replacing the QE that was generated by the US. The Japanese economy has been sliding back into recession. The question now begs with both Japan and the EU sliding back into recession can the US stay out of recession even as they have ended the most unprecedented period of monetary stimulus ever known. The market seems oddly focused on when the US might hike interest rates. They are not focused at all it seems on the US sliding back into recession.
Something that should be focused on is that yield spreads are slowly widening. No they are not yet at levels seen during the 2008 financial crisis but they are rising. Whether it is 10 year Treasury notes and AAA Corporate bond yields, or BAA Corporate bond yields or junk bonds the spreads have been rising. The charts below show the slowly rising spreads.
Yield spreads on US Government Treasury notes and BAA corporates appear to have broken a downtrend. Downtrends appear to have been broken as well for an assortment of BBB corporate bonds and high yield bonds (aka junk bonds). This suggests that one should be cautious about corporate and high yield bonds going forward. Note that none of the spreads are anywhere near the levels seen during the 2008 financial crisis. To get there would take a heightening of problems and yield spreads would only explode to the upside during a crisis. It may be that this is just another temporary blip in the widening of yield spreads but given the end of QE, odds could favour growing liquidity problems in the global bond market.

Source: www.stlouisfed.org
Source: www.stlouisfed.org
Source: www.stlouisfed.org

Source: www.stlouisfed.org
The Fed has ended QE. The biggest casualty so far has been gold and silver. Bond prices have been relatively steady and the stock market has started to wobble. The focus appears to have shifted as to when the Fed might hike interest rates. Given the problems in the EU and Japan the focus appears to be ill thought out. Yield spreads are widening on lesser credits vs. US Treasuries. In the EU the “peripheral” nations of the PIGS are seeing their yield spreads widen. This is particularly the case with Greece where once again the thoughts of default are on the upswing once again. That the ECB and Germany can’t allow it is beside the point. What is the cost of another Greek bailout or worse and Italy or Spain bailout?
Liquidity problems are rising in a number of markets with countries having trouble-finding financing. The potential of defaults are not limited to just the Euro zone. In Latin America, both Venezuela and Argentina are prime candidates for default. There could be others. Sovereign defaults are nothing new. The world has been through numerous periods of sovereign defaults in the past most notably during the Great Depression. Sovereign defaults reverberate directly onto the banking system triggering a potential banking crisis and collapse.
Maybe the last words should be for former Fed Chairman Alan Greenspan who in speaking at the New Orleans Investment Conference said that the Fed’s balance sheet is a “pile of tinder” that gold is a “good place to put money these days” as it will rise “measurably” in the next five years. Greenspan noted that while QE helped lift asset prices and lower borrowing costs it did little for the broader real economy. “Effective demand is dead in the water,” he said. It has boosted asset prices benefitting the wealthy. As for the rest – well……
Greenspan also said rather bluntly “I never said the central bank was independent”. The statement begged the question of how much are central banks, in this case the Fed, being dictated to by politicians to increase their popularity or re-election or worse still by powerful banks and bankers. The Fed is not as many believe an agency of the government. It’s shareholders are some of the most powerful banks in the world.
Greenspan might well have added, “It’s the debt, stupid”. Instead, I’ll say it. All historical financial collapses and depressions are all about debt collapse. For years, the advanced economies have kept trying to push the debt problem into the future. The future may soon be upon us. Each successive banking crisis has been worse than the previous one. The last one required the efforts of the Fed, the US Treasury and the taxpayer to prevent a complete financial meltdown. The causes of the financial crisis were not changed. They were merely tinkered with. The result is that little has changed. The next financial crisis is most likely brewing today. What could it bring?
TECHNICAL SCOOP
CHART OF THE WEEK
Charts and commentary by David Chapman
26 Wellington Street East, Suite 900, Toronto, Ontario, M5E 1S2
Phone (416) 604-0533 or (toll free) 1-866-269-7773 , fax (416) 604-0557
Copyright 2014 All rights reserved David Chapman
General Disclosures
The information and opinions contained in this report were prepared by Industrial Alliance Securities Inc. (‘IA Securities’). IA Securities is subsidiary of Industrial Alliance Insurance and Financial Services Inc. (‘Industrial Alliance’). Industrial Alliance is a TSX Exchange listed company and as such, IA Securities is an affiliate of Industrial Alliance. The opinions, estimates and projections contained in this report are those of IA Securities as of the date of this report and are subject to change without notice. IA Securities endeavours to ensure that the contents have been compiled or derived from sources that we believe to be reliable and contain information and opinions that are accurate and complete. However, IA Securities makes no representations or warranty, express or implied, in respect thereof, takes no responsibility for any errors and omissions contained herein and accepts no liability whatsoever for any loss arising from any use of, or reliance on, this report or its contents. Information may be available to IA Securities that is not reflected in this report. This report is not to be construed as an offer or solicitation to buy or sell any security. The reader should not rely solely on this report in evaluating whether or not to buy or sell securities of the subject company.
Definitions
“Technical Strategist” means any partner, director, officer, employee or agent of IA Securities who is held out to the public as a strategist or whose responsibilities to IA Securities include the preparation of any written technical market report for distribution to clients or prospective clients of IA Securities which does not include a recommendation with respect to a security.
“Technical Market Report” means any written or electronic communication that IA Securities has distributed or will distribute to its clients or the general public, which contains an strategist’s comments concerning current market technical indicators.
Conflicts of Interest
The technical strategist and or associates who prepared this report are compensated based upon (among other factors) the overall profitability of IA Securities, which may include the profitability of investment banking and related services. In the normal course of its business, IA Securities may provide financial advisory services for issuers. IA Securities will include any further issuer related disclosures as needed.
Technical Strategists Certification
Each IA Securities technical strategist whose name appears on the front page of this technical market report hereby certifies that (i) the opinions expressed in the technical market report accurately reflect the technical strategist’s personal views about the marketplace and are the subject of this report and all strategies mentioned in this report that are covered by such technical strategist and (ii) no part of the technical strategist’s compensation was, is, or will be directly or indirectly, related to the specific views expressed by such technical strategies in this report.
Technical Strategists Trading
IA Securities permits technical strategists to own and trade in the securities and or the derivatives of the sectors discussed herein.
Dissemination of Reports
IA Securities uses its best efforts to disseminate its technical market reports to all clients who are entitled to receive the firm’s technical market reports, contemporaneously on a timely and effective basis in electronic form, via fax or mail. Selected technical market reports may also be posted on the IA Securities website and davidchapman.com.
For Canadian Residents: This report has been approved by IA Securities, which accepts responsibility for this report and its dissemination in Canada. Canadian clients wishing to effect transactions should do so through a qualified salesperson of IA Securities in their particular jurisdiction where their IA is licensed.
For US Residents: This report is not intended for distribution in the United States.
Intellectual Property Notice
The materials contained herein are protected by copyright, trademark and other forms of proprietary rights and are owned or controlled by IA Securities or the party credited as the provider of the information.
Regulatory
IA Securities is a member of the Canadian Investor Protection Fund (‘CIPF’) and the Investment Industry Regulatory Organization of Canada (‘IIROC’).
Copyright
All rights reserved. All material presented in this document may not be reproduced in whole or in part, or further published or distributed or referred to in any manner whatsoever, nor may the information, opinions or conclusions contained in it be referred to without in each case the prior express written consent of IA Securities Inc.


“Our main format is now video analysis…”
Gold Three Strikes Of Danger Charts Analysis
GDXJ Happy Halloween From The Banksters Charts Analysis
GDX Distribution Volume Attack Charts Analysis
Chinese Stock Market (FXI) Breakout Charts Analysis
Silver Wedge Of Pain Charts Analysis
Thanks,
Morris
Friday, Oct 31, 2014 Super Force Signals special offer for Money Talks Readers:
Send an email to trading@superforcesignals.com and I’ll send you 3 of my next Super Force Surge Signals free of charge, as I send them to paid subscribers. Thank you!
The SuperForce Proprietary SURGE index SIGNALS:
25 Surge Index Buy or 25 Surge Index Sell: Solid Power.
50 Surge Index Buy or 50 Surge Index Sell: Stronger Power.
75 Surge Index Buy or 75 Surge Index Sell: Maximum Power.
100 Surge Index Buy or 100 Surge Index Sell: “Over The Top” Power.
Stay alert for our surge signals, sent by email to subscribers, for both the daily charts on Super Force Signals at www.superforcesignals.com and for the 60 minute charts at www.superforce60.com
About Super Force Signals:
Our Surge Index Signals are created thru our proprietary blend of the highest quality technical analysis and many years of successful business building. We are two business owners with excellent synergy. We understand risk and reward. Our subscribers are generally successfully business owners, people like yourself with speculative funds, looking for serious management of your risk and reward in the market.
Frank Johnson: Executive Editor, Macro Risk Manager.
Morris Hubbartt: Chief Market Analyst, Trading Risk Specialist.
website: www.superforcesignals.com
email: trading@superforcesignals.com
email: trading@superforce60.com
SFS Web Services
1170 Bay Street, Suite #143
Toronto, Ontario, M5S 2B4
Canada
###
Oct 31, 2014
Morris Hubbartt

European stocks are all climbing Friday morning after a big boost in Asia following Japan’s unexpected decision to extend its quantitative easing stimulus program.
Here’s the scorecard:
France’s CAC 40 is up 2.02%
Spain’s IBEX is up 1.74%
Italy’s FTSE MIB is up 1.78%
Britain’s FTSE 100 is up 1.15%
Germany’s DAX is up 1.60%
Asian markets saw a massive rally. The Nikkei closed up 4.83%. The Hang Seng closed up 1.25%.
US futures are climbing, too: The S&P is up 16.75 points, and the Dow is up 149 points.
On Friday morning, we’ve already had some terrible retail sales figures for Germany: with a 3.2% drop in September, they are the worst since 2007.
European inflation data just released showed a small rise, up to 0.4% in October. That’s one month of room to breathe for the European Central Bank, a small step away from deflation.
At 8:30 a.m. ET from the US, personal spending data is out. Analysts are expecting a 0.3% boost to personal income and a 0.1% boost to spending for September.
This post was updated at 6:30 a.m. ET.
Read more: http://www.businessinsider.com/market-update-oct-31-2014-10#ixzz3Hj4B7eU4


-
I know Mike is a very solid investor and respect his opinions very much. So if he says pay attention to this or that - I will.
~ Dale G.
-
I've started managing my own investments so view Michael's site as a one-stop shop from which to get information and perspectives.
~ Dave E.
-
Michael offers easy reading, honest, common sense information that anyone can use in a practical manner.
~ der_al.
-
A sane voice in a scrambled investment world.
~ Ed R.
Inside Edge Pro Contributors

Greg Weldon

Josef Schachter

Tyler Bollhorn

Ryan Irvine

Paul Beattie

Martin Straith

Patrick Ceresna

Mark Leibovit

James Thorne

Victor Adair