
Gold & Precious Metals

 How to Manage Risk Easily and Effectively
An observational study of 12 million actual forex trades made in the course of one year showed that traders are right more frequently than they are wrong. They win 59 percent of the time and lose only 41 percent.
Yet most traders lose money overall.
How is that possible?
Because their losing trades are 80% larger than their winning trades.
Wow, do you realize what that means?
It means there is a simple tactic to help you and anyone else become a successful trader.
Unfortunately, there is also a desire to “outperform” this simple tactic, and it is the exact reason traders lose money.
This desire to outperform is grounded in human nature.
In other words: You are the reason you lose … I am the reason I lose … and that “day trading” neighbor down the street is the reason he loses.
We want control – it’s our nature. So we convince ourselves we can do the impossible and outmaneuver the market.
Guilty as charged.
I started winning consistently only after loosed my grip. I stepped back and accepted this core truth: You don’t need to know what is going to happen next in order to make money in the market.
Before that, I let myself get in the way of success more times than I care to remember. But I’ve been doing this for 25 years because I’ve learned valuable lessons.
The most valuable lesson you can learn is risk management.
Practice risk management on every trade. Admit you don’t know where the market is going and that your trade is merely a probability bet. Your risk tolerance is simply the amount you’re willing to pay to play.
So get yourself and your ego out of the way and implement an effective risk management strategy with this one basic rule:
Use a stop-loss with every trade. Period.
That rule is hugely effective. And I have proof. My year-to-date results are exactly opposite those from the study I mentioned at the outset.
I am wrong more frequently than I am right. But I still make money trading (about 85% ROI so far this year and 84% in 2013).
How?
Because my average winning trade is roughly 177 percent larger than my average losing trade.
Do you realize what that means?
Using a stop-loss is a simple and effective risk management tactic. Here’s a trade alert I issued on Monday that’ll show you how I implement this tactic …

Note: Adjusted EUR/USD stop-loss to break even entry this morning…per Issue #1451
We want control over our success.
We can have it, but only if we understand success isn’t determined by controlling how we win as much as it is by controlling how we lose.
Once you control how you lose, you will win.
My results this year speak volumes to that claim. And I hope they speak to you too.
As a reminder, today you’ll receive ALL of my Black Swan Forex (BSFX) trade alerts, updates and analysis.
Tomorrow, I’ll be explaining another important facet of BSFX that also contributes to the success I’ve had the last two years. It’s about making adjustments on the fly so you can maximize profits and minimize losses.
-Jack

I’ve been pounding the table on uranium for some time now.
Over history, investors who have made the biggest gains have shown time and again that you need to buy when everyone else is selling. You need to buy what everyone else hates. You need to buy what no one else will.
And ever since the earthquake-induced disaster at the Fukushima Daiichi nuclear plant, there have been few admirers of nuclear and uranium, and even fewer buyers.
Indeed, though they had already been sliding from their June 2007 cycle highs near $137 per pound — spurred by the flooding of the Cigar Lake Mine — after the tsunami and subsequent shuttering of all 48 reactors in Japan, the bid simply disappeared from under uranium spot prices.
Ultimately, uranium spot prices fell all the way to $28 per pound this past summer, a level not seen since May 2005.

Uranium prices at these levels are unsustainable. They must go higher.
When they do, uranium stocks will move much higher as well. And the companies with proven deposits boasting high grades and shallow depths will move higher by many multiples.
That’s the natural cycle of things. You just have to be aware of it and be willing to buy a hated sector in anticipation of the profit cycle changing direction.
History to Repeat
For example, when uranium prices spiked over 400% from 2005 through 2008, junior uranium miners and exploration companies added as many percentage points, or better.

Again, when uranium spot price rebounded by 47% in 2010 and 2011, uranium mining stocks soared even higher.

Now, we’re on the verge of the cycle turning over once more.
2015: Uranium Profit Cycle?
I honestly don’t know when the momentum will truly shift. I just know it has to, or utilities won’t be able to sustain 14% of global electricity production.
Chairman of Sprott U.S. Holdings and legendary resource investor Rick Rule put it bluntly in an interview with CEO.CA alongside Sprott’s Vancouver Natural Resources Symposium in July:
When I look at a theme now like uranium, I am perfectly comfortable with the fact that it might take 5 years to be right. I have come to learn that asking myself investment questions where the answer begins with when, not if, is a very good trade.
In the uranium business now, industry costs including cost of capital is about $70, so you produce for $70 and sell it for $30 and lose $40. You cannibalize existing capital in corporate vehicles and that goes on until they go broke, and then the price shoots just like it did last decade. That’s a question that begins with when. When does the dam break? It’s not if. Does the price of uranium go up or do the lights go out?
With no Japanese demand and high supply from decommissioned nuclear warheads, nobody wanted to be the first to buy.
That’s starting to change.
Exelon (NYSE: EXC) is the largest nuclear utility in the U.S., which is the largest nuclear power market in the world. It recently started buying large quantities of uranium at the bottom of the market.
That goaded buying interest in other utilities like Southern, Duke, and FPL.
As a result, uranium spot prices have now surged 40% off their summer lows of $28/lb to nearly $40/lb.
And can you guess what uranium stocks are doing?

Buy EUR/USD at market [last price 1.2423] (Ed Note: Current Price 1.2384)
Knowing When and How to Make a New Trade
There are two things that may cause you to fail as a trader.
Fear and greed.
They are two sides of the same coin — each cripples your ability to make good trading decisions.
Fear of loss can keep you out of a good trade … or cut it short. Greed can push you into bad trades … or hinder your ability to control your risk. You must find a middle ground between these emotional extremes.
How do you keep emotion from controlling your trades?
You can’t eliminate your emotions. But you can control them if you develop an objective framework to exploit the emotional biases of other traders.
And then trust it.
After 25 years trading in financial markets, I can say trusting an objective framework is the clearest path to success.
You want a system that identifies high probability trades. And you want to pair that with disciplined risk management (more on that tomorrow.)
I have such a system.
I’ve honed it over the last two years. Year-to-date, it’s returned 85.4% for subscribers who followed the trade alerts verbatim. That follows an impressive 84% ROI in 2013!
The system uses Elliott Wave Theory to pinpoint trends and turning points. Those key levels dictate my trade decisions. What I might personally think about the euro, Japanese yen or the US dollar doesn’t matter if Elliott Wave analysis says otherwise.
Result: Highly objective trade alerts that make money consistently.
And that’s why you’re reading – to learn about those alerts. Let me share one I issued to subscribers yesterday …
 THREE PARTS OF A NEW BSFX TRADE ALERT RECOMMENDATION
Part One: Entry
Tells you to buy or sell, the type of order (stop, limit, market) and suggested entry price
Part Two: Stop-Loss
Tells you suggested exit price if the trade moves against you
Part Three: Profit Target
Tells you suggested exit price if the trade moves in your favor
That’s all there is to it — just three parts in every new trade alert I issue.
Look it over. And be sure to tune in tomorrow when I’ll be sending you ALL Black Swan Forex (BSFX) alerts … LIVE and FREE. You’ll have the opportunity to see everything paying subscribers get to see.
I’ll also be covering another important facet of BSFX: Knowing When to Jump Ship.
A trade can be won or lost at entry, but that doesn’t discount the importance of proper risk management when trades are active. It could very well be the difference between a winning trader and a “treadmill” trader who goes nowhere.
Talk to you tomorrow.
-Jack
This is part of your “Insider’s Look” at Black Swan Forex (BSFX).
Remember:
On Wednesday, November 12th, I’ll be sending LIVE trading alerts and updates to all my readers.
Stay tuned.

Is this time different? I’ve often characterized our approach to the financial markets as a value-conscious, historically-informed, evidence-driven discipline. In recent years, we’ve often been asked whether the world has changed in a way that makes historical evidence an inadequate guide to investing.
Our own narrative in the half-cycle since 2009 certainly invites that question. While a good part of that was a self-inflicted outcome related to my fiduciary stress-testing inclinations in 2009, and we’ve adapted far more than is likely to be obvious until the present market cycle is complete (see Setting the Record Straight to understand those challenges and how we’ve addressed them), the broader question remains – do historical regularities no longer apply?
In Probably Approximately Correct, Leslie Valiant describes the conditions required by both living organisms and artificial intelligence “ecorithms” in order to learn and successfully use induction from observations drawn from the environment. In order to reliably learn from inference, two assumptions are required.
First, we can’t expect those lessons or generalizations to be useful in contexts that are fundamentally different from the environment that produced the observations used for learning. In other words, lessons learned in one world may be poor guides in a far different world. This, of course, has been the perennial argument of speculators during every bubble in history. But we should be careful about over-using that argument. The “invariance assumption” doesn’t require that the world cannot change – it only requires that there are some regularities that remain true. Second, some useful criterion or regularity must in fact be detectable. That is, there must be some “learnable regularity” that can actually be inferred from the evidence – a random world with no relationships between cause and effect is not an environment that will produce useful or predictive generalizations.
In some cases, those learnable regularities can be derived on the basis of clear theoretical relationships that describe how the world works with reasonable accuracy.
For example, every long-term security is fundamentally a claim on a very long-duration stream of cash flows that can be expected to be delivered into the hands of investors over time. For a given stream of expected cash flows and a given current price, we can quickly estimate the long-term rate of return that the security can be expected to achieve (assuming the cash flows are delivered as expected). Likewise, for a given stream of expected cash flows and a “required” long-term rate of return, we can calculate the current price that would be consistent with that long-term rate of return. The failure to understand the inverse relationship between current prices and future returns is why investors frequently argue that rich equity valuations are “justified” by low interest rates, without understanding that they are really saying that dismal future equity returns are perfectly acceptable.
We also observe the very regular tendency for profit margins to increase during economic expansions (presently corporate profits are close to 11% of GDP), and to contract during softer periods. Corporate profits as a share of GDP have always retreated to less than 5.5% in every economic cycle on record, even in recent decades. Since stocks are most reliably priced on the basis of long-term cash flows, and not simply Wall Street’s estimate of next year’s earnings, we find that valuation measures that are either relatively insensitive to profit margin swings, or that correct for their variation over the economic cycle, are much better correlated with actual subsequent market returns than measures such as price/forward operating earnings that don’t do so.
Our valuation concerns don’t rely on any requirement for earnings or profit margins to turn down in the near term. Valuation is a long-term proposition that links the price being paid today to a stream of cash flows that, for the S&P 500, have an effective duration of about 50 years. In evaluating whether “this time is different,” it should be understood that current valuations are “justified” only if 1) the wide historical cyclicality of profits over the economic cycle has been eliminated, 2) the average level of profit margins over the next five decadeswill be permanently elevated at nearly twice the historical norm, 3) the strong historical advantage of smoothed or margin-adjusted valuation measures over single-year price/earnings measures has vanished, and 4) zero interest rate policies will persist not just for 3 or 4 more years, but for decades while economic growth proceeds at historically normal rates nonetheless. Believe all of that if you wish. Without permanent changes in the way the world works, on valuation measures that are best correlated with actual subsequent market returns, stocks are wickedly overvalued here.
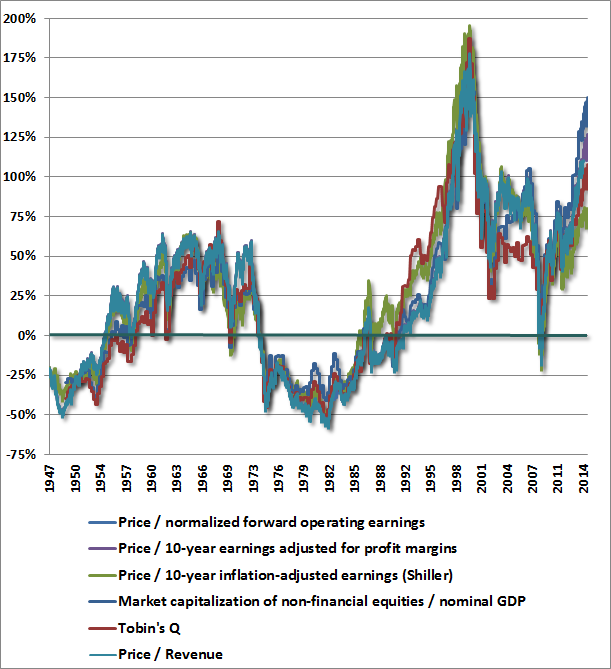
The charts below show several of the measures that have the strongest relationship (correlation near 90%) with actual subsequent 10-year S&P 500 total returns, reflecting data from the Federal Reserve, Standard & Poors, Robert Shiller, and valuation models that we have published over the years. The first chart shows these measures as the percentage deviation from their historical norms prior to the late-1990’s equity bubble. While it’s easy to lose sight of the extremity of the present situation, these measures are well over 100% above their respective norms, on average. On the most reliable measures, we estimate that S&P 500 valuations are now only about 15-20% short of the 2000 extreme, and are clearly above every other extreme in history including 1901, 1929, 1937, 1972, 1987, and 2007. Again, these measures are also better correlated with actual subsequent market returns than popular alternatives such as price/forward operating earnings and the Fed Model (which adjusts the S&P 500 forward operating earnings yield by the level of 10-year Treasury yields).
As of last week, based on a variety of methods, we estimate likely S&P 500 10-year nominal total returns averaging just 1.5% annually over the coming decade, with negative expected returns on every horizon shorter than about 8 years. The chart below shows the historical record of these estimates (in percent) versus actual subsequent 10-year S&P 500 total returns. What’s notable is not only the strong correlation between estimated returns and actual subsequent returns, but also that the errors are informative.
For example, notice that the actual 10-year S&P 500 total return in the decade following 1964 was significantly lower than one would have projected at the time. The reason is that the 1974 market plunge was so brutal, with the market losing half of its value, and bringing the new estimate of prospective returns to significantly above-average levels. Looking at this chart at the 1974 low, one might have been concerned that the methods were too optimistic since the prior 10-year return was so much worse than what one would have projected a decade earlier. Those concerns would have been unfounded, as the 1974 low represented one of the best secular buying opportunities in history, especially for the broad market.
Conversely, the actual 10-year S&P 500 total return in the decade following 1988-1990 was significantly higher than one would have projected at the time. The reason is that the 2000 market bubble was so extreme, bringing the new estimate of 10-year S&P 500 returns to negative levels. Looking at this chart at the 2000 peak, Wall Street would have undoubtedly argued that these measures of valuation had become unreliable or useless. That argument would have proved tragically wrong, as the S&P 500 promptly lost half of its value (three-quarters of its value for the Nasdaq), and posted negative total returns for well over a decade.
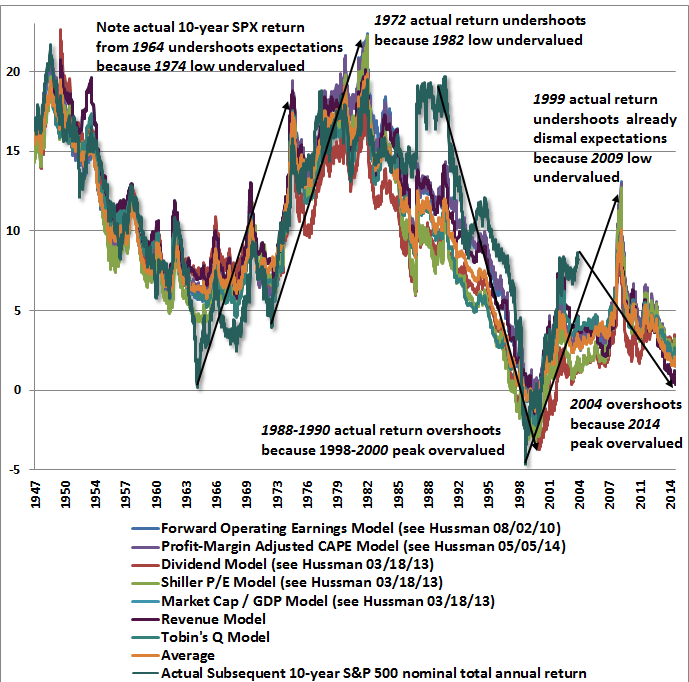
Given the full weight of the evidence, it should be clear that one can’t just say “well, look, the S&P 500 has done better than these models would have projected a decade ago,” and use that as a compelling argument that this time is different and historical regularities no longer hold. Quite the opposite – the overshoot in S&P 500 total returns since 2004 – relative to the prospective returns one would have estimated at the time – is highly informative that stocks are strenuously overvalued at present. That conclusion has strong statistical support. In fact, when we examine the historical evidence, we find that there’s a -68% correlation between the error in the projected return over the past decade and the actual subsequent total return of the S&P 500 in the following decade. That is, the more actual 10-year S&P 500 returns exceeded the return that was projected, the worse the S&P 500 generally did over the next10 years. Notably, the “Fed Model” has a correlation of less than 48% with actual subsequent 10-year returns. It’s sad when a valuation measure that is so popular is outperformed even by the errors of better measures.
Of course, there are also environments where either clear theoretical relationships don’t exist, or aren’t adequately recognized or understood, and people have to learn through a process of trial, error, and experience. That brings us to quantitative easing and zero-interest rate policy. Here, we have a mixture of clear relationships that aren’t adequately understood, as well as relationships that are largely psychological and can’t be derived mathematically.
On the subject of clear relationships, we know precisely how to quantify the impact that zero interest rate policy should have on valuations. Suppose, for example, that historically normal equity market valuations have generally been associated with Treasury bill yields averaging about 4%. Now suppose that Treasury bill yields are expected to be held at zero for the next 3-4 years. It follows (and this can be demonstrated with straightforward discounting arithmetic) that this expectation would “justify” stock valuations about 12-16% above their historical norms. That elevated valuation would adjust for the reduction in short-term interest rates by commensurately reducing the prospective future return on stocks by that same 4% increment for the next 3-4 years. The problem is that if this relationship isn’t recognized or understood, it becomes easy to casually argue “well, lower interest rates justify higher stock prices” without any concern that stocks are actually more than double reliable historical norms already.
Which leaves us with the effect of quantitative easing on the psychology of investors. It’s here where recent years have been particularly challenging for evidence-based, historically-informed analysis. Over the short run, market returns are driven by mindset, but ultimately, they are driven by valuation. As Benjamin Graham famously remarked, “in the short run, the market is a voting machine, but in the long run, it is a weighing machine.”
In the current cycle, central banks have stuffed the ballot box. That doesn’t make long-term prospects any better, but it has induced substantial yield-seeking speculation for several years running. In past market cycles across history, once the market established certain extreme conditions (which we’ve regularly described as “overvalued, overbought, and overbullish”), stocks typically retreated in relatively short order. In the half-cycle since 2009, that regularity appeared to largely vanish, and stocks have advanced even in the face of conditions that would normally have triggered a plunge. Again, this isn’t because higher valuations were justified by zero-interest rate policy, but rather because the policy has triggered persistent yield-seeking speculation despite valuations that offend empirically reasonable assumptions.
Fortunately, there’s a practical approach to adapt to situations when individuals behave in a way that ignores analytical relationships, and in situations where those relationships can’t be quantified directly. As Leslie Valiant correctly observes, for some classes of learning methods, “one can automatically translate a weak learning algorithm into a strong learning algorithm. The idea is to use the weak learning method several times to get a succession of hypotheses, each one refocused on the examples that the previous ones found difficult and misclassified.” In recent years, the difficult and misclassified conditions have primarily been those where overvalued, overbought, overbullish conditions were present, and yet the market was advancing in a way that was inconsistent with history. On that front, we’ve been faced with a good example of “this time” being “different.”
Notice that the strategy isn’t to abandon disciplined analysis or to discard every lesson of history. When one finds an aspect of the environment that legitimately appears “different,” the proper response is to embrace disciplined analysis even more strongly – focusing on misclassified instances and determining why they are misclassified. We know that the market often ignores monetary actions – the Fed was aggressively easing throughout the 2000-2002 and 2007-2009 plunges – so appeals to Fed easing aren’t enough. Since we’re analytically-driven investors and not data-miners, our efforts have been somewhat different than the “boosting” algorithm that Valiant describes, but the principle is much the same. In practice, we asked “historically, what has distinguished overvalued, overbought, overbullish conditions that were followed by air-pockets, free-falls, and crashes from similar conditions that had few negative consequences?” The answer? Generally speaking, the negative outcomes were coupled with either widening credit spreads or deteriorating market internals (what we’ve sometimes called “trend uniformity”). In the absence of such measures of increasing risk-aversion, those overextended syndromes have been much less hostile, on average. As it happens, implementing that “overlay” not only reduces the extent of misclassifications in the half-cycle since 2009, it also reduces misclassified defensiveness during other bubble periods such as the runup to the 2000 and 2007 market peaks.
What does all of this mean for the market at present? Since the initial “air-pocket” in stocks a few weeks ago, I’ve been careful to emphasize that I’ve had no opinion regarding near-term direction, and that we could observe either a corrective short-squeeze or a fresh market plunge. There was quite simply very little evidence that supported any directional view besides the expectation of continued volatility. Last week, however, the market re-established conditions extreme enough to place the present instance among what I’ve often called the “who’s who of awful times to invest.” Importantly, and in contrast to a few similarly extreme conditions we’ve seen in recent years, we presently observe both widening credit spreads and – at least for now – deteriorating internals and unfavorable trend uniformity on our measures of market action.
It’s certainly possible that credit spreads will narrow and market internals will improve. In that case, it won’t make the market any cheaper, but my impression is that it would mitigate the immediacy of our concerns. Longer-term, we would still anticipate dismal returns on a 7-10 year horizon, but an improvement in credit spreads and market internals would essentially be a signal that investors had shifted back to a more risk-seeking psychology at least for a bit.
In short, our views will shift as the evidence shifts, but here and now, the market has re-established overvalued, overbought, overbullish conditions that mirror some of the most precarious points in the historical record such as 1929, 1937, 1974, 1987, 2000 and 2007. That syndrome is now coupled with continued evidence of a subtle shift toward more risk-averse investor psychology, primarily reflected by internal dispersion and widening credit spreads. I’ve often emphasized that the worst market outcomes have historically been associated with compressed risk premiums coupled with a shift toward risk aversion among investors. In those environments, risk premiums typically don’t normalize gradually – they do so in abrupt spikes. We’ll continue to respond as the evidence changes, but under current conditions, we view the investment environment for stocks as being among a handful of the most hostile points in history.
The foregoing comments represent the general investment analysis and economic views of the Advisor, and are provided solely for the purpose of information, instruction and discourse. Please see periodic remarks on the Fund Notes and Commentary page for discussion relating specifically to the Hussman Funds and the investment positions of the Funds.
—
Prospectuses for the Hussman Strategic Growth Fund, the Hussman Strategic Total Return Fund, the Hussman Strategic International Fund, and the Hussman Strategic Dividend Value Fund, as well as Fund reports and other information, are available by clicking “The Funds” menu button from any page of this website.
Estimates of prospective return and risk for equities, bonds, and other financial markets are forward-looking statements based the analysis and reasonable beliefs of Hussman Strategic Advisors. They are not a guarantee of future performance, and are not indicative of the prospective returns of any of the Hussman Funds. Actual returns may differ substantially from the estimates provided. Estimates of prospective long-term returns for the S&P 500 reflect our standard valuation methodology, focusing on the relationship between current market prices and earnings, dividends and other fundamentals, adjusted for variability over the economic cycle (see for example Investment, Speculation, Valuation, and Tinker Bell, The Likely Range of Market Returns in the Coming Decade and Valuing the S&P 500 Using Forward Operating Earnings ).

-
I know Mike is a very solid investor and respect his opinions very much. So if he says pay attention to this or that - I will.
~ Dale G.
-
I've started managing my own investments so view Michael's site as a one-stop shop from which to get information and perspectives.
~ Dave E.
-
Michael offers easy reading, honest, common sense information that anyone can use in a practical manner.
~ der_al.
-
A sane voice in a scrambled investment world.
~ Ed R.
Inside Edge Pro Contributors

Greg Weldon

Josef Schachter

Tyler Bollhorn

Ryan Irvine

Paul Beattie

Martin Straith

Patrick Ceresna

Mark Leibovit

James Thorne

Victor Adair