
Energy & Commodities
West Texas Intermediate (WTI) oil for December delivery is currently priced at $75 per barrel, Brent for January delivery at $78 per barrel. Many investors, publications and news sources focus only on the drawbacks to falling oil and gas prices–don’t get me wrong, there are many–but today we’re going to give the spotlight to the biggest winners and beneficiaries.
Starting with your pocketbook.
Oil has slipped 30 percent since July, but the only place in the world where retail gas has fallen as much is Iran. In most countries, gas is down between 10 and 15 percent. Here in the U.S., ground zero of the recent energy boom, the national average has fallen close to 20 percent. As I said last week, American consumers have been treated to an unexpected tax break because of this slump, just in time for the holiday shopping season.

Three of the main contributors to oil’s decline are the strong U.S. dollar, which has put pressure not only on oil but other commodities as well; geopolitics, specifically tensions with Russia and the Saudis’ currency war; and the acceleration of American oil production. The hydraulic fracturing boom has flooded the market with shale oil, which in turn has driven prices down. As you can see below, there’s a wider spread between 2008 and 2014 oil production levels in the U.S. than in any other oil-producing country shown here.

Which Countries Benefit?
 Last month I briefly discussed how low crude prices benefit Asian markets the mostbecause they tend to be net importers of oil and petroleum. On top of that, a large portion of the population in these countries spends a significant amount of their weekly income on gas–in the case of India, as much as 30 percent. The biggest winners, then, are Asian countries such as India, Philippines, Thailand and Indonesia.
China, the world’s largest net importer of oil, second only to the entire continent of Europe, also benefits. For every dollar that the price of oil drops, its economy saves about $2 billion annually. Even though it just signed a multibillion-dollar, multiyear gas supply deal with Russia, China plans on tapping into its own shale gas resources, estimated to be the largest in the world.
One notable exception to the Asian market is Singapore. Although the city-state is a net importer of crude, bringing in around 1.3 million barrels a day, it depends heavily on oil exports to grow its economy. According to Bloomberg, in fact, Singapore ranks second in the world for a reliance on crude, based on a change in oil exports as a percentage of GDP from 1993 to 2018. Only Libya’s economy is more dependent.
Because the United States continues to be a net importer of crude and petroleum–it imports around 6.5 million barrels a day, according to CLSA–it has benefited as well, but its dependence on foreign oil is falling fast.
In the chart below you can see how breakeven prices increase as both global oil demand grows and the geological formation requires more sophisticated–and expensive–extraction methods.

Which Industries and Companies Have Benefited?
 To answer this question, Strategic International Securities Research (SISR) ran a correlation coefficient between the retail price of gas and 72 global industry classification standard (GICS) sectors, focusing on the years 2000 through 2014. Below are the top three sectors that ended up benefiting the most from falling gas prices. They all have a negative correlation coefficient, meaning that their performance has historically gone in the opposite direction as the price of gas, similar to a seesaw.
What this data shows is that the U.S. manufacturing industry has regained the cost benefit advantage to Chinese manufacturers. It’s becoming more and more attractive to build and create here in the U.S. because the cost of energy is relatively low.
Leading the list is automakers, suggesting that when gas prices have dropped, consumers have felt more confident purchasing new cars and trucks. Today consumers are even returning to vehicles that are known to guzzle rather than sip gas, such as SUVs, pickup trucks and crossovers. Ford’s F-Series continues to blow away its competition. Since mid-October, General Motors has delivered 7 percent, Ford 11 percent and Tesla, which we own in our All American Equity Fund (GBTFX) and Holmes Macro Trends Fund (MEGAX), 12 percent.
 It makes sense that airlines would perform better, since fuel is typically their largest single expenditure. In 2012, when the average price of a barrel of oil was $110, fuel accounted for 30 percent of airlines’ annual operating costs. Low fuel costs are cited as the main reason why Virgin America, which went public last week, reported third-quarter profits of $41.6 million, an increase of 24 percent year-over-year. The NYSE Arca Airline Index has flown up 110 percent since the beginning of 2013, hitting 13-year highs, and Morgan Stanley recently took a bullish position toward airline stocks, showing that company balance sheets are “structurally sound enough to make ‘events’ in the next five years unlikely” and that the industry as a whole is now growth-oriented.
It also makes sense that aluminum would benefit, given that the metal requires a notoriously large amount of energy to produce.
SISR highlights a few industries that surprisingly have had a positive correlation coefficient: department stores, apparel retail and luxury goods. You’d think it would be safe to assume that the retail sector benefits when consumers have been given relief from high gas prices. This is certainly the case now: Walmart, a bellwether for general market sentiment, is hitting new highs, and Tiffany & Co., which we own in our Gold and Precious Metals Fund (USERX), is also thriving. But in the past, low oil and gas prices have been reflections of a weak domestic economy. The average price per barrel of crude in 2009 was $62, a sharp decrease of nearly 40 percent from the average in 2008. Today, gas is inexpensive not because the economy is weak but because frackers are simply too good at what they do. They’re victims of their own success. What has hurt them has helped American consumers build more disposable cash flows, which can now be spent on fast food, retail, home improvement and other goods and services.
West Texas Intermediate (WTI) oil for December delivery is currently priced at $75 per barrel, Brent for January delivery at $78 per barrel. Many investors, publications and news sources focus only on the drawbacks to falling oil and gas prices–don’t get me wrong, there are many–but today we’re going to give the spotlight to the biggest winners and beneficiaries.
Starting with your pocketbook.
Oil has slipped 30 percent since July, but the only place in the world where retail gas has fallen as much is Iran. In most countries, gas is down between 10 and 15 percent. Here in the U.S., ground zero of the recent energy boom, the national average has fallen close to 20 percent. As I said last week, American consumers have been treated to an unexpected tax break because of this slump, just in time for the holiday shopping season.

Three of the main contributors to oil’s decline are the strong U.S. dollar, which has put pressure not only on oil but other commodities as well; geopolitics, specifically tensions with Russia and the Saudis’ currency war; and the acceleration of American oil production. The hydraulic fracturing boom has flooded the market with shale oil, which in turn has driven prices down. As you can see below, there’s a wider spread between 2008 and 2014 oil production levels in the U.S. than in any other oil-producing country shown here.

Which Countries Benefit?

Last month I briefly discussed how low crude prices benefit Asian markets the mostbecause they tend to be net importers of oil and petroleum. On top of that, a large portion of the population in these countries spends a significant amount of their weekly income on gas–in the case of India, as much as 30 percent. The biggest winners, then, are Asian countries such as India, Philippines, Thailand and Indonesia.
China, the world’s largest net importer of oil, second only to the entire continent of Europe, also benefits. For every dollar that the price of oil drops, its economy saves about $2 billion annually. Even though it just signed a multibillion-dollar, multiyear gas supply deal with Russia, China plans on tapping into its own shale gas resources, estimated to be the largest in the world.
One notable exception to the Asian market is Singapore. Although the city-state is a net importer of crude, bringing in around 1.3 million barrels a day, it depends heavily on oil exports to grow its economy. According to Bloomberg, in fact, Singapore ranks second in the world for a reliance on crude, based on a change in oil exports as a percentage of GDP from 1993 to 2018. Only Libya’s economy is more dependent.
Because the United States continues to be a net importer of crude and petroleum–it imports around 6.5 million barrels a day, according to CLSA–it has benefited as well, but its dependence on foreign oil is falling fast.
In the chart below you can see how breakeven prices increase as both global oil demand grows and the geological formation requires more sophisticated–and expensive–extraction methods.
Which Industries and Companies Have Benefited?
To answer this question, Strategic International Securities Research (SISR) ran a correlation coefficient between the retail price of gas and 72 global industry classification standard (GICS) sectors, focusing on the years 2000 through 2014. Below are the top three sectors that ended up benefiting the most from falling gas prices. They all have a negative correlation coefficient, meaning that their performance has historically gone in the opposite direction as the price of gas, similar to a seesaw.
What this data shows is that the U.S. manufacturing industry has regained the cost benefit advantage to Chinese manufacturers. It’s becoming more and more attractive to build and create here in the U.S. because the cost of energy is relatively low.
Leading the list is automakers, suggesting that when gas prices have dropped, consumers have felt more confident purchasing new cars and trucks. Today consumers are even returning to vehicles that are known to guzzle rather than sip gas, such as SUVs, pickup trucks and crossovers. Ford’s F-Series continues to blow away its competition. Since mid-October, General Motors has delivered 7 percent, Ford 11 percent and Tesla, which we own in our All American Equity Fund (GBTFX) and Holmes Macro Trends Fund (MEGAX), 12 percent.
It makes sense that airlines would perform better, since fuel is typically their largest single expenditure. In 2012, when the average price of a barrel of oil was $110, fuel accounted for 30 percent of airlines’ annual operating costs. Low fuel costs are cited as the main reason why Virgin America, which went public last week, reported third-quarter profits of $41.6 million, an increase of 24 percent year-over-year. The NYSE Arca Airline Index has flown up 110 percent since the beginning of 2013, hitting 13-year highs, and Morgan Stanley recently took a bullish position toward airline stocks, showing that company balance sheets are “structurally sound enough to make ‘events’ in the next five years unlikely” and that the industry as a whole is now growth-oriented.
It also makes sense that aluminum would benefit, given that the metal requires a notoriously large amount of energy to produce.
SISR highlights a few industries that surprisingly have had a positive correlation coefficient: department stores, apparel retail and luxury goods. You’d think it would be safe to assume that the retail sector benefits when consumers have been given relief from high gas prices. This is certainly the case now: Walmart, a bellwether for general market sentiment, is hitting new highs, and Tiffany & Co., which we own in our Gold and Precious Metals Fund (USERX), is also thriving. But in the past, low oil and gas prices have been reflections of a weak domestic economy. The average price per barrel of crude in 2009 was $62, a sharp decrease of nearly 40 percent from the average in 2008. Today, gas is inexpensive not because the economy is weak but because frackers are simply too good at what they do. They’re victims of their own success. What has hurt them has helped American consumers build more disposable cash flows, which can now be spent on fast food, retail, home improvement and other goods and services.
OPEC Unlikely to Make Production Cuts, Consensus Says
 Members of the Organization of the Petroleum Exporting Countries (OPEC) will be meeting on the 27th, and no doubt the discussion will center on whether to curb production to help oil prices recover. However, a new poll shows that commodity and energy investors do not believe such a cut will occur. According to BMO Capital Markets, 87 percent of those polled believed that no cut would be agreed on. Even those who said a cut would happen believed it would be no more than a million barrels a day, an insignificant amount.
Of course, this is merely a poll, but we might be looking at cheap oil and gas for an indefinite amount of time, with a bottom possibly reached sometime between now and February.
In the meantime, American producers will continue to pour out record levels of oil, and President Vladimir Putin’s antics in Ukraine will continue to stir up geopolitical tension. Saudi Arabia appears to be more aligned with Europe and the U.S. against Russia, Syria and Iran.
All of this short-term activity might be bad for the fracking industry, but the big winners are consumers and investors. We’re in a steady, modest expansion of our economy and this is good for investing in domestic stocks.
Members of the Organization of the Petroleum Exporting Countries (OPEC) will be meeting on the 27th, and no doubt the discussion will center on whether to curb production to help oil prices recover. However, a new poll shows that commodity and energy investors do not believe such a cut will occur. According to BMO Capital Markets, 87 percent of those polled believed that no cut would be agreed on. Even those who said a cut would happen believed it would be no more than a million barrels a day, an insignificant amount.
Of course, this is merely a poll, but we might be looking at cheap oil and gas for an indefinite amount of time, with a bottom possibly reached sometime between now and February.
In the meantime, American producers will continue to pour out record levels of oil, and President Vladimir Putin’s antics in Ukraine will continue to stir up geopolitical tension. Saudi Arabia appears to be more aligned with Europe and the U.S. against Russia, Syria and Iran.
All of this short-term activity might be bad for the fracking industry, but the big winners are consumers and investors. We’re in a steady, modest expansion of our economy and this is good for investing in domestic stocks.

This past week in the daily blog posts I did a good bit on macro analysis on the markets that I thought were worth repeating this weekend. I am only reprinting a portion of the work, but I have provided the links to the full pieces if you wish to read them in their entirety.
However, before I get into the macro analysis, let’s discuss the recently rebound surge in the markets over the last four weeks.
First, after breaking numerous technical supports the markets staged an immense short-covering rally that has taken markets back to new highs. While the move itself is not that abnormal, the extreme elevation of the move is. As you can see in the chart below, this is the sharpest move up in the markets since the turn of the century.
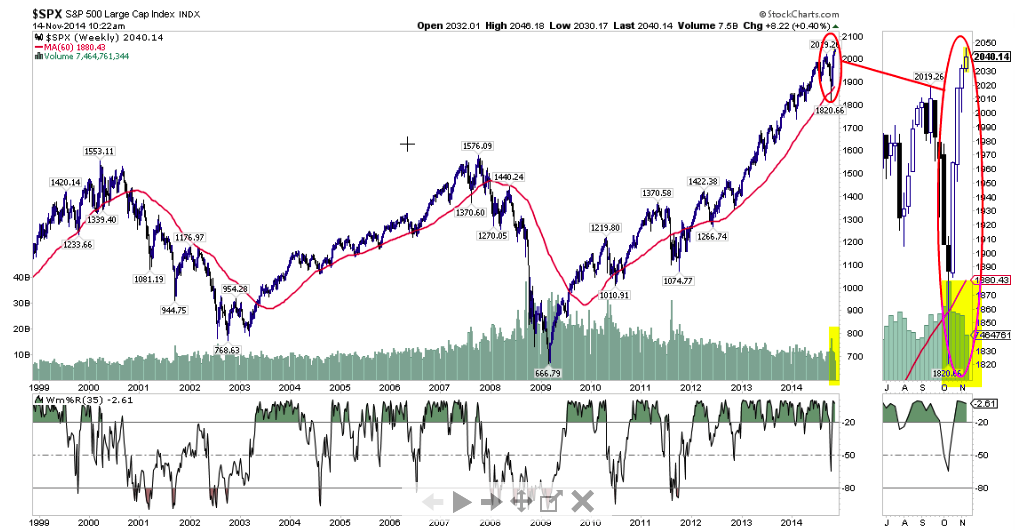
….for larger charts & more commentary go HERE

Briefly: In our opinion, speculative short positions are favored (with stop-loss at 2,085 and profit target at 1,950, S&P 500 index).
Our intraday outlook is bearish, and our short-term outlook is bearish:
Intraday (next 24 hours) outlook: bearish
Short-term (next 1-2 weeks) outlook: bearish
Medium-term (next 1-3 months) outlook: neutral
Long-term outlook (next year): bullish
The main U.S. stock market indexes were virtually flat on Friday, as investors continued to hesitate following October-November rally. The S&P 500 index remains close to its Thursday’s all-time high of 2,046.18. The nearest important level of resistance is at around 2,040-2,050, and the support level remains at 2,020-2,025, marked by previous local extreme levels. There have been no confirmed negative signals so far, however, we still can see some overbought conditions:

Expectations before the opening of today’s trading session are slightly negative, with index futures currently down 0.2-0.3%. The European stock market indexes have lost 0.2-0.4% so far. Investors will now wait for some economic data announcements: Empire Manufacturing at 8:30 a.m., Industrial Production, Capacity Utilization at 9:15 a.m. The S&P 500 futures contract (CFD) extends its short-term consolidation, as it moves along the level of 2,030. The resistance level remains at around 2,040, and the nearest important level of support is at 2,025, as we can see on the 15-minute chart:

The technology Nasdaq 100 futures contract (CFD) follows a similar path, as it fluctuates along the level of 4,200. The nearest important resistance level is at around 4,220-4,230, marked by recent highs. On the other hand, support level remains at around 4,190-4,200, as the 15-minute chart shows:

Concluding, the broad stock market remains close to all-time highs, as it extends recent fluctuations. We expect a downward correction or an uptrend reversal. Therefore, we continue to maintain our speculative short position. Stop-loss is at 2,085 and potential profit target is at 1,950 (S&P 500 index). It is always important to set some exit price level in case some events cause the price to move in the unlikely direction. Having safety measures in place helps limit potential losses while letting the gains grow.
Thank you.

 As the world continues to move into uncharted territory, today a 40-year market veteran sent King World News a powerful piece warning that one of the most spectacular turns in history is now upon us. He also discussed gold, silver, and what investors should be doing in this dangerous environment.
….read more HERE


-
I know Mike is a very solid investor and respect his opinions very much. So if he says pay attention to this or that - I will.
~ Dale G.
-
I've started managing my own investments so view Michael's site as a one-stop shop from which to get information and perspectives.
~ Dave E.
-
Michael offers easy reading, honest, common sense information that anyone can use in a practical manner.
~ der_al.
-
A sane voice in a scrambled investment world.
~ Ed R.
Inside Edge Pro Contributors

Greg Weldon

Josef Schachter

Tyler Bollhorn

Ryan Irvine

Paul Beattie

Martin Straith

Patrick Ceresna

Mark Leibovit

James Thorne

Victor Adair