
Timing & trends
Gold and silver prices have been trading in declining wedge patterns since 2011. Crude has traded in a flat to down wedge pattern for five years, and the S&P has been moving inexorably higher since early 2009 in a contracting wedge.
There are signs of a trend change. Examine the log scale weekly charts below.

….click HERE for larger Charts & more commentary

As surprising as it might sound today, we believe the secular trend for commodities has higher elevations to travel, before eventually running its course – possibly as far out as early into the next decade. While in 2011 we became adamant that the thesis trade in commodities – specifically in its leading sector of precious metals, had become crowded and overhyped, those excesses have been wrung out of the markets over the past three and a half years and offer what we perceive to be extremely compelling long-term valuations going forward.
This idea remains supported by our research that implies yields are not headed materially higher anytime soon – despite the anxieties surrounding the Fed raising interest rates over the next few years. Moreover, we expect that real yields (nominal – inflation) will remain suppressed and eventually retrace the rise that began in the back half of 2011. When the real yield cycle finds its zero bound and breaks below, commodities tend to outperform in the market over an extended period of time. All things considered, the death knell spike in real yields that has historically punctuated the end of major commodity booms in the past – has yet to appear for us on the horizon.

Over the years we have shown a long-term Hawking view of the nominal yield cosmos, which depicts an antithetic and gradual troughing, versus the violent and exhaustive secular peak in yields the markets experienced in the early 1980’s. While 10-year yields this year have retraced back to the mid point of our
expected range (1.5%-3.0%), taking into account the symmetrical structure and mirrored return of the long-term yield cycle, an estimated secular pivot higher would not take place until early in the next decade.

When it comes to a roadmap for short-term yields going forward, we looked back at the last time 3 month Treasury yields broke below 0.5% in 1934 and troughed over the next 13 years until 1947. Notwithstanding the failed rate hike regime by the Fed in 1937, the current market has closely followed the historic comparative performance trajectory of that time. Interestingly, by normalizing a duration study to that period (see below), the estimated run below 0.5% would also extend early into the next decade.
From our perspective, the broader cycle takeaways are:
- Although the Fed may tweak short-term yields gradually higher at some point in the future, the expectations by participants of a one – and certainly two or three handle, in front of the fed funds rate – appear wildly optimistic over the next few years.
- We believe the extended and gradual basing structure of the historic cycle reflects more realistic expectations for yields and the natural equilibrium that the Fed will ultimately be guided and constrained by – just as they were across the trough of the cycle last time around.

As shown in our first chart that depicts both the long-term nominal and real yield cycles, commodities have outperformed along runs leading up to the nominal peak in yields and through the nominal trough of the cycle. From a comparative perspective, the 1970’s commodity boom that ran commensurate with the yield peak was roughly half the duration of the commodity boom that ran through the trough in the 1930’s and into the early 1950’s. This makes logical sense to us, considering what we know of the nominal yield cycles structure – i.e. shorter exhaustive highs versus long drawn out troughs.
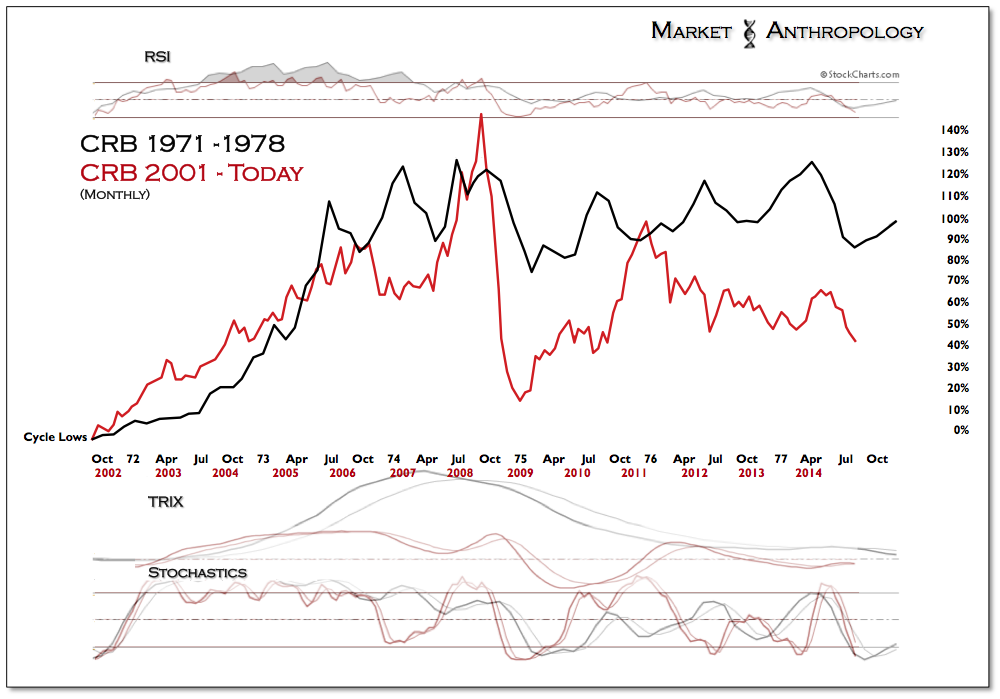
When comparing the performance of the CRB index between the 1970’s supercycle and today, you might come to the initial conclusion that the current cycle hasn’t been that super after all. In fact, the current cycle (as expressed by the CRB) would roughly fit within the performance envelope of the first leg of the 1970’s market (71′-78′) – despite being more than twice as long. Complicating the tea leaves of the current market was the major currency dislocations in the financial crisis, which caused an overshot on both the top and bottom sides of the performance ranges.
While the recent prognostications of $700/ounce gold and $50/barrel oil make for great hyperbole by the bears and in the punditsphere, we view them as the typical overshots that are thrown around during the final throes of capitulation. In as much as markets tend to overshoot significant moves, expectations soon follow – always in the same direction of where a market has been trending. With commodities remaining under pressure since Q2 2011, recency biases have entrenched towards further downside in the future. For gold to reach $700/ounce or oil $50/barrel, real yields would be pushed significantly higher – essentially repeating the performance declines for both assets that began in 2011. From what our anticipated range implies for nominal yields over the next few years and how eroded inflation expectations have become today, both targets appear grossly unrealistic. Contrary to conventional wisdom in the market today, we still believe hard commodities such as gold and oil will once again outperform – greatly supported by the tangential performance trends in catalysts such as China and emerging markets.
You’ll find that for many of the commodity cycle bears today, their theses hinge on a continued catalytic decline in China. This is predominantly because China had played such a pivotal role through the first boom of the commodity cycle in the massive demand created by significant investments in infrastructure and urban development. While the excesses in China have been well described and rigorously debated for the better part of this decade, the just how bad the crash will beexpectations by the policy bears have so far been largely unfounded.
 Quite the contrary, although these concerns remain at the forefront of debate as growth in China has slowed, the leading edge in their equity markets have surprised (finally) many this year – and broken out from a 5 year consolidating range.
As much as their arguments are well founded with cogent logic, the reality becomes that increased capital flows and resurrected confidence in Chinese markets will have a mitigating effect on the immanent credit conditions that academics and strategists such as Paul Krugman and Michael Pettis have been greatly concerned with over the past several years – and whom largely expected significant pressures to remain on the commodity markets as China would be forced into a long and painful economic rebalancing.
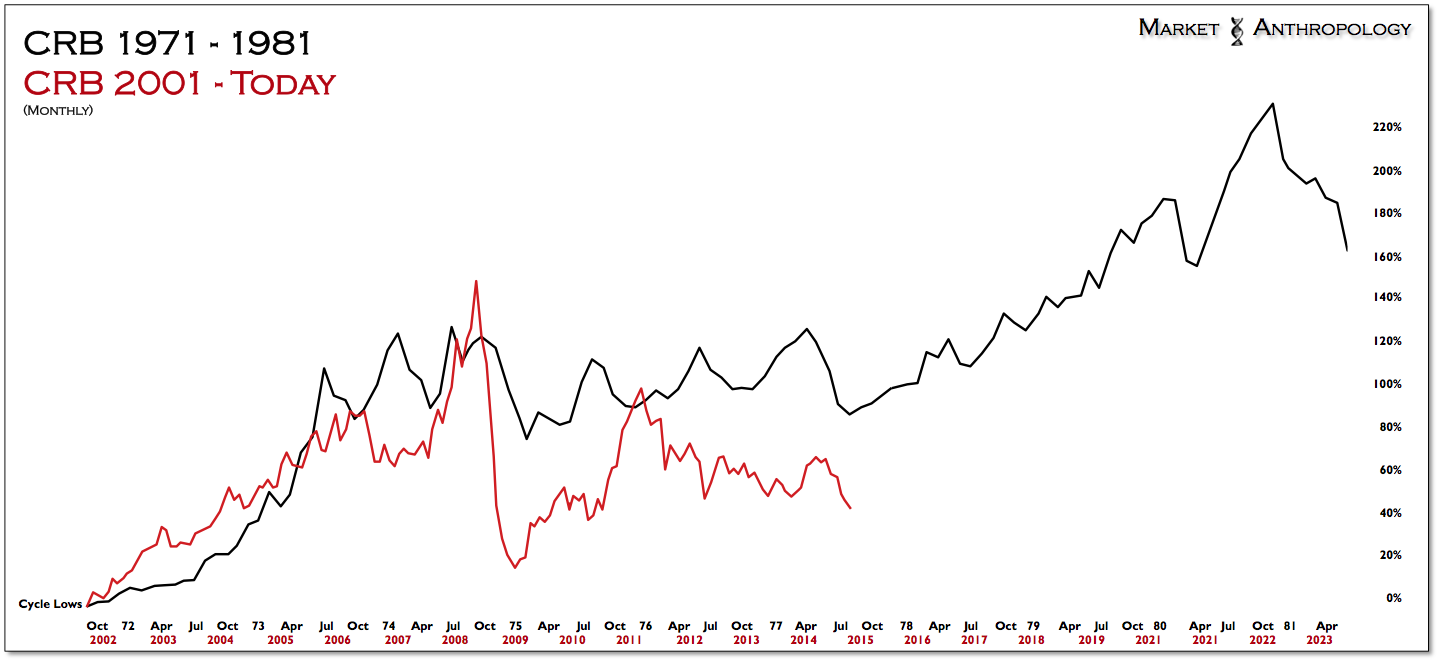
While it remains to be seen weather China has its comparative 82′ awakening (see above) or its much anticipated bust, we do believe the recent positive developments in their capital markets will provide a constructive rather than destructive environment for the commodity sector over the next year. All things considered, we’ll still take that bet and doubt we will ever see $700 gold or $50 oil again in our lifetime. From our perspective, $1400 and $100 appear more likely in 2015 – and by 2022… who knows – the super may have shown up again in this cycle.

Summary
- Net foreign purchases of US stocks turning up
- Corporate buybacks also acting as a support for the market
- Large potential short squeeze to serve as another bid
- Taken collectively, still too soon to turn bearish
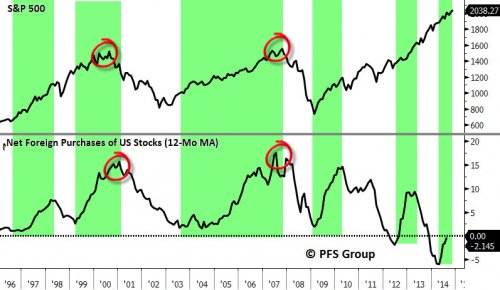
It’s always a good idea to periodically take a look at what the foreign community is doing in terms of net US equity purchases. The reason lies in the fact that they tend to buy at tops and sell at bottoms and can serve as a contrary indicator. We saw this not only in the 2000 and 2007 bull market peaks but also the 2003 and 2009 bear market bottoms.
So what do current levels of foreign purchases suggest for US stocks? They reflect more of a bottom than a top as net foreign purchases are coming off of multi-decade lows set earlier in the year and are close to moving into positive territory. Shown below is the S&P 500 on the top panel and the 1-year moving average of net foreign purchases on the bottom and you can clearly see that rising foreign purchases are associated with bullish moves in the stock market. Given the low level of current purchases we could continue to see an influx of foreign buying of US equities in the weeks and months ahead.
Source: Bloomberg
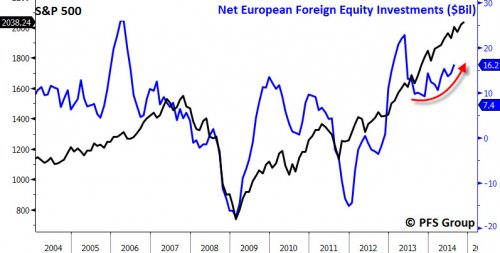
Part of the foreign inflows into US stocks is likely coming from Europe given the malaise of the region and the poor economic growth. Typically increases in net foreign stock purchases by the Eurozone translate into higher stock prices in the US with 2013 as a perfect example. Heading into 2013 net foreign equity purchases by the Eurozone were slowly declining but then surged strongly to nearly $25B a month by early summer before moderating back down to roughly $10B a month. Currently, European purchases of foreign stocks have picked and are likely serving a bid to our markets.
Source: Bloomberg
The market rally off the October bottoms has had a defensive feel to it as high quality stocks are outperforming low quality names. Foreigners typically buy large-cap strong balance sheet companies and so the outperformance of high quality stocks over low quality is likely an indicator of an increase of foreign inflows rather than a peak in the stock market often associated when lower quality names underperform.
Another widely known support for the markets currently as well is corporate buybacks, which, ironically, was also partially attributed for the October correction:
Is This the Beginning of a New Bear Market? Important Signs to Watch
Most corporations are precluded from buying back their shares during the five weeks before their earnings release and so the month before the onset of earnings releases typically show the lowest percentage of share buybacks seasonally. Peak earnings releases for the S&P 500 will be between October 13th and October 31st, which is significant as four to five weeks prior the S&P 500 peaked as a major buying source of the market dried up. Near the end of this month roughly 75% of the S&P 500 companies will have reported and will be able to restart their share buyback programs. According to Goldman Sachs data going back to 2007, roughly 25% of annual share repurchases occur in the last two months of the year with November being the largest month (14% of total annual share repurchases). This indicates corporations may be a significant marginal buyer of the stock market beginning in the next few weeks.
As mentioned in the excerpt above, according to Goldman Sachs roughly 25% of total annual share repurchases occur in the last two months of the year and suggests there is plenty of support for this market into year end. Tracking buybacks can be very helpful in identifying major market turning points since investors tend to sell stocks when the company is buying back their equities at rich valuations and then underperform the general stock market.
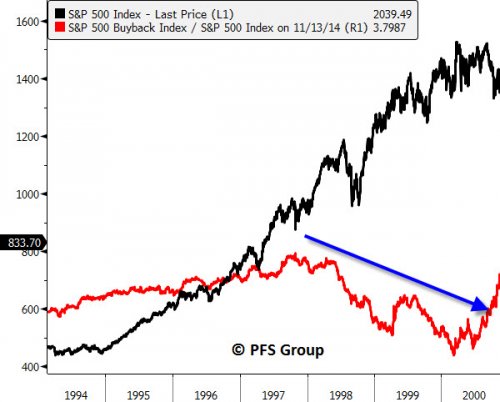
Because of this, tracking the relative performance of the S&P 500 Buyback Index to the S&P 500 can provide an early clue of an impending major market top. This was the case leading up to the 2000 bull market top in which companies with large buyback programs began to be penalized by investors beginning in 1997 as the S&P 500 Buyback Index underperformed the S&P 500 by a large degree in the last few years of the 1990s.
Source: Bloomberg
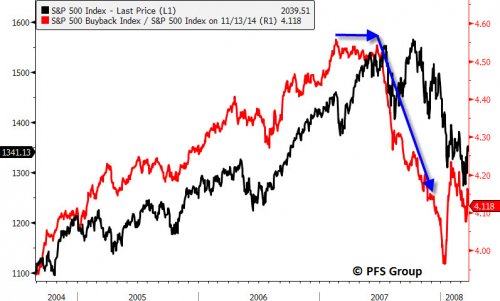
A similar situation was seen in 2007 when the market shot higher heading into the summer but the S&P 500 Buyback Index stopped outperforming the S&P 500 and then virtually collapsed in the last six months of the year as investors took companies to task for wasting shareholder money by buying back overly priced stocks.
Source: Bloomberg
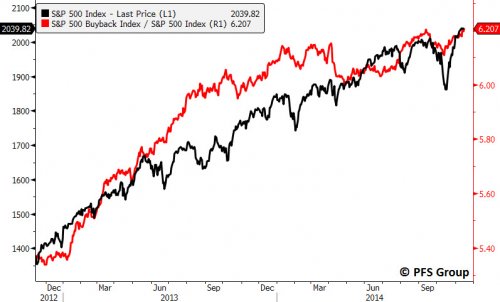
When you look at the market today you do not see any of the glaring divergences above that were associated with the 2000 or 2007 tops and suggests we haven’t reached the peak of this bull market.
Source: Bloomberg
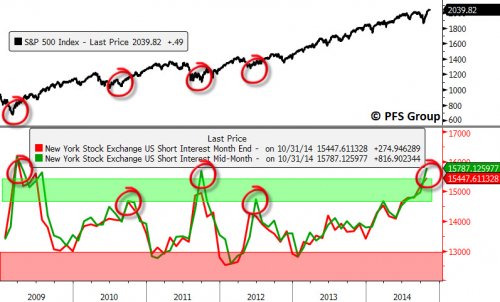
Another development to keep in mind is that short interest on the New York Stock Exchange is at levels that nearly match the March 2009 bottom and have eclipsed the levels that marked the 2010, 2011, and 2012 bottoms. As I’ve said before, the time to be bearish is when everyone is bullish – short interest levels do not convey this message at all.
Source: Bloomberg
There are some sentiment surveys that show elevated bullishness but I tend to put more value on data that follows what people are doing rather than what they are saying; actions speak louder than words and short interest levels are providing a bullish contrary signal.
Summary
The trends in net foreign purchases and the outperformance of the S&P 500 Buyback index suggests a major market top is not in the offing as neither are signaling a market peak as they did at the 2000 and 2007 tops. Additionally, the large net short interest levels on the New York Stock Exchange suggests a significant chance of a short covering rally that could lift the markets higher. Collectively, the data above cautions against turning overly bearish on the markets despite the strong run off the October lows. There still remains plenty of support underneath this market to carry it higher in the weeks and months ahead.

We’ve been here before. Prices hanging up near highs, approaching a key reversal date and expiration week is upon us. The barometer is reflecting the markets action:

As I like to say, the market makes about 7 mid term moves a year. So the barometer is simply a guide to what’s going on in the markets, regardless of the news (which creates a bias). So when the barometer turns lower, but prices remain high, that creates buy trend mode. The potential for the markets to trend is significant. That’s when stock trading becomes key, as index trading should produce minimal gains in this mode, stocks become the focus of traders and move more significantly.
That being said, one of our new traders has put together an educational email series on trading price gaps. You can click the following link to check it out. Note the emails are handled by Aweber, so you’ll have to find the confirmation email after you sign up to actually start getting the emails: http://forms.aweber.com/form/33/1216030333.htm
On the markets, one key indicator we’ve been watching:

The trending lower is bearish and note that the next bearish thing that we’ll watch for is a cross below the 34 day moving average. Sorry, I’m a Fibonacci guy…
Another basic indicator:

This is just a gage on the overall positioning of the market. It doesn’t mean the market will top, it just means that the potential exists.
Another basic indicator that gives a key measure on the market’s sell pressure:

If you remember that the market is traded mostly by computers and buying and selling is hard to hide, this indicator is key.

Trin is less significant as an indicator, because it’s based on 4 measures and their interpretation can be skewed by light volume. That being said, it’s important to know where this indicator sits as it’s the original Trading Index…
And finally, the VIX Put Call Ratio. I remember when this first came out. The volume was so light. In it’s first month, there was a day when there were only 3 vix put contracts traded! Now, when the market is getting real scary, you’ll see 1.3M CALL contracts traded (bets or hedges that the volatility will go up!)

My theory on the market is that what moves it is the underlying pressures created by the vehicles that are traded – not the news, though the news can be a catalyst for the timing of a position, it’s the sum total aggregated or cumulative measure of actions taken that really drive the markets. The accumulation of all buying and selling of stocks, options, futures, on everything. So for example, if you look at the above and the amount that trading has grown on it since the 2/24/06 it started trading in the markets to where it is now – instant portfolio hedging protection.
So as I always say, when the crowd leans to the left, we need to lean to the right and that’s where profitability exists… I feel like we’re getting close to a catalyst that will move the markets. And also note the Wednesday before expiration can be a little crazy as that’s when larger institutions will start rolling positions – so stay tuned…
Regards,


-
I know Mike is a very solid investor and respect his opinions very much. So if he says pay attention to this or that - I will.
~ Dale G.
-
I've started managing my own investments so view Michael's site as a one-stop shop from which to get information and perspectives.
~ Dave E.
-
Michael offers easy reading, honest, common sense information that anyone can use in a practical manner.
~ der_al.
-
A sane voice in a scrambled investment world.
~ Ed R.
Inside Edge Pro Contributors

Greg Weldon

Josef Schachter

Tyler Bollhorn

Ryan Irvine

Paul Beattie

Martin Straith

Patrick Ceresna

Mark Leibovit

James Thorne

Victor Adair