
Bonds & Interest Rates
 Words are important. This is not just a headline, it is a reality…
Draghi says ECB will ‘do what it must’ on asset buying to lift inflation
Not ‘do what it thinks would be the best course for the European economy’, not ‘choose the path of least resistance in guiding the financial system to recovery’… the ECB will DO WHAT IT MUST.
As I have written til I’m blue in the face for the last 10 years, we are in the age of ‘Inflation onDemand‘©, 24/7 and 365. “…do what it must”… let that sink in for a moment.
Japan is trying to kill the Yen, China is dropping interest rates and the world over we have a rolling inflationary operation that is little more than a game of Whack-a-Mole. BoJ popped up a couple weeks ago and now this one…
US Situation
Transitioning to the country and policy making establishment that has truly shown ‘em how it’s done over the last 6 years, we view the S&P 500 with its eternal attendant, ZIRP and add a view of the CPI as well. One message that can be interpreted from this chart is that stock markets have been used (controlled) as a mechanism for asset owners to keep up with the reported effects of inflation (CPI). Saving has been disallowed, legislated by policy right out of the equation. Everybody into the pool, if you’ve got the bankroll to play.

We have maintained since the post 2012 lift off of the most intense phase of the inflated stock bull market that there is and has been no bubble in stocks (though they have become over valued* even by traditional metrics) but rather, a massive and ongoing bubble in global policy making.
First Alan Greenspan laid the groundwork and the initial blueprint (asset inflation), then his inflation operation was liquidated with extreme decisiveness and now, from the ashes we have a new global asset inflationary operation born not of good intention or rationally sound strategy. It is pure and simple desperation. The ECB will “do what it must”. The US Federal Reserve has done “what it must” since instituting ZIRP nearly 6 full years ago and through QE’s 1-3.
Straw Man
 It sure looks like the whole debate about 2015’s coming interest rate hikes are another Straw Man stood up to manage market expectations (see Deflationary Straw Man), to give the impression that Policy Central is still in control and that they have decisions to make. There is no decision folks. The inflationary operation, now gone global, is an all-in, all-or-nothing’ proposition.
Greenspan’s inflation ended up being less than nothing. It was resolved in a sea of debits that assigned negative value to the system. The ongoing effects of inflation feel good to some people now (especially those who get to lap up the silver spoon’s gifts that keep on giving first and foremost as opposed to those savers and paycheck-to-paycheckers who just get to suck on ZIRP-eternity) but inflation is never a lasting benefactor. It is a subtractor over the years and decades as savings and productivity are replaced by money printing.
We will clip this post here and go on managing the market as always, taking what it gives, managing against what it is one day going to take and keep the big picture view in place at all times. That view very simply is that 6 years on from the US financial crisis (ongoing, though that is an unpopular notion at this time) a global  cadre of policy makers are playing a transparent game of Whack-a-Mole trying to one-up each other until the whole thing flushes once again.
* Although it is worth asking the question ‘what is value today, anyway?’ when considering the constant inputs and distortions inflicted by policy makers. Anyone care to take a guess on that one?

There is a sense of déjà vu in the current stock market. Parabolic moves such as the current one are not that common. Yet over the past twenty years, the market is working on its third parabolic move. The refrain no doubt will be that “this time is different”. That refrain has been used repeatedly in the past to justify parabolic moves. But in the end it is the same. The market rises sharply then crashes.
The current parabolic up move has been steeper and longer than the previous two moves. The current up move got
underway from the depths of the 2008 financial crash following the bailout of some of the biggest banks in the world, slashing interest rates effectively to zero and instituting QE. While the pundits praise the recovery the reality is that growth has been narrowly based benefitting primarily the well-off (the 1%) and the professional classes while the rest of the economy has languished in unemployment, and low paying Wal-Mart type jobs or as one pundit pointed out the country has become a nation of waiters and bartenders. Growth in employment has been primarily part-time jobs with few if any benefits.
But the stock market has benefited as it did from 1995-2000 and 2002-2007 earlier periods of low interest rates and rapidly growing money supply as was the case 1995-2000 and a sea of liquidity plus low interest rates as was seen from 2002-2007. While the current run has gone on longer – 68 months to date vs. 63 months 1995-2000 and 60 months 2002-2007, the gain has thus far fallen short of 1995-2000. To date the market as represented by the S&P 500 is up 208% vs. 251% from 1995-2000 and only 105% from 2002-2007. Once again, a period of ultra-low interest rates has characterized the period along with QE 1, 2 and 3.
More important is what happened once the market stopped going up. The 2000-2002 high tech/internet bear saw the S&P 500 fall 50%. The financial crash of 2007-2009 was worse as the S&P 500 fell 58%. The 2000-2002 collapse was drawn out taking 31 months to complete. The 2007-2009 crash was all over in 17 months.
Market crashes of 50% or more don’t happen very often. Yet in the space of roughly eight years, there were two of them. In looking back over the history of the Dow Jones Industrials (DJI) there were only three others that I could find and they all happened in the early part of the previous century. From November 1903 to January 1906, a period of 44 months the DJI rose 144%. What followed was the panic of 1907 when the stock market fell 49% over a period of 22 months from January 1906 to November 1907. The granddaddy of them all was the “Roaring Twenties” bull market that got underway in October 1923 and topped out in August 1929 (actual date was September 3, 1929) a period of 70 months. The gain was 349%. What followed was the “Great Depression” crash and the DJI collapsed 89% over the next 35 months bottoming in July 1932.
The market did recover from the great crash of 1929-1932 and from July 1932 to the top in March 1937 the market was up 382% a run that actually surpassed the “Roaring Twenties”. Nonetheless it remained well off the highs of 1929. The highs of 1929 were not taken out until 1954. What followed was another devastating crash. First, there was the panic of 1937 that bottomed in March 1938 as the DJI fell 50%. The recovery over the next year was feeble and as war broke out in 1939/1940, the market started a secondary decline. The bottom didn’t come until April 1942 and by that time, the market had lost 53% from the highs of March 1937.
There have been other sharp up moves in the stock markets but few as impressive as the 1923-1929 run and the 1932-1937 run. Then again, they weren’t followed by a devastating 50% market collapse either. The 1982-1987 bull market did see the DJI gain 256% and it lasted 60 months. But the subsequent crash was merely a flash as it lasted only about two months and lost 36%.
Argumentively one could say that the up move from March 2009 has not just been straight up with few interruptions. A parabolic move never is just straight up. The correction that occurred April 2011 to October 2011 did see the DJI fall about 17%. To date that has been the only serious correction since the bull got underway in March 2009. But generally this could be considered a parabolic move or as some would call a bubble market. In a bubble market greed and euphoria is high and complacency is low. In other words “this time it’s different”.
The market pundits call it “climbing a wall of worry”. That may be right but then they don’t normally last this long. At 68 months, this bull has run almost as long as the 1923-1929 market. And everyone knows how that one ended. The current rise has also been the steepest. By comparison, the 2002-2007 bull appears as almost a gentle rise. Still the RSI indicator has not been in overbought territory as long as it was from 1995-2000. That period saw the RSI remain almost exclusively above 70 the entire time. Today’s market has seen the RSI remain above 70 longer than it did during any of the 1903-1907, 1923-1929 and 1932-1937 rises.
An overbought RSI is not the only negative sign. Currently the S&P 500 is 13.7% above the 23 month exponential MA. That is not as bad as it was in 2000 when the S&P 500 was more than 18% over the 23 month MA. But it is higher than the 10% over at the 2007 peak. Those overages are actually “pikers”. At the heights in 1906, the DJI was 41.6% over the 23 EMA. In 1929, the peak was 37.7% over and in 1937 the top was 20.6% over the 23 month EMA. By comparison, today’s market is a gentle rise.
While the US stock markets have been making new highs for the most part no one else is. European stock markets remain below their highs as does most Asian markets. The small cap Russell 2000 remains below its all-time high. Markets should be making highs together or at least confirming each other. Only the large cap US markets appear to be making weekly and daily new highs. This is a divergence that needs to be resolved.
There should also be concern about the growing spread between high yield bonds (junk) and US Treasuries. This spread has been widening of late although it is still nowhere near where it was during the 2008 financial crash nor is it at levels that should raise alarms. Nonetheless, the widening spread is to be at least noted. As the stock markets were making their highs in 2007, the yield spread between high yield and US Treasuries had already begun to widen. Once again, the stock markets are making new highs as the yield spread widens. During the 2011 correction, the yield spread widened as the market fell so the two were in tandem.
Could the stock market really take off in a blow off? The simple answer is yes it could. But it may not do that until at least a correction of some magnitude completes. It may only be a 10% pullback but as long as 1,800 holds for the S&P 500 then the market can remain in a bull mode. Even a break under 1,800 would have to be confirmed. But given the length of time that this market has been moving higher in a parabolic mode and warning signs flashing of impending danger this may not be the time to be re-loading looking for another big upside move.
It has been unusual that there has been three parabolic moves to the upside over the past twenty years. Two of them ended badly. Odds are that this one may not end so well either. The bottom of that channel is currently down around 600. That is a long way from today’s level.

Gold’s reversal from $1130 to $1200 combined with sharp rebounds in the gold miners has given precious metals bulls some hope that the bottom may be in. A few weeks ago we noted that the sector was extremely oversold and a snapback rally could begin. Gold has been the tell for the bear market and a real bull market throughout the precious metals complex may not begin until Gold’s bear has ended. In this editorial we dig deeper into some things to watch as they pertain to Gold.
First we will focus on Gold’s volatility. The chart below shows Gold and two volatility indicators: the CBOE volatility index and average true range. Peaks in daily volatility have coincided with important peaks and troughs in the Gold price. Volatility declined from summer 2013 through summer 2014 before perking up as Gold declined from $1255 to $1130. Yet both volatility indicators are not close to extremes. Volatility does not necessarily need to reach an extreme to signal a bottom. However, the two biggest volatility spikes were at the 2008 bottom and 2011 peak. A sharp decline in Gold below $1100 towards major support combined with a spike in volatility could signal a major turning point.

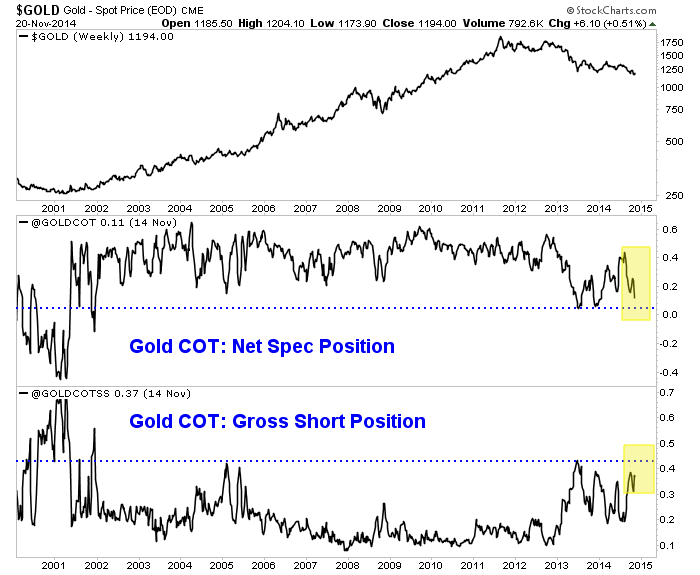
I’m also focusing on the COT as its an excellent sentiment indicator. By some metrics (objective and anecdotal) Gold’s bear market has reached extreme territory. However, the COT is presently not at an extreme. We plot (as a percentage of open interest) the net speculative position and the gross short position. If these readings can exceed the 2013 extremes then they would be at 13-year extremes. A spike in the gross short position, while negative in the short-term provides future fuel (short covering) for a very strong rebound off the bottom.
Meanwhile, let’s not forget Gold’s relative strength. We shared the importance in a recent missive. We noted Gold’s relative strength tends to perk up before Gold itself bottoms. The chart below plots Gold against a foreign currency basket (the inverse of the US$ index) and Gold against the S&P 500. Gold is holding up well against foreign currencies but is coming to an inflection point. I don’t think its going to breakout yet but I could be wrong. Meanwhile, Gold continues to be very weak against the stock market.

Gold has been the tell for the bear market and my work leads me to believe the bottom is ahead and not behind us. Last week we noted the likelihood of a test of major support near $1000/oz rather than a bottom at an arbitrary level. In addition, Gold has yet to have a volatility spike on par with the spikes at the 2008 bottom and 2011 top. Moreover, current positioning in the futures market remains below the extremes seen in 2013. Finally, Gold has more work to do on the relative strength front before it can sustain a recovery.
All this being said, it is important to keep an open mind to various possibilities. Silver and the mining stocks are totally bombed out and we should pay close attention if they retest their lows. The weeks and months ahead figure to be enticing and exciting for precious metals traders and investors. Expect quite a bit of day to day volatility as we see forced liquidation and occasional short covering. Be patient but be disciplined. As winter beckons we could be looking at a lifetime buying opportunity. I am working hard to prepare subscribers. Consider learning more about our premium service including a report on our top 5 junior mining stocks to buy at the coming bottom.
Good Luck!
Jordan Roy-Byrne, CMT

“Things are almost never clear on Wall Street, or when they
are, then it’s too late to profit from them.” – Peter Lynch
CWS Market Review: Consider this fact: In the last four weeks, the value of the global stock market has increased by a staggering $3.4 trillion. For some reason, we were terrible investors in September and early-October, but we’ve been brilliant investors ever since.
Or…perhaps, the mood of investors turned on a dime. It’s hard to believe that only a few days ago, investors were scared out of their wits about impeding elections, a deteriorating economy in Europe and truly scary news about the Ebola virus. How times have changed!

Investors shook these fears off and the stock market rallied to new highs again this week. Through Tuesday, the S&P 500 hit record closing highs for five straight days. The index has now made 40 record highs this year. That compares with 45 record highs last year. The S&P 500 has closed higher 16 times in the last 21 trading days, and three of those five declines were pretty measly (less than 0.2%). In the last month, we’ve experienced only one meaningful daily decline. This has been a golden time for investors, although trading volume has been very low (some chart watchers say that’s a bad sign).
In this week’s CWS Market Review, we’ll take a closer look at what’s driving this market. The simple explanation is that
what’s been happening is still happening, only more so. Don’t worry; I’ll explain what it all means in a bit. I’ll also review this past earnings season. Except for a few duds, this was a solid earnings season for our Buy List. I’ll also preview two Buy List reports coming our way next week. Yes, the October reporting cycle is already upon us. We also had another good jobs report last week. But first, let’s look at what’s driving this market.
What’s Driving this Market
This has been a fascinating rally of late because we can see several factors at work. The most important factor continues to be the strength of the U.S. dollar. I’m afraid I might sound like I’m discussing the same phenomenon each week, but the dollar’s impact is crucial to what’s impacting our portfolios.
Since the economy in Europe and Japan are still quite weak, the governments there are purposely trying to weaken their currencies. It’s not so much that the dollar is truly strong; it’s that the greenback is the tallest Munchkin in Munchkin Land. Of course with forex, that’s all that matters. The yen just dropped to a seven-year low against the dollar. It looks like the government is about to call snap elections there. The British pound recently fell to a 14-month low against the dollar.
One impact of the rising dollar is that it puts the squeeze on commodity prices. The price of gold recently fell to a four-year low. Gold has been in a near non-stop plunge over the last three years. Since its 2011 peak, gold has lost close to $800 per ounce. That’s not all. Crude oil has been falling as well. On Thursday, oil fell below $75 per barrel. For the first time since 2010, prices at the pump are below $3 per gallon.
One of the reasons for the drop in oil is that Saudi Arabia has stepped up production. Normally, the Saudis would try to curtail their output in an attempt to prop up prices. This is probably evidence of OPEC’s declining influence. We can also see that Energy stocks have been quite weak (see the chart below). Many of the large oil stocks have mostly sat out this rally. The Energy Sector ETF (XLE) is down slightly for the year, while most other sectors have done quite well. We currently don’t have any Energy stocks on the Buy List so that’s been a big help. I don’t see a broad rally for the Energy sector starting anytime soon.

Lower gas prices have been a welcome relief for many consumers. Despite the growth in payrolls, workers haven’t seen any real improvement in their wages. Since 2007, median income is down by 5%. About 10% of retail sales goes towards gasoline so lower prices at the pump frees up more money for other items. On Thursday, Walmart (WMT) impressed Wall Street by reporting earnings that topped the consensus figure by three cents per share. The stock jumped 4.7% on the day. Business has been going well for WMT lately. Next year, Walmart has a good chance of clearing $500 billion in annual revenue.
Walmart’s strength has been good news for our favorite retailers. Shares of Bed Bath & Beyond (BBBY) breached $71 this week. The stock hasn’t been that high since January. Our other big retailer, Ross Stores (ROST), is due to report its fiscal Q3 earnings on Thursday, November 20. This is for the quarter that ended in October. Like BBBY, Ross has been rallying strongly lately. The shares topped $83 on Thursday for a fresh 52-week high. It was only four months ago that Ross was languishing at $62 per share.
For ROST’s last earnings report in August, the deep discounter beat estimates by six cents per share. The stock jumped more than 7% the next day, and it has continued to rally. For Q3, Ross said it expects earnings to range between 83 and 87 cents per share. Oh, please. That’s almost certainly too low. (Ross tends to be conservative with its estimates.)
For Q4 (November, December and January), Ross expects to see earnings between $1.05 and $1.09 per share. Naturally, the holiday season is very important for any retailer. For this year, Ross sees earnings coming in between $4.18 and $4.26 per share. Ross is getting pricier but it’s far from outrageous. For now, I’m keeping our Buy Below tight, at $83 per share. If the results are good, I’ll raise the Buy Below. Ross Stores continues to be a solid stock. Our patience has paid off.
Finance and Healthcare Have Been the Leaders
The two sectors of the market that have taken the lead for the Strong Dollar Trade are Healthcare and Finance, although Healthcare’s big run has preceded the emergence of the Strong Dollar Trade. The Healthcare Sector ETF (XLV) has been a steady winner since February 2011. The recent election results also gave a boost to many Healthcare names.
The Healthcare stocks on our Buy List have also been doing quite well. Stryker (SYK),Medtronic (MDT) and CR Bard (BCR) all hit new 52-week highs on Thursday. All three stocks are also handily beating the market this year. The Buy List is overweighted with Healthcare and that’s been good for us this year.
Medtronic is due to report earnings on Tuesday, November 18. This will be for their fiscal second quarter. Three months ago, the medical device stock topped earnings by a penny per share. For Q1, revenue rose 4.7% to $4.27 billion, which was $20 million better than expectations. Medtronic had its strongest growth for U.S. medical devices in five years.
The best news for Medtronic recently was the result of last week’s election. While I caution investors not to let their politics interfere with their investments, it appears that Congress will try to repeal the medical devices tax. I can’t say if this will happen, but it’s interesting to note that shares of MDT bounced nicely the day after the election.
Medtronic has stood by its intended acquisition of Covidien (COV). The company plans to rework the specifics so it can clear any new regulations concerning tax inversions. This week, the company also offered concessions to please EU regulators. Medtronic will restructure the financing for the $43 billion deal which will allow the American company to reincorporate in Ireland and thereby lower its tax bill.
Medtronic has said they see full-year earnings (ending in April) ranging between $4.00 and $4.15 per share. Wall Street currently expects Q2 earnings of 96 cents per share. I don’t expect a big earnings beat from Medtronic. Rather, I expect to see more steady growth. This is an ideal stock for conservative investors. Medtronic is a buy up to $70 per share. Again, I’ll raise the Buy Below if earnings are strong, but I caution you not to chase it. Disciplined investors wait for good stocks to come to them.
Financial stocks have been more of a direct beneficiary of the Strong Dollar Trade. The Financial sector has led the market since August 20, although many financials got dinged hard in early October.
Our big banking stock is Wells Fargo (WFC), and that’s ridden the recent wave quite nicely. Shares of WFC touched a new high a few days ago. The bank’s earnings have been very good lately, and they’ve navigated a difficult time for the industry. Wells is by far the best-run big bank in the country. (By the way, I’m so happy we got rid of JPMorgan this year.) Wells Fargo is a buy up to $54 per share.
Survey of Q3 Earnings Season
Earnings season is just about done, so let’s look at where we stand. Of the 445 companies in the S&P 500 that have reported so far, 332 beat expectations, 73 missed and 40 met.
For Q3, the S&P 500 is on track to report operating earnings of $29.83 per share. That’s an index-adjusted number, and it represents an increase of 10.8% over last year’s Q3. (These numbers are from S&P and they sometimes differ from other news sources.) At the start of the year, Wall Street had been expecting $30.89 for Q3. The estimates gradually fell as the year wore on. I should add that estimates generally start out too high, and it’s common to see them fall as earnings day approaches.
Over the last four quarters, the S&P 500 has earned $114.74 per share, so the index is going for 17.8 times that. Wall Street currently expects Q4 earnings to come in at $31.13 per share. That would be an increase of 10.2% over last year’s Q4. I like to see these steady 10% to 12% increases.
Interestingly, the estimates for Q4 had been fairly stable for much of the year. At the beginning of 2014, Wall Street was expecting $32.17 for Q4. On September 30, the estimate had increased by a tiny bit to $32.24. Only recently have the numbers come down.
If the current Q4 estimate is accurate, it would bring full-year earnings to $117.62. That would be an increase of 9.6% over last year. I’m fine with that. Going by Thursday’s close, the S&P 500 is now up 10.33% this year. In other words, the S&P 500 has largely kept pace with earnings this year. Despite some careless talk of bubbles, valuations haven’t changed. I should add that dividend growth has mostly tracked share prices as well.
In other words, there’s no bubble. The threat to the market isn’t excess valuations. Rather, it’s the potential for lack of growth. I don’t see difficulties in the immediate horizon, but that could change. As long as rates stay low, and the economy expands, stocks are the place to be.
Buy List Updates
This week, for the first time since September, shares of Ford (F) topped $15 per share. The company finally started production on its aluminum-based F-150 trucks. This could be a game changer for the industry. (I hate that cliché so forgive me, but it’s true in this case.) Ford is currently going for less than 10 times next year’s earnings. The automaker just reportedvery good sales growth in Europe, especially in Britain and Italy. Ford remains a good buy up to $17 per share.
Earlier I mentioned that Stryker (SYK) reached a new 52-week high. I also expect to see Stryker increase its dividend soon. Last year’s increase came on December 4. The company currently pays 30.5 cents per share. I think that will go up to 33 to 34 cents per share. Stryker is a buy up to $90 per share.
That’s all for now. Next week, we’ll get important reports on Industrial Production and Capacity Utilization. On Wednesday, the Fed will release the minutes from the last FOMC meeting. That’s when the Fed decided to end Quantitative Easing. On Thursday, we’ll get the latest report on Consumer Inflation. I expect to see more evidence that the strong dollar is holding back prices. We’ll also get earnings reports from Medtronic and Ross Stores. Be sure to keep checking the blog for daily updates. I’ll have more market analysis for you in the next issue of CWS Market Review!
– Eddy
Named by CNN/Money as the best buy-and-hold blogger, Eddy Elfenbein is the editor of Crossing Wall Street. His free Buy List has beaten the S&P 500 for the last seven years in a row. This email was sent by Eddy Elfenbein through Crossing Wall Street.

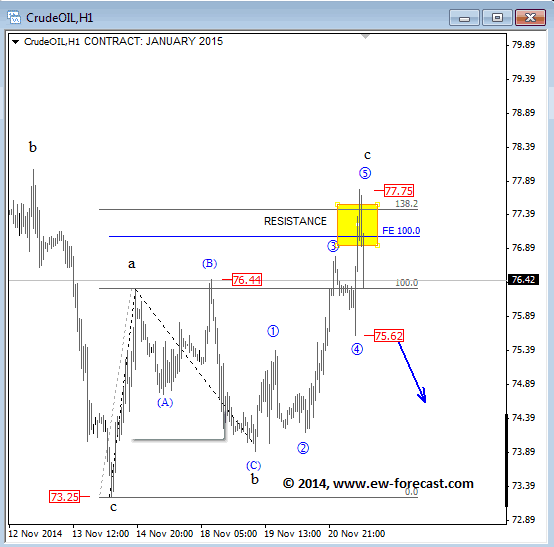
Crude oil is turning down sharply down after making a new high that has been expected for a completed five wave cycle in wave c. Further weakness through 75.62 will be bearish for crude that could then revisit 73.25 lows next week.
CRUDE OIL (January 2015) 1h Elliott Wave Analysis
GOLD is at the highs following the pattern from start of November when metals broke higher each Friday. Well, we see price at the highs, but this time rally can be different and much smaller as we see prices in wave (v), final leg of a larger five wave recovery. In fact, we see breakout from a triangle, so it’s the final trust, therefore upside can be limited around 1210-1215.
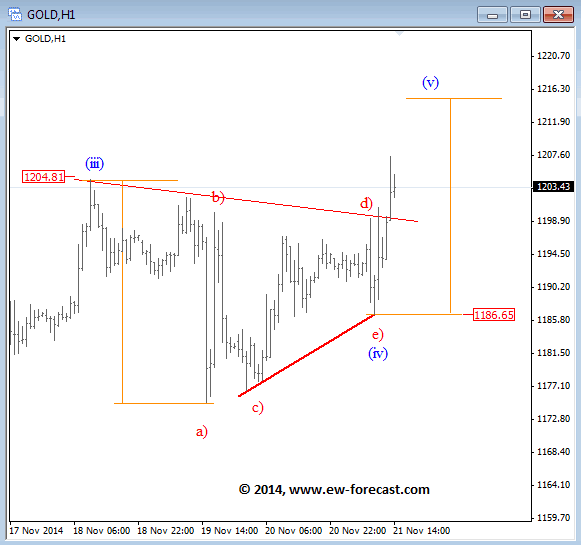
GOLD 1h Elliott Wave Analysis
Subscribe Our Newsletter If you already haven’t >> http://goo.gl/8QVevl

-
I know Mike is a very solid investor and respect his opinions very much. So if he says pay attention to this or that - I will.
~ Dale G.
-
I've started managing my own investments so view Michael's site as a one-stop shop from which to get information and perspectives.
~ Dave E.
-
Michael offers easy reading, honest, common sense information that anyone can use in a practical manner.
~ der_al.
-
A sane voice in a scrambled investment world.
~ Ed R.
Inside Edge Pro Contributors

Greg Weldon

Josef Schachter

Tyler Bollhorn

Ryan Irvine

Paul Beattie

Martin Straith

Patrick Ceresna

Mark Leibovit

James Thorne

Victor Adair