
Economic Outlook
 There can be little doubt that data releases rather than experience or intuition are driving the economic conversation. This is perhaps a function of the disconnection that many people feel about an economy that they no longer understand. Rather than trusting their own eyes or their own gut to form an opinion, it’s much easier to grab a set of convenient numbers. The big question then becomes what numbers you choose to look at and which you choose to ignore.
While there are a great many types of economic data releases, issued by a myriad of public and private sources, two reports have risen above the rest in importance: the Quarterly GDP estimates issued by the Bureau of Economic Analysis, and the monthly jobs report issued by the Bureau of Labor Statistics. And those two reports have been recently coming up roses. The 3rd quarter GDP growth report, released on November 25th, revised growth upwards to an annualized rate of 3.9%, and the November Jobs report, released on December 5th, showed the creation of 321,000 new jobs in November, the highest monthly total in nearly three years. These reports have solidified the views of the mass of analysts that the U.S. economy is currently firing on all cylinders.
But to make this conclusion, almost all the other data sets, which used to be considered significant, have been either ignored or, when that proves impossible, rationalized away to make the figures unimportant. This never happens with strong data, which is typically accepted at face value.
In the weeks leading up to, and the days after, the recent GDP and jobs reports, a torrent of data releases came in that were almost universally awful. However, in our current era of journalistic lethargy, these reports have received almost no attention at all.
While it would be too long and boring to list all of these moribund statistics, here is a brief overview, in chronological order, of what you are likely not hearing:
November 24 – The Chicago Fed National Activity Index, which weighs 85 different economic indicators to gauge the national economy, fell to 0.14 in October from 0.29 in September. The three-month average declined to negative 0.01 from positive 0.12. The index is designed so that readings above zero indicate above-trend growth.
November 24 – Markit’s Flash PMI, which measures service sector health, came in at 56.3 for November, missing expectations of 57.3. This is the lowest reading for the index since April, and the fifth consecutive month of declines.
November 25 – The Richmond Fed Manufacturing Index came in at a very weak 4 for November, which is down sharply from the 20 posted in October, and far below economist expectations. Consensus expectations were for 16, with survey respondents ranging from 12 to 24.
November 25 – The Commerce Department reported that growth in corporate profits (adjusted for depreciation and the value of inventories) slowed sharply in the third quarter to a 2.1% annual rate, down from an 8.4% annualized rate in the second quarter.
November 25 – The Case Shiller 20-City Index showed year over year price gains of only 4.9%, the lowest reading since October 2012. This continues a trend of a decreasing rate of home price appreciation.
November 25 – The Conference Board reported that U.S. Consumer Confidence dropped to 88.7 in November from a revised 94.1 in October. The November drop was unexpected and puts the index at its lowest reading since June. Economists surveyed by The Wall Street Journal had forecast November to come in at 96.5.
November 26 – U.S. durable-goods orders rebounded 0.4 percent in October after September’s decline of 0.9 percent. However, the rise largely reflected a 45.3% surge in demand for defense aircraft and parts, which masked weak demand elsewhere. Excluding transportation, orders fell 0.9%, the biggest drop since December 2013. Excluding defense-related products, orders fell 0.6%.
November 26 – Personal income rose by only .2% in October, half of the .4% expected by economists.Personal spending also increased by .2%, but this was 33% less than the .3% consensus expectations.
November 26 – Manufacturing activity in the Chicago-area expanded 60.8 in November, which represents a significant drop from 66.2 in October. The decline was larger than the consensus expectations for a decline to 63.
December 3 – Mortgage applications decreased 7.3% from the week earlier, the second straight week of declines.
December 3 – The National Retail Federation reported that Thanksgiving weekend retail sales came in at a disappointing $51 billion, down 11% from 2013. This data includes the entire four day weekend, in which many retailers operated under longer hours than they have in years past.
December 5 – Although the Trade Deficit narrowed slightly to $43.4 billion in October, the figure was actually higher than the consensus estimates and only came down because the September numbers were revised higher. In addition, the trade deficit in manufactured products hit $71.2 billion, the highest on record.
December 5 – Factory orders fell for the third consecutive month, shrinking 0.7% (more than double the .0.3% rate that had been expected) in October after declining 0.5% in September.
December 5 – Consumer credit rose $13.2 billion in October but the increase was far less than the $16.8 billion expected by a Bloomberg survey of economists (September’s rate that had also come in well below the consensus estimate was revised even lower). The gain was largely centered on a $12.3 billion increase in non-revolving credit that includes auto financing and the government’s acquisition of student loans from private lenders. Revolving credit rose only $0.9 billion, down from an already disappointing $1.4 billion in September.
Although the national elections are generally not counted as an economic indicator, the November mid-term elections reflected overwhelming economic dissatisfaction among voters, which resulted in a drubbing at the polls for Democrats associated with the President’s agenda.
So if the majority of the granular reports of weak economic activity persist and the public remains unaware or unconvinced that the economy is improving, how could it be that the two most followed reports could be so strong?
There is much in both the GDP and the Jobs Report that is dependent on forward-looking expectations. I believe that both reports are showing improvement because businesses are building inventory and hiring staff in anticipation of an economy that they believe will continue to improve. It’s like the Field of Dreams recovery, prepare for it and it will come. But I think businesses are following the false narrative, and ignoring, or rationalizing, the bad data as thoroughly as does the media. When they realize they were fooled by the hype, jobs will be lost, and GDP will fall.
Furthermore, the GDP and jobs data would certainly be far weaker if the Federal Reserve were not providing so much monetary support. Sure, they have discontinued the vast majority of the QE, but interest rates are still at zero percent. What would GDP or job growth look like if consumers, businesses, and the federal government were forced to pay anything that approaches the historically normal interest rates on our much greater than normal level of debt? My guess is that it will be awhile before we find out, as I believe that as the bloom comes off the recovery rose, the Fed will launch another round of QE before it gets around to raising interest rates.
Best Selling author Peter Schiff is the CEO and Chief Global Strategist of Euro Pacific Capital. His podcasts are available on The Peter Schiff Channel on Youtube

The interim bear market in gold and other precious metals that I’ve been tracking for you isn’t the only bear market out there. As I warned quite some time ago, the price of crude oil would also fall substantially, down to below $70 a barrel, and quite possibly lower, before it bottoms.
Since June 19, oil has plunged from $107.44 a barrel to $67.22 as I pen this column, a $40.22 hit, an amazing plunge of more than 37 percent!

More losses are coming for oil. In fact, take a look at this monthly chart of oil that I showed you at the end of last year, and notice how spot on my forecast has been.
Oil is now hovering just above that first major support level. Once it cracks that, oil will plunge to as low as $40.
That leg down to $40 could begin any moment, or perhaps after a short-term rally.
The crash in oil prices is hard to believe, when there are so many diehard oil bulls out there. Even more so when you consider all the political hot spots around the world that are now causing so much turmoil.
But from a fundamental point of view, oil is not bullish. Global oil inventories are fine now; there is no squeeze in supplies.
Moreover, as we all know, the U.S. now has more energy of its own than it’s ever had.
So what is driving oil prices lower? The answer, in my opinion, is simple.
And no, it’s not some far-fetched market manipulation to bring down Putin and Russia.
 What’s driving oil lower is the same thing that is driving nearly all commodities lower. It’s called deflation. That’s especially true for Europe. The euro region is in a freefall. Almost every country in Europe is contracting, severely. Unemployment remains sky high, threatening to move even higher.
And all across the globe, rising geo-political tensions and conflict are driving most business people and investors to play it safe, park money in cash, take risk off the table, and hoard and protect their capital and wealth.
That too is deflationary, for all but the U.S. equity markets. So it’s hardly surprising that oil — like gold, silver, copper and so many other commodities — is still in bear–market territory.
But mark my words: a new oil bull market will form from this decline.
How so, when deflation is so strong right now? When there are so many dynamic changes occurring in the oil market, with the U.S. set to become energy independent?
There are three reasons oil will soar again, after it bottoms (in 2015).
First, there’s China. While China is home to oodles of natural gas, its economy is still oil thirsty and will be for a very long time.
In fact, in terms of dependence on oil, the U.S. and China are moving in opposite directions. While the U.S. will soon be energy independent, China will soon be the #1 consumer of oil and almost entirely dependent upon foreign supplies.
Second, there’s incipient global inflation, and a coming end to the dollar reserve system.Europe will crash into a steep deflationary mode in 2015. But it won’t last forever.
At some point in the not–too–distant future, the euro will crash so much that inflation will reappear in Europe, and even here, too.
In addition, the U.S. dollar will eventually lose its reserve currency role, and be supplanted by a new global reserve currency, in electronic form. The dollar’s diminished global role and the uncertainty of a new monetary system and reserve currency is bound to be very bullish down the road for oil prices.
Third is the war cycles. Right now, they are bearish for oil, as they are for gold. But keep in mind that the cycles of war point consistently higher into the year 2020.
That means that rising geo–political tension around the globe is going to accelerate DRAMATICALLY in the months and years ahead, and at some point — also not too far off in the distant future — it IS going to put a firm bid under oil and energy prices.
The question now, though, is how can you play the downside in oil over the next few months, as oil heads toward a major bottom near the $40 level?
Simple: Buy shares in an inverse ETF. My favorite for oil is the ProShares UltraShort DJ–AIG Crude Oil, symbol SCO.
What about energy shares? With very few exceptions, most should trade lower along with oil over the next few months. Then they will become a fantastic buy.
Until next week …
Best wishes,
Larry
Quotable
“Hubris is one of the great renewable resources.”
P. J. O’Rourke
Commentary & Analysis
What if almost everybody is wrong about the euro?
I have to confess, I have been a long-time doomer and gloomer on the euro. And the last time I was as gloomy as those are in the market now, was just before the currency blasted off for a 25 cent rally against the dollar back in June 2012. Back then I knew it was finally over for the euro. I was extremely confident price action was confirming my brilliant fundamental thematic analysis. My long-held target of parity would soon be realized. Gee, wasn’t I just grand.
Mr. Market shared with me what it means when you are only looking to confirm your own brilliance and not remaining open to data to suggest you may be wrong. The year 2012, my year of maximum confidence in my themes, turned out to be far and away my worst year’s performance in the currency market. at my point of maximum bearishness the euro began its journey on a stunning 20 cent rally. And it turned out to be my worst year ever trading currencies—by far. Hubris kills!
What did I learn? Or should I say, what did I re-learn?
Extreme in speculation = Extreme in price
Of course determining extremes in speculation is easier said than done, I grant you. And this isn’t about picking exact bottoms or tops. But is about being open to sentiment—quantitative and qualitative measures. Or as the great John Percival puts it: Being aware of flashing yellow lights.
If everyone you know is talking about the demise of the euro, especially those who have no business doing so, that is a flashing yellow light to suggest the trend may soon change. It is the way the market works. It is the way the market must work.
When I suggested just recently in a promotion for my service, maybe the euro was putting in a bottom given the one-way extreme levels of speculation as evidenced by open interest levels in the currency futures market, it drew some feedback from readers. These readers shared all the fundamental themes and very solid rationales as to why the euro is done for. They made perfect sense. But the funny thing is, I have heard them all before. It seemed a déjà vu moment all over again.
Today, we are seeing a sharp rally in the euro. It may suggest indeed some type of interim bottom is in place. Or it may be just a bounce. I do not know; though I have my betting suspicions. But given today’s price action in the face of overwhelming euro bearish sentiment, I am sharing two things: 1) a quote from Woody Dorsey explaining why abiding faith in fundamental themes over the technical analysis may be misplaced at times (the full piece from January 2013 can be found here), and 2) a plausible alternative scenario to the consensus theme of Eurozone economic demise.
1) Fundamental themes are ephemeral too…
Where can we find all the latest cultural concepts and investment themes? It turns out that if we want to get a glimpse of market culture, we have to go to the Concept Café. At this kind of café, we don’t order the soup du jour, we listened to the stories du jour. To really understand this we may need to play the part of the flaneur. A flaneur is a gentleman of leisure who frequents cafés and observes the spectacles of street life purely for pleasure. His observations and inferential focus is an apt metaphor for the process of determining the Investment Themes, or the Mind concept of Triune Theory. A flaneur may be in the crowd but is not of the crowd. The life of the street, the culture of the city, and the concerns of the citizens are seen as opera or a story to be both observed and savored. Everything the flaneur sees, every vignette is an open investigation. The flaneur detects everything while no one detects him. The Concept Café is where Investment Theme, or the ephemeral and fickle stories circulating in the market, can be seen and heard. Most people believe the fundamentals are real, solid, authentic, reliable, and durable reasons we can count on to explain the market; however, the flaneur, or a behavioral trader, knows differently. In fact, we have to take into account the reality that the marketplace is full of propaganda or what we call spin. Spin has been an aspect of human behavior from the beginning.
…Descartes had a huge influence on what philosophers call the mind and body question, also known as Dualism. Simply put, the still unresolved problem revolves around the relationship between the body (technical analysis) and the mind (fundamental analysis). Which influences which? What are their natures and how do they interact? We have two natures or live in two different worlds, the world of our minds and the world of our bodies. Descartes came down on the side that the mind is immortal and immutable compared to the body. This presumption is at the heart of the fallacy of “rationalism.” On Wall Street they still think that the Mind, or Investment Themes, rule everything. They’ve always dismiss the body or, the “Technicals,” just because Descartes effectively told them to.
Woody Dorsey, Behavioral Trading
Just maybe Germany was right after all. Just maybe those taking the hard medicine are in fact showing signs of recovery. Just maybe the euro will be around a lot longer than most are betting…
2) Saxo Bank economist Steen Jakobsen discusses why quantitative easing by the ECB could be a huge mistake because the periphery is already showing signs of recovery relative to Germany and he expects Germany to grow strongly next year:
ECB about to make biggest policy mistake in history (12/4/14)
Now a look at EUR/USD Daily…

Thank you.
Jack Crooks
President, Black Swan Capital

 The U.S. dollar is having a tremendous run. A 10% move is significant for a currency like the dollar. So, the fact that it’s made its way that much higher is a big deal. Typically, you’ll see the dollar measured against the euro, but now the dollar-yen trade has really taken on a whole new weight of gravity in terms of the yen moving lower and the dollar moving higher.
The Japanese basically are saying that they’ll pull out all the stops to get inflation rates up toward 2% and get the Japanese economy and export market moving. The debt of Japan is currently about 225% of GDP. So, it’s already pushing the envelope — and that’s where you can start to have problems in terms of trying to put out more debt to pay for all the stimulus. It will be interesting to see how that shapes up.
Over in the eurozone, the European Central Bank is faced with the same uncertainty. The ECB is seeing the latest data show consistent contraction of the key measures over there: the ISM, the PMI and other types of business-confidence numbers. That’s really where we’re starting to see a contraction of growth numbers and inflation numbers in Europe as well.
Now compare that to the U.S., where economic reports are generally showing progress and the greenback has a lot of potential for further appreciation. I expect that the appeal of U.S. dollar-based assets will keep U.S. equities as go-to avenues for growth and income, especially with so much downward pressure on interest rates. Along those lines, here are two high-yield funds that are uniquely positioned to benefit from this environment.
First up is the Legg Mason BW Global Income Opportunities Fund (BWG), a debt fund that takes advantage of strength in the dollar to invest about 50% in foreign assets and generate a current 9% yield. BWG came down a little bit when the emerging markets were hit in October, but it has leveled out right in the mid- to low $17 range. BWG looks fine here, and I see it as a really nice way to play the strong dollar against the weaker foreign currency trade that is currently dominating the forex markets right now.
Let me also call your attention to the DoubleLine Income Solutions Fund (DSL). DSL is Jeff Gundlach’s fund, and he’s considered to be one of the smartest people in the entire bond-market universe. DSL is paying 8.5% right now. Jeff Gundlach has taken advantage of using the strong dollar to invest in the foreign markets, those that have good sovereign-debt ratings as well as the potential for really good exchange currency swaps.
Warning: Dangerous Market Curve Dead Ahead! These 5 high-quality blue chips are head-and-shoulders above the rest in terms of weathering the coming drop and rebounding strongly. I call them my Rotation Rally “Return Giants.” Click here now to get their names so you can start profiting from them immediately.
Both of these funds pay monthly and are trading pretty much within a one-point range for the last few months; DSL is currently trading right around $21. The International Monetary Fund has been lowering the outlook for global growth.
As long as there’s no inflation out there, we have still a case for a decent fixed-income market…as long as you’re not way out on the yield curve, and I really don’t see that as a threat right now. Right now, the U.S. dollar just buys more out there on the market than it would if it were not up 10% against everything else in the world. So, it’s a great time to invest in foreign assets — and BWG and DSL certainly are doing it right.
About Bryan Perry
A leading expert in the world of high-income investing, Bryan Perry has been bringing his wealth-building insights to individual investors and institutions for nearly 30 years. In 2009, Bryan launched his flagship Cash Machine advisory service. At Cash Machine, Bryan investigates hundreds of income-producing vehicles each month so he can identify the small handful that can generate safe, steady and big income to his subscribers. You can find complete details on his latest batch of high-yield picks in a new Special Report: “10 Big Safe Income Doublers Over 10%.” Click here to find out how to get your copy absolutely free!

A glance at any gold price chart reveals the severity of the bear mauling it has endured over the last three years.
More alarming, even for die-hard gold investors, is that some of the fundamental drivers that would normally push gold higher, like a weak US dollar, have reversed.
Throw in a correction-defying Wall Street stock market and the never-ending rain of disdain for gold from the mainstream and it may seem that there’s no reason to buy gold; the bear is here to stay.
If so, then I have a question. Actually, a whole bunch of questions.
If we’re in a bear market, then…
Why Is China Accumulating Record Amounts of Gold?
Mainstream reports will tell you Chinese imports through Hong Kong are down. They are.
But total gold imports are up. Most journalists continue to overlook the fact that China imports gold directly into Beijing and Shanghai now. And there are at least 12 importing banks—that we know of.
Counting these “unreported” sources, imports have risen sharply. How do we know? From other countries’ export data. Take Switzerland, for example:
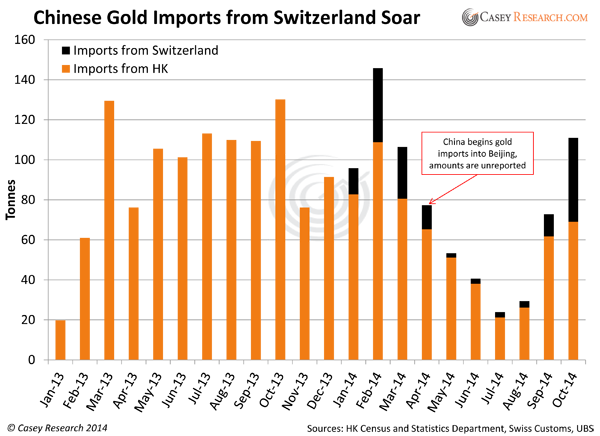
So far in 2014, Switzerland has shipped 153 tonnes (4.9 million ounces) to China directly. This represents over 50% of what they sent through Hong Kong (299 tonnes).
The UK has also exported £15 billion in gold so far in 2014, according to customs data. In fact, London has shipped so much gold to China (and other parts of Asia) that their domestic market has “tightened significantly” according to bullion analysts there.
Why Is China Working to Accelerate Its Accumulation?
This is a growing trend. The People’s Bank of China released a plan just last Wednesday to open up gold imports to qualified miners, as well as all banks that are members of the Shanghai Gold Exchange. Even commemorative gold maker China Gold Coin could qualify to import bullion. Not only will this further increase imports, but it will serve to lower premiums for Chinese buyers, making purchases more affordable.
As evidence of burgeoning demand, gold trading on China’s largest physical exchange has already exceeded last year’s record volume. YTD volume on the Shanghai Gold Exchange, including the city’s free-trade zone, was 12,077 tonnes through October vs. 11,614 tonnes in all of 2013.
The Chinese wave has reached tidal proportions—and it’s still growing.
Why Are Other Countries Hoarding Gold?
The World Gold Council (WGC) reports that for the 12 months ending September 2014, gold demand outside of China and India was 1,566 tonnes (50.3 million ounces). The problem is that demand from China and India already equals global production!
India and China currently account for approximately 3,100 tonnes of gold demand, and the WGC says new mine production was 3,115 tonnes during the same period.
And in spite of all the government attempts to limit gold imports, India just recorded the highest level of imports in 41 months; the country imported over 39 tonnes in November alone, the most since May 2011.
Let’s not forget Russia. Not only does the Russian central bank continue to buy aggressively on the international market, Moscow now buys directly from Russian miners. This is largely because banks and brokers are blocked from using international markets by US sanctions. Despite this, and the fact that Russia doesn’t have to buy gold but keeps doing so anyway.
Global gold demand now eats up more than miners around the world can produce. Do all these countries see something we don’t?
Why Are Retail Investors NOT Selling SLV?
SPDR gold ETF (GLD) holdings continue to largely track the price of gold—but not the iShares silver ETF (SLV). The latter has more retail investors than GLD, and they’re not selling. In fact, while GLD holdings continue to decline, SLV holdings have shot higher.

While the silver price has fallen 16.5% so far this year, SLV holdings have risen 9.5%.
Why are so many silver investors not only holding on to their ETF shares but buying more?
Why Are Bullion Sales Setting New Records?
2013 was a record-setting year for gold and silver purchases from the US Mint. Pretty bullish when you consider the price crashed and headlines were universally negative.
And yet 2014 is on track to exceed last year’s record-setting pace, particularly with silver…
- November silver Eagle sales from the US Mint totaled 3,426,000 ounces, 49% more than the previous year. If December sales surpass 1.1 million coins—a near certainty at this point—2014 will be another record-breaking year.
- Silver sales at the Perth Mint last month also hit their highest level since January. Silver coin sales jumped to 851,836 ounces in November. That was also substantially higher than the 655,881 ounces in October.
- And India’s silver imports rose 14% for the first 10 months of the year and set a record for that period. Silver imports totaled a massive 169 million ounces, draining many vaults in the UK, similar to the drain for gold I mentioned above.
To be fair, the Royal Canadian Mint reported lower gold and silver bullion sales for Q3. But volumes are still historically high.
Why Are Some Mainstream Investors Buying Gold?
The negative headlines we all see about gold come from the mainstream. Yet, some in that group are buyers…
Ray Dalio runs the world’s largest hedge fund, with approximately $150 billion in assets under management. As my colleague Marin Katusa puts it, “When Ray talks, you listen.”
And Ray currently allocates 7.5% of his portfolio to gold.
He’s not alone. Joe Wickwire, portfolio manager of Fidelity Investments, said last week, “I believe now is a good time to take advantage of negative short-term trading sentiment in gold.”
Then there are Japanese pension funds, which as recently as 2011 did not invest in gold at all. Today, several hundred Japanese pension funds actively invest in the metal. Consider that Japan is the second-largest pension market in the world. Demand is also reportedly growing from defined benefit and defined contribution plans.
And just last Friday, Credit Suisse sold $24 million of US notes tied to an index of gold stocks, the largest offering in 14 months, a bet that producers will rebound from near six-year lows.
These (and other) mainstream investors are clearly not expecting gold and gold stocks to keep declining.
Why Are Countries Repatriating Gold?
I mean, it’s not as if the New York depository is unsafe. It and Ft. Knox rank as among the most secure storage facilities in the world. That makes the following developments very curious:
- Netherlands repatriated 122 tonnes (3.9 million ounces) last month.
- France’s National Front leader urged the Bank of France last month to repatriate all its gold from overseas vaults, and to increase its bullion assets by 20%.
- The Swiss Gold Initiative, which did not pass a popular vote, would’ve required all overseas gold be repatriated, as well as gold to comprise 20% of Swiss assets.
- Germany announced a repatriation program last year, though the plan has since fizzled.
- And this just in: there are reports that the Belgian central bank is investigating repatriation of its gold reserves.
What’s so important about gold right now that’s spurned a new trend to store it closer to home and increase reserves?
These strong signs of demand don’t normally correlate with an asset in a bear market. Do you know of any bear market, in any asset, that’s seen this kind of demand?
Neither do I.
My friends, there’s only one explanation: all these parties see the bear soon yielding to the bull. You and I obviously aren’t the only ones that see it on the horizon.
Christmas Wishes Come True…
One more thing: our founder and chairman, Doug Casey himself, is now willing to go on the record saying that he thinks the bottom is in for gold.
I say we back up the truck for the bargain of the century. Just like all the others above are doing.
With gold on sale for the holidays, I arranged for premium discounts on SEVEN different bullion products in the new issue of BIG GOLD. With gold and silver prices at four-year lows and fundamental forces that will someday propel them a lot higher, we have a truly unique buying opportunity. I want to capitalize on today’s “most mispriced asset” before sentiment reverses and the next uptrend in precious metals kicks into gear.
It’s our first ever Bullion Buyers Blowout—and I hope you’ll take advantage of the can’t-beat offers. Someday soon you will pay a lot more for your insurance. Save now with these discounts.


-
I know Mike is a very solid investor and respect his opinions very much. So if he says pay attention to this or that - I will.
~ Dale G.
-
I've started managing my own investments so view Michael's site as a one-stop shop from which to get information and perspectives.
~ Dave E.
-
Michael offers easy reading, honest, common sense information that anyone can use in a practical manner.
~ der_al.
-
A sane voice in a scrambled investment world.
~ Ed R.
Inside Edge Pro Contributors

Greg Weldon

Josef Schachter

Tyler Bollhorn

Ryan Irvine

Paul Beattie

Martin Straith

Patrick Ceresna

Mark Leibovit

James Thorne

Victor Adair