
Asset protection
 One of my old rules of trading is that whenever a major asset class, index, or other benchmark has a sudden, rapid move in price, something blows up. Sky high. (related by John Mauldin – How the Rising Dollar Could Trigger the Next Global Financial Crisis – Editor Money Talks)
That’s because people get used to regimes. They get used to a certain state of affairs with a lack of volatility. They become complacent. Maybe they stop hedging. Maybe they allow themselves to have unbounded downside risk. Maybe they start gambling.
In the last month, we’ve seen massive moves in the dollar and oil—and I assure you, someone is going to get hurt.
So far I haven’t said anything controversial. Energy companies are going to get hurt by lower oil prices. Exporters are going to get hurt by a rising dollar. A chimpanzee could figure this out.
But there are second-order effects. People are starting to figure out that Canadian banks are going to get hurt by the lack of investment banking business from the energy sector, and the stocks are getting punished.
And there are third-order effects too, which people will soon discover.
If you sit around and think hard enough, you can make these sorts of connections. Some people are very good at this. A commodity price moves fast, and they can figure out the point of maximum pain for some company far down the supply chain from the actual commodity.
I’m not that smart. But I’m smart enough to get out of the way when something big and important like oil moves 40%.
Let’s step into our time machine and set the dial to 1994. That was the year when interest rates backed up a couple of percentage points. Remember the bond market vigilantes? They were pricing in Hillarycare and a Democratic Party wish list, and they caned the bond market until interest rates were making borrowers squeal.
But what was interesting about 1994 was that in the grand scheme of things, interest rates didn’t go up all that much. Just a couple of percentage points. Now, if I asked you who you thought would get hurt by rising rates, you might say banks, hedge funds. And you would be wrong. Who got hurt by rising interest rates?
Procter & Gamble.
Orange County, CA.
Mexico.
Why did the first two blow up? Derivatives.
By the way, I’m not referring to derivatives pejoratively. I’ve spent most of my adult life trading them. They’re not financial weapons of mass destruction. What they do is take risk over here and move it over there. So if bank XYZ was negatively exposed to higher interest rates, they were able to offset that exposure to Orange County through derivatives.
Of course, the derivatives Orange County was trading were very exotic and clearly unsuitable for a municipality, but that’s a discussion for another time over a burger and a beer. The point is that rates moved, and they moved fast, and stuff blew up.
But not the stuff you thought would blow up.
Buying Volatility on the Cheap
So I know what you’re going to ask me next: What’s going to blow up?
Who knows? By definition, you can’t know, especially when the risk has been laid off through derivatives.
But this is how it works: Oil moves 40%, the dollar moves 10-15%, and someone’s out of business. It could be someone big. It could be someone systemically important, someone that could really spook the markets. So when stuff like this happens, I get myself exposure to things that gain from disorder (paraphrasing Black Swan author Nassim Taleb).
With the S&P 500 Index (SPX) at 2,050 and the CBOE’s Volatility Index (VIX) at about 15, systemic risk is vastly underpriced.
I’m not saying that stocks are too high, that I’m bearish. I’m just saying that the derivatives markets aren’t pricing in what could be a big unwind based on these oil and dollar moves.
Translation: volatility is cheap.
Is $60 oil bullish for stocks, long term? Absolutely. It is one of the most bullish things I can think of. One of my clients recently told me that this decline in oil will result in $100,000 in annual fuel savings for his business. Multiply that times everyone. So bullish. And the dollar, also long-term bullish. But in the short term, there’s an Amaranth out there somewhere, potentially.
Maybe it’s not a hedge fund. Maybe it’s a company like Coca-Cola (KO) that gets the majority of its earnings from overseas. Maybe it’s the railroads. The person who can figure this out wins the prize.
As I said before, I’m not that smart… just a former trader with scabs on his knuckles. But the funny thing about those traders—especially the ones over 40—is they have a nose for trouble. I’m all in favor of bullish developments, just not when they happen really fast and nobody is ready, which is how people get maimed.
Position: long three-month SPY puts, short Canadian Imperial Bank of Commerce (CM) and Toronto-Dominion Bank (TD) (the US-listed shares).

Jared Dillian

 2014 hasn’t been the best year for mining companies, and those involved in exploration and development have been having an especially difficult time. Indeed, a recent white paper from SNL Metals & Mining is not out of line in calling the situation a “persistent financing drought.”
However, despite the volatile market, there’s definitely still some silver lining out there. A recent report from Haywood Securities entitled “Down But Not Out — Identifying Opportunities in the Exploration and Development Space” looks at several companies that the firm believes are positioned to do well next year.
Overall, Haywood suggests that “while the [exploration and development] group may be down, it is certainly not out, with many good opportunities remaining.”
….continue reading 7 Companies ‘Best Positioned to Deliver in 2015′ HERE

Briefly: In our opinion, speculative short positions are favored (with stop-loss at 2,085 and profit target at 1,950, S&P 500 index).
Our intraday outlook is bearish, and our short-term outlook is bearish:
Intraday (next 24 hours) outlook: bearish
Short-term (next 1-2 weeks) outlook: bearish
Medium-term (next 1-3 months) outlook: neutral
Long-term outlook (next year): bullish
The U.S. stock market indexes lost 1.5-1.6% on Wednesday, extending their short-term downtrend, as investors reacted to worsening global economic conditions. The S&P 500 index broke below its early November consolidation, as it got closer to the level of 2,000. The nearest important level of support is at around 2,000-2020. On the other hand, resistance level is at around 2,040-2,050, marked by previous local lows, among others. For now, it looks like a correction within an uptrend, however, a negative reversal scenario cannot be excluded here:

Expectations before the opening of today’s trading session are slightly positive, with index futures currently up 0.1-0.2%. The European stock market indexes have been mixed so far. Investors will now wait for some economic data announcements: Initial Claims, Retail Sales at 8:30 a.m., Business Inventories at 10:00 a.m. The S&P 500 futures contract (CFD) bounces off support level at around 2,020-2,025. The nearest important level of resistance remains at 2,030-2,035, marked by recent local low, and the next resistance level is at 2,050-2,060, as we can see on the 15-minute chart:

The technology Nasdaq 100 futures contract (CFD) follows a similar path, as it bounces off support level at around 4,200-4,220. The nearest important level of resistance is at around 4,250-4,260, marked by previous support level, among others, as the 15-minute chart shows:

Concluding, the broad stock market extended its short-term downtrend. We continue to maintain our already profitable speculative short position. Stop-loss is at 2,085 and potential profit target is at 1,950 (S&P 500 index). It is always important to set some exit price level in case some events cause the price to move in the unlikely direction. Having safety measures in place helps limit potential losses while letting the gains grow.
Thank you.

 It’s not just surfers who scrutinize wave patterns. Steven Hochberg, chief market analyst at Elliott Wave International, uses the Wave Principle to predict the movements of commodities and the stock market based on a number of factors, including sentiment. In this interview with The Gold Report, he reads the waves and sees indications that the stock market is headed for a downtrend, while commodities will move up, although not in a direct line.
The Gold Report: You have warned that the S&P 500 and NASDAQ are in retreat and that we are entering a bear market that our grandkids will have to live through. What are the signs of that?
Steven Hochberg: The retreat hasn’t been very big so far, but we see a couple of signs that its start is imminent.
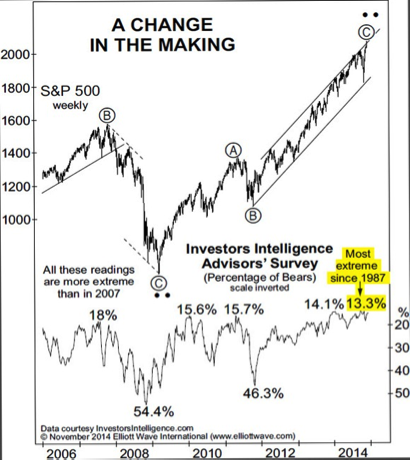
First, we look at all markets through our model, which is called the Wave Principle. It is based on R.N. Elliott’s discovery that waves of social mood, from optimism to pessimism and back to optimism, create specific patterns. We believe the market is at the end of its long rally because that wave pattern is coming to its terminal point. That’s the main indicator.
But we also look at other indicators to confirm or refute what we’re seeing. Many indicators are confirming that we’re in the end stages of the rally that started in 2009. Sentiment is one. Sentiment tends to get very extreme at trend reversal points. It is extremely optimistic at highs and extremely pessimistic at lows. The bears shrink down to almost nothing when you’re coming into a rally high. A service called Investors Intelligence tracks the percentage of bulls and bears among advisers. Recently, the bear contingent shrank down to 13.3%, which was the lowest in 27 years.
Another indicator is the percentage of money and money market funds relative to assets. That number is at a historic low. That means managers don’t feel that they need to hold anything back in reserve in case of a market decline. They’re fully invested with this market. The exact opposite happens at lows. At the lows in 2002 and 2009, managers had a huge percentage of their money in money market funds, the reason being that the market had been going down and they were scared. Now, we’re at the opposite end.
Internally, the market is starting to thin. The rally is narrowing. For example, the small-cap sector, as indicated by the Russell 2000 Index, made its closing high in March 2014, and it has not confirmed the Dow’s rally to a new high or to the NASDAQ. This narrowing is typical at the end of a stock rally, until finally only a couple of sectors are going up. Then, everything rolls over and goes to the downside. That is where we’re arriving at in this cycle. I think the next major move for stocks will be to the downside.
TGR: What does this transition look like? Will small caps and large caps be affected differently during the transition?
SH: Initially, perhaps, but eventually they will go down together.
The small-cap sector, which represents the higher-beta, less-liquid stocks within the overall market, tends to top out a bit sooner.
We look at the ratio of small caps to large caps by dividing the Russell 2000 by the Russell 1000 Index. It has been nine months since the Russell 2000 hit its high. Since then, the ratio is down 11%. During that same time, the blue chips have been making higher highs. That ratio has a succession of lower lows and lower highs. It’s in a downtrend. That’s a key signal that the market is thinning and ready to go down. When the blue chips roll over, both will be aligned on the downside.
TGR: On Nov. 11, you issued an interim report that said for the first time in three years your charts were indicating that a significant countertrend rally was at hand. What are the Elliott Waves telling you?
SH: That was a countertrend rally specific to gold—a fascinating market that we have followed and will continue to follow closely.
Gold topped out in September 2011 at a $1,921/ounce ($1,921/oz) spot price and has declined pretty persistently until now. It went sideways in late 2013 into early 2014, but the Elliott Wave pattern that we were following suggested gold would go down again, and it has.
We’ve been forecasting these waves of optimism and pessimism as they’ve been unfolding to the downside in gold. For the first time in three years, we were able to count a complete declining Elliott Wave pattern from gold’s 2011 high. That’s why we issued a combined interim report from our two main newsletters, The Elliott Wave Theorist, written by Robert Prechter, and The Elliott Wave Financial Forecast, which I write with my partner, Peter Kendall. This was only the second combined interim report that we’ve put out in our history. We did it because we saw extremes in sentiment that suggested to us the start of an impending gold rally. I think that rally is in its very infancy right now. Ultimately, it’s going to carry gold higher. I think gold has upside potential from here.
TGR: You talk about the importance of sentiment in your analysis, but different parts of the investing market act differently. What is the role of small traders versus goldbugs and institutions in both bear and bull rallies? Who turns first?
SH: That’s a good question, and it’s interchangeable.
We here at Elliott Wave International are goldbugs because we believe that gold—as it has been for centuries—is true money.
In the context of our report, which came out two trading days after gold’s recent low, we were referencing goldbugs as investors who were never going to turn bearish on gold; people who were forecasting $5,000/oz, $10,000/oz gold. Eventually, we’ll probably get there, but nothing is straight up.
We’re trying to take a more pragmatic approach, a tactical approach based on what the waves tell us. For example, sentiment, which is a big part of the gold sector, had gotten very extreme. Several days before gold hit its all-time high in September 2011, the Daily Sentiment Index, put out by trade-futures.com, moved to a record high of 96% on a five-day average. That means virtually all the traders thought gold was going higher. To us, this extreme ebullience was consistent with a high. Fast forward to today, the Daily Sentiment Index of traders had fallen to a record low of 5%. That was significant.
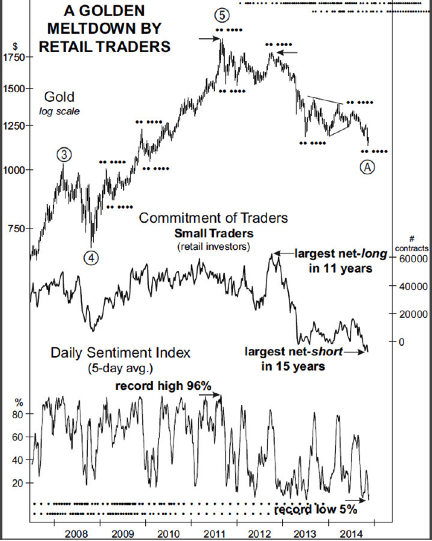
For small traders, the Commodity Futures Trading Commission (CFTC) tracks futures and options traders. The weekly Commitment of Traders Report chops the market into three cohorts: small traders whose positions are so low they really don’t have to report to the CFTC; the large speculators; and the commercials, or the insiders. Each cohort moves in its own ways.
For example, when gold was at $1,800/oz in October 2012—which was a countertrend rally high, in other words a lower high than it was in 2011—small traders had moved to the greatest net long in 11 years in futures and options. Even though gold was not at a new high, the small traders were more bullish than they were at the high. Now, small traders have gone from that October 2011 largest net long in 11 years to recently having their largest net short position in 15 years. Gold is down 37% and the small traders are betting it’s going to continue to the downside. Just as they were wrong in October 2012, we think they’re going to be wrong here at this low.
TGR: Based on that, what is your target price for gold in 2015?
SH: I think a reasonable target price is in the $1,440–1,525/oz range. We’ll be able to refine that as we see the wave structure unfold and do our internal calculations. Based on what the Elliott Waves are showing, I think this is a countertrend rally.
Major declines typically have an ABC pattern. You have your A wave down, then you have a B-wave rally that retraces a percentage of the preceding decline and then you go down in a C wave to make what is the final low in an ABC pullback, or decline.
We think that November’s low is the A wave, that initial leg down, to be followed by a B-wave rally. The A wave lasted from September 2011 to November 2014. The B wave will probably last well into 2015, if not all year.
TGR: What do the charts tell you about silver?
SH: Silver will move more or less with gold. As gold rallies in its B wave, silver will rally in its equivalent B wave. A reasonable target price would be around $22.50/oz, maybe up to $26/oz in the countertrend rally. It’s going to take a couple of months to get up there.
TGR: Are you also positive on the platinum group metals?
SH: Yes, they should go higher, too. So will oil most likely, although we think oil will decline further before the rally. Once that rally gets going, it would not be unreasonable to see oil at $84/barrel, maybe $95. That’s probably a reasonable target in a countertrend rally, but first we have to get a low in place.
TGR: Is oil more difficult to predict because there are so many political factors at play?
SH: We don’t think that outside factors cause markets to move. We think outside news events are simply the result of socio-psychological forces that have already occurred and have already been reflected in the waves.
We think movements are endogenous. They’re internal. As people get more pessimistic or optimistic, their behavior traces out waves. The news reports that you read are simply after-the-fact accounts of people’s emotions, or waves, of optimism and pessimism that have already been expressed.
The Elliott Waves look pretty clear in oil, as well as gold and silver.
TGR: Is the recent downside in commodities more about the strength of the U.S. dollar than what’s actually happening in the commodities sector?
SH: I would say the trends in commodities and oil and trends in the dollar are more coincident than causal.
Since May, the commodity markets have been down and the dollar has been rallying very strongly, giving the appearance that it’s all due to the dollar going up and the commodities going down relative to dollars. But all correlations or movements tend to be time dependent.
By that I mean there are times when they move apart as they are right now, and there are times when they move together.
For example, from January through November 2005, the dollar was rallying; it was up 15%. Commodities in the CRB Index were up 17%. Both were moving together. Today, they’re moving apart. It appears that one is causing the other, but I think they’re really coincident moves at this point.
TGR: What do your charts tell you about the prospects for the dollar versus the yen and the euro in 2015?
SH: In the longer term, we’re very bullish on the dollar.
The dollar made its low in 2008 and has quietly been creeping higher. Longer term, I think the dollar will go higher because we’re going into a deflationary environment. That’s significant for the dollar because most of the debt in the world is denominated in dollars. Debtors will need dollars to pay their debts, whether that happens through repayment, default, restructuring or whatever.
Having said that, the dollar has had a major run since May. In terms of the Elliott Wave structure, it appears that we’re in the very latter stages of a five-wave rally from the May low. Just as gold had a five-wave decline and came into a low and is now due for a big B-wave rally. Something similar could be said for the dollar, but in the opposite direction.
The dollar is in the late stages of a five-wave rally and sentiment is extreme. The Daily Sentiment Index hit 95% on Nov. 6. That means only 5% of the traders thought the dollar was going to go down; 95% thought it would continue to rally. The fact that this extreme sentiment is occurring in the fifth wave of a five-wave move suggests to us that we’re in for a correction in the dollar. So, while we are bullish longer term, it’s not going to be a straight line. We’ve had a great run-up. We’re due for a correction in the coming months.
TGR: In light of these trends, what is the optimum strategy for investors going into 2015?
SH: That’s a tough question to answer. The value of a lot of assets goes down in a deflationary environment. The metals are down from 2011, oil is down from 2008, commodities are down from 2008, the 10-year Treasury note is down from a high in July 2012. A lot of markets and asset classes are already deflating. Even though we expect a countertrend rally in some of these assets, it will be a difficult rally to play. When the U.S. stock indexes roll over, there will be an across-the-board deflation in which a lot of assets go down together. Fashioning a strategy is very difficult in this type of environment.
We are telling our subscribers to be safe in 2015. If that means cutting back on stocks or increasing short-term Treasury holdings—do what you believe will keep you safe.
I think safe means probably short-term Treasuries, even though they’re not paying you anything. If you have to be in stocks, be as defensive as possible. I like gold for money you want to speculate with on a shorter-term basis. A gold rally is likely to unfold over several months.
TGR: Steven, thank you for your time and your insights.
Readers can get a free copy of “Gold & Silver: How to Use the Wave Principle to Identify Actionable Opportunities” here.
 Steven Hochberg is chief market analyst for Elliott Wave International. He is also the co-editor of The Elliott Wave Financial Forecast, a monthly financial newsletter, as well as editor of The Short Term Update, a three times a week online market forecasting service. Hochberg began his career with Merrill Lynch & Co. and joined Elliott Wave International in 1994, where he quickly established a stellar reputation providing analysis to large institutional traders and hedge funds. Hochberg is a sought after speaker and has been widely quoted in various media outlets such as USA Today, The Los Angeles Times, The Washington Post, Barron’s, Reuters and Bloomberg and has been interviewed numerous times for his market views by CNBC, MSNBC and Bloomberg Television.
Want to read more Gold Report interviews like this? Sign up for our free e-newsletter, and you’ll learn when new articles have been published. To see a list of recent interviews with industry analysts and commentators, visit our Streetwise Interviews page.
DISCLOSURE:
1) JT Long conducted this interview for Streetwise Reports LLC, publisher of The Gold Report, The Energy Report, The Life Sciences Report and The Mining Report, and provides services to Streetwise Reports as an employee.
2) Steven Hochberg: I was not paid by Streetwise Reports for participating in this interview. Comments and opinions expressed are my own comments and opinions. I determined and had final say over which companies would be included in the interview based on my research, understanding of the sector and interview theme. I had the opportunity to review the interview for accuracy as of the date of the interview and am responsible for the content of the interview.
3) Interviews are edited for clarity. Streetwise Reports does not make editorial comments or change experts’ statements without their consent.
4) The interview does not constitute investment advice. Each reader is encouraged to consult with his or her individual financial professional and any action a reader takes as a result of information presented here is his or her own responsibility. By opening this page, each reader accepts and agrees to Streetwise Reports’ terms of use and full legal disclaimer.
5) From time to time, Streetwise Reports LLC and its directors, officers, employees or members of their families, as well as persons interviewed for articles and interviews on the site, may have a long or short position in securities mentioned. Directors, officers, employees or members of their families are prohibited from making purchases and/or sales of those securities in the open market or otherwise during the up-to-four-week interval from the time of the interview until after it publishes.

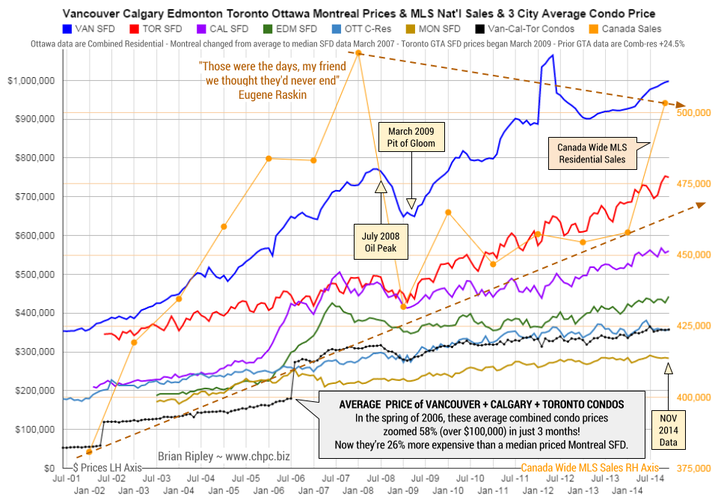
In November 2014 Edmonton single family detached average prices (green plot line) hit a new historical high while the rest of the big city metros took a break under their respective highs in a year that is seeing the total MLS sales across Canada project the biggest single sales year since the 2008-2009 plunge.
It remains interesting to note that the combined average price of a Vancouver, Calgary & Toronto condo is currently 26% more expensive than a median priced Montreal SFD and note also that in the spring of 2006, those 3-City average condos zoomed 58% in price (over $100,000) in just 3 months as the buy side of the market freaked out over the inversion of the 10yr less the 2yr spread as it went negative (Yield Curve).
Mattress money has gushed into condos with no respect for fundamentals or plan for contingencies that may be required if Pit of Gloom II develops and one must write off capital gains and rely on employment earnings.
The average detached housing prices for Vancouver, Calgary, Edmonton, Toronto, Ottawa* and Montréal* as well as the average of Vancouver, Calgary and Toronto condo (apartment) prices (Left Axis).
On the right axis is the MLS Annual Total Residential Sales across Canada; the most recent data point being a projection to year end.

-
I know Mike is a very solid investor and respect his opinions very much. So if he says pay attention to this or that - I will.
~ Dale G.
-
I've started managing my own investments so view Michael's site as a one-stop shop from which to get information and perspectives.
~ Dave E.
-
Michael offers easy reading, honest, common sense information that anyone can use in a practical manner.
~ der_al.
-
A sane voice in a scrambled investment world.
~ Ed R.
Inside Edge Pro Contributors

Greg Weldon

Josef Schachter

Tyler Bollhorn

Ryan Irvine

Paul Beattie

Martin Straith

Patrick Ceresna

Mark Leibovit

James Thorne

Victor Adair