
Energy & Commodities
The FED’s easy money has encouraged rampant energy speculation and over-investment, resulting in more than $500 billion in new loans and investments in just the past 4 years. And so long as Crude prices stayed comfortably above $90, investments made money and everyone was happy. But once energy prices started falling, the decline quickly became a negative loop-back effect because the very high levels of leverage could not tolerate the move. Whenever asset prices fall in a highly levered market, there is often a sudden lack of liquidity to absorb the speculators’ need to unwind leverage, leading to desperation and fire sales. In the case of energy, the sudden disappearance of “investors” highlights just how speculative the underlying market had become.
It’s not exactly a Black Swan event, since Crude and other assets occasionally move with incredible ferocity. But to a highly levered and speculative population who chose to ignore the risks as being far too improbable to worry about, it’s a situation where debt cannot be offloaded at any reasonable price. At $55 bbl Crude prices, much of the new debt simply does not work, meaning that significant energy company junk bond defaults will occur. Although this is obviously bad for the energy complex, it also has very real implications for broader systemic risk.
The only saving grace may be that it appears that Crude has entered the final, vertical decline of the crash. A bottom in the $50 range is in no way guaranteed, but it is likely that the low will come in the near future. Notice on the below chart that the current move down started from a June top. Since then, we’ve had no better than a Day 3 Cycle top, showing just how extremely Left Translated recent Cycles have been. The chart also shows how relentless the downward move has been, and the 3 distinct channels it has taken. Within each channel, the declines have taken on a steeper, more vertical aspect, to the point that Crude prices are now near free-fall.

When a market enters into crash mode, there is no way to know where it will bottom. Unlike Crude, the energy producers have, to date, held up relatively well. And recently, they put in a very convincing counter-trend rally at the same time Crude appeared to be finding a bottom. But unless Crude does find a bottom, and quickly, the energy producers will, I believe, be punished with extreme prejudice, as we’ve yet to see “crash-like” selling in many of the names.
As is clear on the below chart, Crude was already deep into the timing band for a Low when energy producers rallied, fooling everyone into believing that a new Cycle was already underway. Normally, a sector rally in equities foretells a new Cycle, especially in an oversold, extended asset. In this case, it was just a vicious trap, a setup for the crash we’re seeing now!

Larger Image
I’ve shown Crude’s sentiment chart a number of times in the past few months, so I know it should be taken lightly when used to discuss Cycle timing. But I’m presenting it again because we now have a situation where sentiment is matching that seen during the massive crash of 2008. There comes a time, even during a bear market, where the market can’t absorb more selling, where it becomes exhausted of sellers. I’m not sure if we’re there yet in Crude, but based on this chart, it’s clearly imminent.

Larger Image
This crash has been a long time in the making, and has seen 6 consecutive months of lower prices without a single instance of back-to-back weekly gains! As a result, we have record low sentiment levels on the heels of the 2nd fastest rate of change (decline) ever recorded. This is a crash, no way around it. The effects on the industry will be long lasting.
As we can see below, price has entered free-fall. Cycle timing is out the window in this sort of scenario, as price can fall almost indefinitely, technically to zero. There is no way of knowing when it will bottom, but of interest is that the 2008 crash also began with a June top and ended with a December low, a 6 month decline. All that we can say with confidence is that the current move down should be very close to finished.

Larger Image

 It’s only 8 a.m. here in New York, but we have had a full day already.
Here’s a super-quick overview of all the crazy things that are happening in markets right now.
- The Russian ruble is collapsing. The ruble fell to as low as 78 against the US dollar and 100 against the euro. This collapse comes after the Russian central bank on Monday night unexpectedly raised interest rates to 17% from 10.5%.
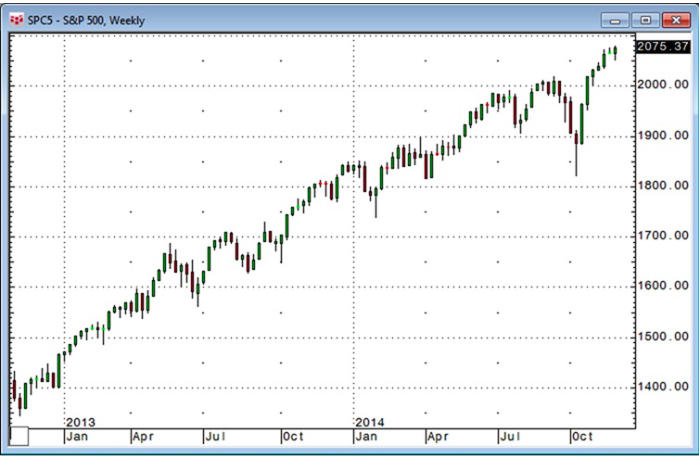
- US futures are down big after trading higher earlier Tuesday morning. Dow futures are down 100 points, S&P 500 futures are down 14, and Nasdaq futures are down 36.
- Bond yields are collapsing. The US 10-year yield fell to as low as 2.01%, while the German 10-year bund fell below 0.6%.
- Oil is still in free fall. West Texas Intermediate crude oil is making new lows, trading near $54.20 a barrel. Brent crude oil also cracked the $60-a-barrel market and traded below $59. Both oil benchmarks are down more than 3%.
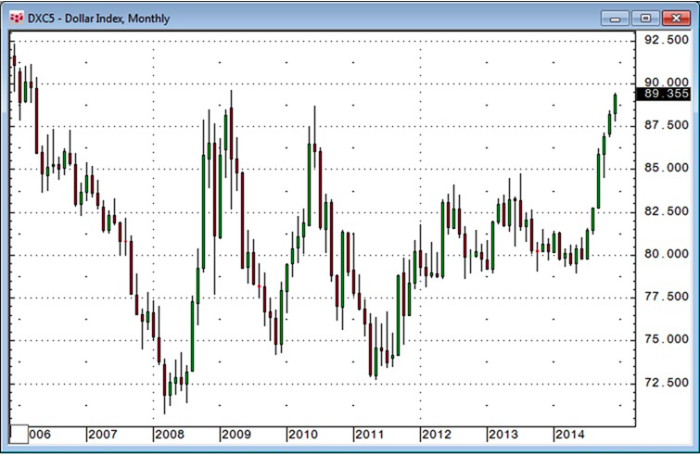
- The dollar is getting whacked. The dollar was falling against the euro, the British pound, and, most notably, the Japanese yen. The dollar was trading at about 116 against the yen after trading as high as 121 last week. This is the yen’s best level against the dollar in more than a month.
- The Norwegian krone is getting annihilated. The Norwegian krone was getting whacked Tuesday, falling to below 7.5 against the dollar and reaching parity — or equal value — with the Swedish krona for the first time since 2000.
This post will be updated as the market story changes throughout the day.
Read more: http://www.businessinsider.com/us-market-update-december-16-2014-12#ixzz3M4WkQk7e

The free-fall in oil prices…WTI down $50 (47%) since June…hit Market Psychology HARD last week…risk aversion soared…credit spreads widened with a vengeance…Treasury yields fell to near All Time Lows…credit risk inspired contagion hit all asset classes…the DJIA…which had closed at a Record All Time High Friday Dec 4…fell 680 pts (3.7%)…creating a Classic Key Reversal Down…closing lower than all FIVE previous weeks!

Crude: WTI closed the week at $57.50…down $50 (47%) from June highs…down $20 (26%) the last 3 weeks….benchmark Canadian Crude (Western Canada Select) traded at a $17.50 discount…at only $40!
NatGas: NYMEX January delivery Nat Gas was $4.65 mid-November…contagion knocked it down 21% in 3 weeks.

Coal: the Market Vectors Coal ETF (overall performance of the global coal industry) closed last week at its lowest since early 2009…down over 70% from 2011 highs…down 25% since August.

The TSE lost 1400 pts (9.25%) the last 3 weeks and is barely positive YTD.
Interest Rates: US Treasury bonds were bid aggressively higher all week…the 10 year closed the week at 2.08% yield…a 2 year low…only a hair away from All Time Lows…Best performing asset 2014? US long term Treasury bonds…up 25%…compared to the S+P 500 up only 8%….BUT…
Junk and High Yield Credit…especially Energy related…got HAMMERED last week…with yields at 3 year HIGHS for the sector…energy yields were worse…credit spreads widened with a vengeance!

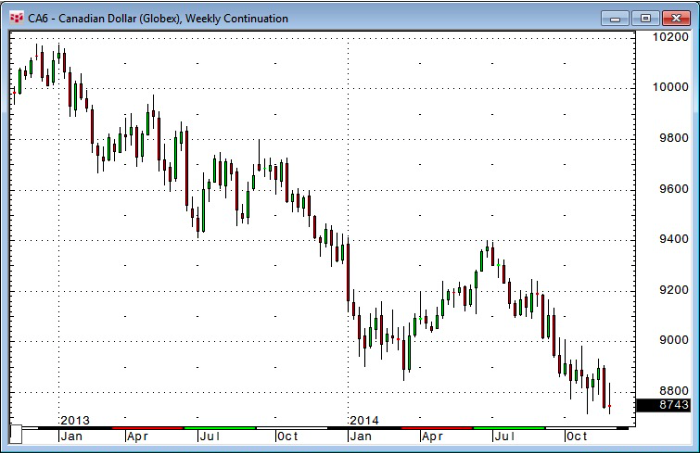
Currencies: CAD closed at 86.40…its lowest since 2009…it takes C$1.155 to buy US$1.00. CAD was 94 cents at the end of June when Crude began to fall…CAD is down only 8% since June…while WTI is down 47%. Other oil producing country currencies are down much more that CAD…CAD in NOT just a “commodity currency” but while Market Psychology is in its current “shoot first and ask questions later” mood CAD will get sold.
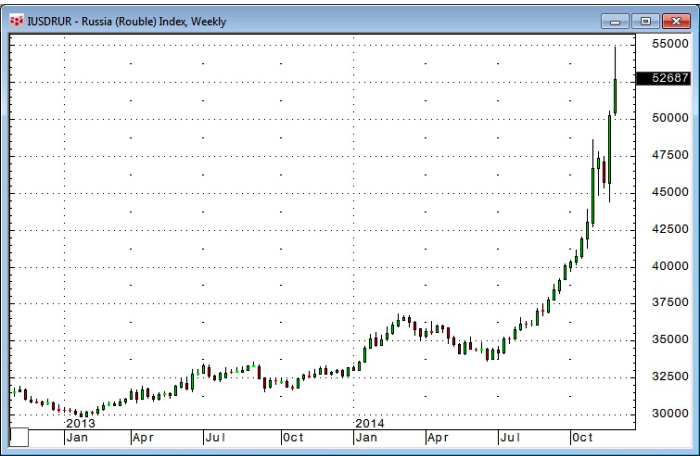
Mexican Peso: Since June the Mexican Peso is down 15%…the Norwegian Krone is down 23%…the Australian Dollar is down 11.5%…the Russian Ruble is down 70%.

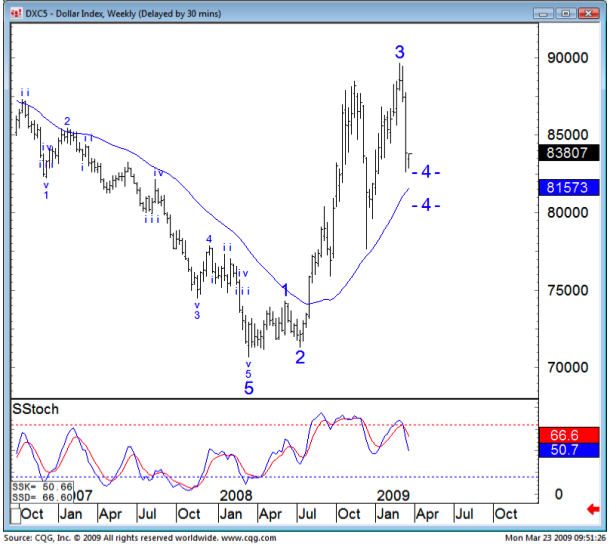
The USD Index weakened ~1% last week as Euro and Yen “bounced”…nearly all other currencies fell Vs. the USD.
Gold: closed last week at 6 week highs…following a very interesting Reversal from the December 1 lows.
Short Term Trading:
We’ve been making US Dollar bullish trades in the currency markets all year. Since early November we’ve been especially shorting (and writing calls against) CAD and AUD futures as commodities generally…and Crude specifically…tumbled. We’ve added to short CAD positions each of the last 2 weeks as CAD weakened past 1.14 and then 1.15. On Friday…as CAD fell to 5 ½ year lows we wrote short-dated OTM puts (profit lock) as IV soared.
We bought gold early December…we were very impressed with the Dec 1 Reversal…we would add if gold rallies above $1250.
We sold short the S+P early last week…added to the position Thursday…then sold very short-dated OTM puts against part of our short position Friday (profit lock) as put values soared with the tumbling stock market.
Trading Perspective:
We expect global deflationary pressures to intensify…inflicting pain on the “Reaching for Yield” trade. We remain USD bulls…USD Cash is King! We are near-term bearish stocks.
With only two weeks left in the year money managers may try to lock in YTD performance by selling or hedging…margin calls and tax-loss selling may create additional pressure…credit market contagion worries will keep Market Psychology risk averse…currency markets may be especially choppy on thin year-end volumes.


 The stunning 40% drop in the price of oil over the past few months has scrambled global economic forecasts, changed the geo-political landscape, and has severely pressured many energy sector investments. Economists are scratching their heads to determine if the drop is good or bad for the economy or whether cheap oil will add to or decrease unemployment, or complicate the global effort to “defeat” deflation. While all of these issues merit detailed discussions, the first question to address is if the steep drop is here to stay and whether energy prices will stay low enough, for long enough, to seriously reshuffle the economic deck. Based on a variety of factors, this is not likely to happen. I believe a series of technical, industrial, and monetary factors will combine to push oil back up to, and potentially beyond, the levels that it has seen over the last few years.
The dominant narrative explaining the current situation is that oil has collapsed largely because the growing mismatch between surging supply and diminishing demand. But there is little evidence to suggest that such conditions exist on the global stage.
Subscribe to Euro Pacific’s Weekly Digest: Receive all commentaries by Peter Schiff, John Browne, and other Euro Pacific commentators delivered to your inbox every Monday!

December 11, 2014
The two big financial news items in December have been the multiple Hindenburg Omen signals and the crash in crude oil prices. I recently went on CNBC to talk about the former. Its relationship to the latter is inescapable.
A Hindenburg Omen occurs when the number New Highs and New Lows on the NYSE both exceed a specified percentage of total issues. See this article for more details. There are other requirements, such as that the NYSE Comp be in an uptrend, and the McClellan Oscillator needs to be negative. Those other criteria are important, because there is no sense getting an omen when you are already in a downtrend, or when the market is too strong to be able to go down. This month we have seen the New Lows list expanding, thanks to the poor performance of multiple issues with the words “resources”, “energy”, or “drilling” in the companies’ names.
So does it really count if the New Lows list is populated mostly by members of a single sector?
That is a really great question, and we are going to see the answer provided over the next several weeks. My assumption is that things would be a lot worse if it were financial stocks instead of energy stocks that were populating the new lows list, since financial stocks are farther up the food chain and thus a more problematic indicator if they start to turn unhealthy.
Still, the Hindenburg Omen has a well-earned reputation for signaling trouble ahead of every major decline. Its problem is that it has also signaled trouble at times that did not lead to calamity, leading to a separate reputation as a wolf-caller indicator. But as the late Jim Miekka liked to point out, an omen is not the same thing as a guarantee of trouble. It is a sign that something is hinky, but not necessarily a sure harbinger of additional trouble. And the more signals that one sees in a short time frame, the more certainty it can offer about trouble to come.
For these latest Hindenburg Omen signals to really bring trouble, they are going to have to fight against positive seasonality, strong breadth numbers, and the positive implications of the 3rd year of a presidential term. Those are a formidable set of forces to have to oppose.
So what does it really mean for the market when oil prices have a big decline? Let’s take a look at history to see what it can tell us. Over the past 4 decades, there have been 4 really big price declines before this latest one:

I would set aside the first Iraq War in 1990-91 and the 2008 Commodities Bubble as separate types of events. The declines in each of those cases originated from unnatural spike highs.
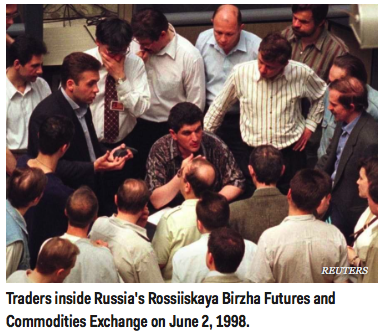
But the declines in 1985-86 and in 1998-99 originated from a flat price structure for oil prices, which was more like the decline we are seeing right now. In each of those prior two cases, the result was fairly bullish for the stock market, notwithstanding a 2-month dip in 1998 that was attributed to Ralph Acampora turning bearish on CNBC in August 1998. So the current oil price decline is more like those two instances.
Many analysts are likening the oil price drop to a big tax cut, with an associated stimulative economic effect. But how much?
According to the Energy Information Agency the U.S. consumed 126 billion gallons of gasoline during the 12 months ending Sep. 2014. So given the drop in RBOB gasoline futures from the top at ~$3.10 in June to $1.64 today, that $1.46 difference would amount to $183 billion over 12 months. That’s just gasoline, and it assumes that today’s price sticks for the long run. It does not include other factors that affect actual prices which consumers pay at the pump.
But if we consider that gasoline is just one of the uses for crude oil, then the savings magnify. According to the EIA data on crude oil consumption, annual U.S. consumption of crude oil during the latest 12 months was 6.9 billion barrels. So the price drop from ~$107/barrel at the June 2014 high to ~$59 today represents a total presumptive savings of $332 billion per year, assuming prices stay exactly here, and that consumption does not change. That is well short of the $85 billion per month that the Fed was doing during the peak of the latest round of QE, but it is not nothing.
So while the FOMC has ended QE, the global crude oil market has presented us with its own form of stimulative easing. Ironically, history shows that the oil market can yank back its own QE faster than the Fed seems to be able to.
From another standpoint, the current oil price decline does indeed have terribly bearish implications for the stock market… for 10 years from now. There is a 10-year leading indication relationship between oil prices and the stock market, as shown in this chart:

The current oil price slide says that sometime around 2024, we can expect to observe some type of “echo” in stock prices from this year’s oil price drop. I am not sure why this relationship exists in this way, with stock prices echoing oil price movements with a 10-year lag. But after seeing that it has “worked” for over 100 years, at some point we can say that there is enough evidence to accept it, even if we cannot explain it.
For now, the message of this leading indication is that the oil price rally from 1998 to 2008 has yet to see the full extent of its echo during the 2009-2018 period. While the current dip in oil prices is going to be bad for stock prices about 10 years from now, it is not really a problem for stock prices in real time. So any worries that investors express over this oil price decline represent an opportunity for us to take advantage of irrational fears over the oil price collapse.
Tom McClellan
Editor, The McClellan Market Report
Related Charts


-
I know Mike is a very solid investor and respect his opinions very much. So if he says pay attention to this or that - I will.
~ Dale G.
-
I've started managing my own investments so view Michael's site as a one-stop shop from which to get information and perspectives.
~ Dave E.
-
Michael offers easy reading, honest, common sense information that anyone can use in a practical manner.
~ der_al.
-
A sane voice in a scrambled investment world.
~ Ed R.
Inside Edge Pro Contributors

Greg Weldon

Josef Schachter

Tyler Bollhorn

Ryan Irvine

Paul Beattie

Martin Straith

Patrick Ceresna

Mark Leibovit

James Thorne

Victor Adair