
Bonds & Interest Rates
This analysis is assembled to paint a picture of the current Global Financial condition. The first article “These Are Astonishing Figures, Evidence Of A 1930s-Style Depression” can be found HERE or click the chart below – Editor Money Talks

….then there is this:
The Case for Gold in One Chart
The purpose of this paper is not to make the case for investing in precious metals (plenty has already been written on this topic), but rather to lay out the options available to the investors who has made up his mind to do so.
Before going into any great detail, let’s pause for a moment to take a helicopter view of our financial system in order to better understand gold’s position in it. Most people are well aware that gold is a scarce resource but are usually not aware of the sheer volume of other financial products which currently exist. The following chart provides an overview of our financial system and lays the case for gold quite succinctly.

 A financial meltdown would see the upper layers of the pyramid being liquidated in a panic that would likely involve the opaque over-the-counter derivatives markets. A few of the world’s largest banks hold the bulk of all derivative contracts, which have notional amounts in the 10s of times their assets and 100s of times their market capitalizations.
Whilst the upper layers evaporate as the market for most IOUs simply stops existing, capital will seek refuge in the “most marketable good” or the most liquid asset further down the pyramid. Many people holding assets located at the top of the pyramid will lose parts of their capital on the way down in the flight to liquid and to less-risky assets. After most of their wealth literally has evaporated, they will finally come to the conclusion that gold is the ultimate store of value.
A look at recent history reminds us of the intrinsic value of paper money, which is the paper that it is printed on. One picture in support of this case is certainly worth a thousand words.
“Paper money eventually returns to its intrinsic value – zero.” ~ Voltaire
Download the complete paper: ![]() How to Own Precious Metals
How to Own Precious Metals

 Louis Gave is one of my favorite investment and economic thinkers, besides being a good friend and an all-around fun guy. When he and his father Charles and the well-known European journalist Anatole Kaletsky decided to form Gavekal some 15 years ago, Louis moved to Hong Kong, as they felt that Asia and especially China would be a part of the world they would have to understand. Since then Gavekal has expanded its research offices all over the world. The Gavekal team’s various research arms produce an astounding amount of work on an incredibly wide range of topics, but somehow Louis always seems to be on top of all of it.
Longtime readers know that I often republish a piece by someone in their firm (typically Charles or Louis). I have to be somewhat judicious, as their research is actually quite expensive, but they kindly give me permission to share it from time to time.
This week, for your Outside the Box reading, I bring you one of the more thought-provoking pieces I’ve read from Louis in some time. In Thoughts from the Frontline I have been looking at world problems we need to focus on as we enter 2015. Today, Louis also gives us a piece along these lines, called “The Burning Questions for 2015,” in which he thinks about a “Chinese Marshall Plan” (and what a stronger US dollar might do to China), Abenomics as a “sideshow,” US capital misallocation, and whether or not we should even care about Europe. I think you will find the piece well worth your time.
Think about this part of his conclusion as you read:
Most investors go about their job trying to identify ‘winners’. But more often than not, investing is about avoiding losers. Like successful gamblers at the racing track, an investor’s starting point should be to eliminate the assets that do not stand a chance, and then spread the rest of one’s capital amongst the remainder.
Wise words indeed.
A Yellow Card from Barry
What you don’t often get to see is the lively debate that happens among my friends about my writing, even as I comment on theirs. Barry Ritholtz of The Big Picture pulled a yellow card on me over a piece of data he contended I had cherry-picked from Zero Hedge. He has a point. I should have either not copied that sentence (the rest of the quote was OK) or noted the issue date. Quoting Barry:
Did you cherry pick this a little much?
“… because since December 2007, or roughly the start of the global depression, shale oil states have added 1.36 million jobs while non-shale states have lost 424,000 jobs.”
I must point out how intellectually disingenuous this start date is, heading right into the crisis – why not use December 2010? Or 5 or 10 years? This is misleading in other ways:
It is geared to start before the crisis & recovery, so that it forces the 10 million jobs lost in the crisis to be offset by the 10 million new jobs added since the recovery began. That creates a very misleading picture of where growth comes from.
We have created 10 million new jobs since June 2009. Has Texas really created 4 million new jobs? The answer is no.
According to [the St. Louis Fed] FRED [database]:
PAYEMS – or NFP – has gone from 130,944 to 140,045, a gain of 9,101 over that period.
TXNA – Total Nonfarm in Texas – has gone from 10,284 to 11,708, for a gain of 1,424.
That gain represents 15.6% of the 9.1MM total.
Well yes, Barry, but because of oil and other things (like a business-friendly climate), Texas did not lose as many jobs in the recession as the rest of the nation did, which is where you can get skewed data, depending on when you start the count and what you are trying to illustrate.
My main point is that energy production has been a huge upside producer of jobs, and that source of new jobs is going away. And yes, Josh, the net benefit for at least the first six months until the job non-production shows up (if it does) is a positive for the economy and the consumer. But I was trying to highlight a potential problem that could hurt US growth. Oil is likely to go to $40 before settling in the $50 range for a while. Will it eventually go back up? Yes. But it’s anybody’s guess as to when.
By the way, a former major hedge fund manager who closed his fund a number of years ago casually mentioned at a party the other night that he hopes oil goes to $35 and that we see a true shakeout in the oil patch. He grew up in a West Texas oil family and truly understands the cycles in the industry, especially for the smaller producers. From his point of view, a substantial shakeout creates massive upside opportunities in lots of places. “Almost enough,” he said, “to tempt me to open a new fund.”
On a different note, everyone is Christmas shopping and trying to find the right gift. Two recommendations. First, the Panasonic wet/dry electric razor (with five blades). I just bought a new set of blades and covers for mine after two years (you do have to replace them every now and then); and the new, improved shave reminded me how much I was in love with it when I bought it. Best shaver ever.
Second, and I know this is a little odd, but for a number of years I’ve been recommending a face cream that contains skin stem cells, which I and quite a number of my readers have noticed really helps rejuvenate our older skin. (I came across the product while researching stem-cell companies with Patrick Cox.) It clearly makes a difference for some people. I get ladies coming up all the time and thanking me for the recommendation, and guys too sometimes shyly admit they use it regularly. (It turns out that just as many men buy the product as women.) The company is Lifeline Skin Care, and they have discounted the product for my readers. If you can get past the fact that this is a financial analyst recommending a skin cream for a Christmas gift, then click on this link.
It is time to hit the send button. I trust you are having a good week. Now settle in and grab a cup of coffee or some wine (depending on the time of day and your mood), and let’s see what Louis has to say.
Your trying to catch up analyst,
John Mauldin, Editor
Outside the Boxsubscribers@mauldineconomics.com


Well it didn’t take long to realize that falling crude oil is not an overall blessing.
The business, financial and academic world has become addicted to chronic inflation. What’s more, they even grant doctorates in currency depreciation and interest rate manipulation. Rumours that PhD’s in central banking can be obtained through correspondence school seem unverifiable.
By “inflation” we use the classic definition which is an “inordinate expansion of credit”. And this is associated with soaring prices for tangible and/or financial assets. Problem is consumer prices. This goes all the way back to the mid-1920s when the Fed was the “new” toy for intellectuals to experiment with. Impressed by the the post-1920 crash in commodities, they were deliberately “easy” with credit to prevent commodities from falling further. After getting burned in commodities, the public chose to speculate in financial assets. And then stayed beyond when it was time to sell.
The mania for hoarding tangible assets, then hoarding of financial assets has always been followed by hoarding of cash and/or gold.
Cash has been taking on value relative to most commodities since 2011, junk bonds since June and the S&P since Friday.
Gold has been taking on a lot of real value since its cyclical low against commodities in June. Our Gold/Commodities Index has rallied from 328 in June to 420.
These are common features of a post-boom contraction.
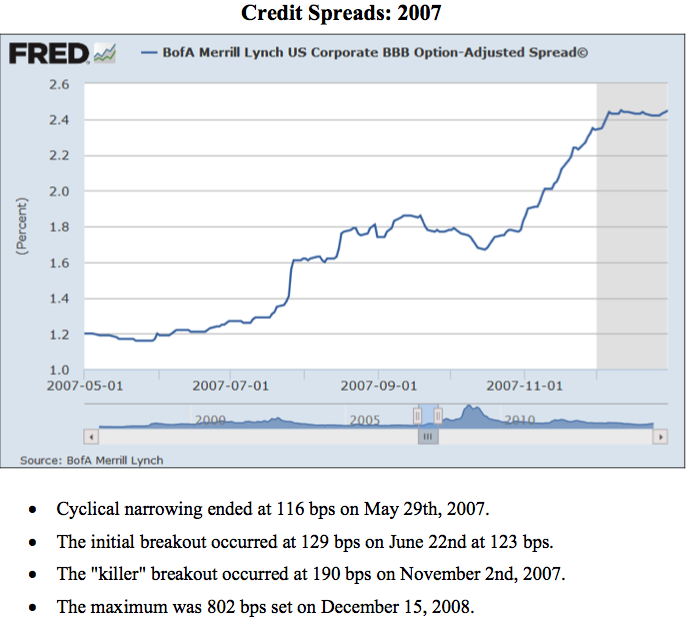
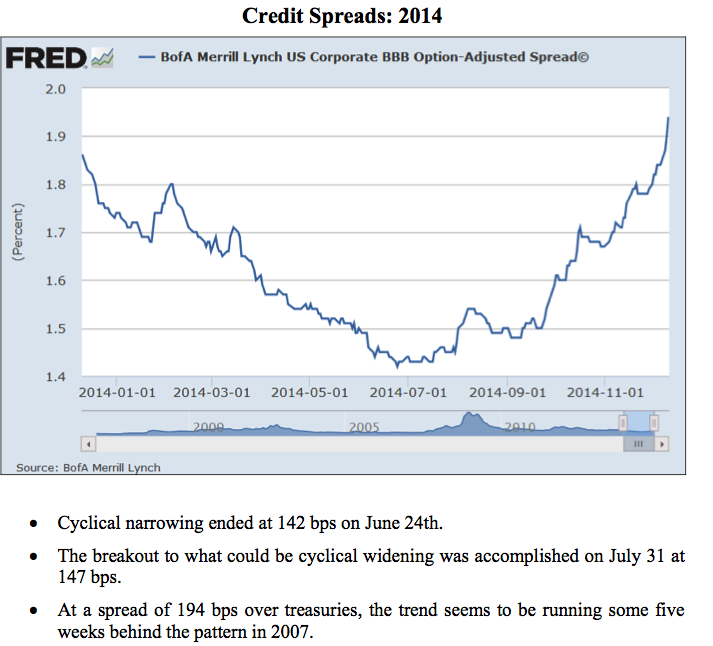
Others are the reversal from narrowing credit spreads () and the reversal from curve flattening to steepening (Tuesday ?).
Since it opened its doors in 1914 the Fed has never been able to prevent overdone credit markets from reversing to adversity. That’s when the time is right and that seems now.
Credit Markets
The action in spreads this week has been riveting, with JNK/TLT dropping 2 percent yesterday. It has taken out the low reached in the October setback and is back to the levels of late 2012.
Junk has been bid down to an oversold reading. HYG is not there.
The chart of BBB spreads relative to treasuries follows. Narrowing with the boom reversed in June and with a number of corrections widening is the trend. It seems to be running a month or so behind the turn in 2007. Also, it seems to be about 50 bps behind in yield.
Treasuries have been vigorously bid up to an overbought condition.
The spike high set with the unusual loss of liquidity in mid-October was 147.75. That was in the December contract and it has rallied from 141.11 in early November to the 145 level. A test of that high has been needed.
Overall, the rally from 127.35 a year ago has driven the Weekly RSI from 30 to 72. The last time it was this high was on the rally that topped at 152 in June 2012.
The best is as good as in and it looks like ending action.
This could apply to the European bond market as well.
The German yield has declined from 1.95% a year ago to 0.66% earlier today.
On the same move, the Spanish yield has declined from 4.24% to 1.79% on Monday. It has increased to 1.89%.
The Greek yield declined from 8.84% to 5.54% in September. It surged to 8.98% in October and declined to 7.24% on December 4th. Today it is breaking above 9.00% and this is concerning. The chart follows.
If the former Soviet Union had issued bonds what yield would they have traded at in 1981 when those for the US reached 15 percent? Interesting, but useless conjecture.
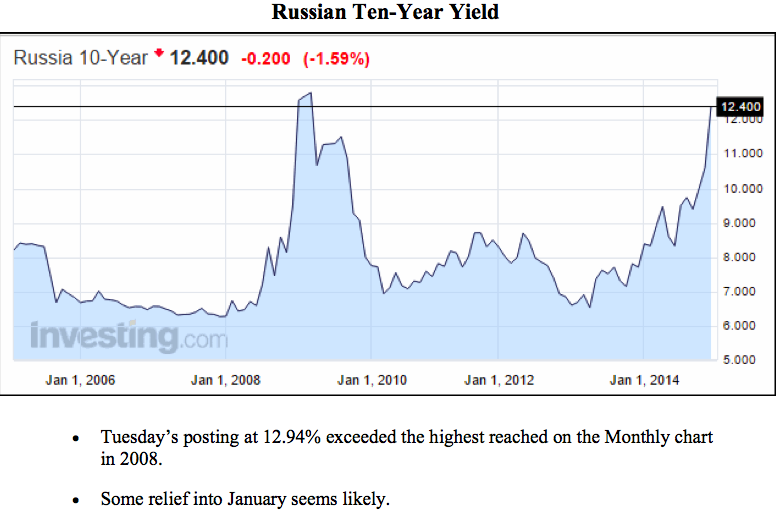
Those for the Neo-Soviet Union soared to 12.79% in 2008 and then declined to 6.53% in 2013. This reached 12.95% on Tuesday, which exceeds the monthly number reached with “The Panic”. The chart follows.
We have not seen any official boasts that the Russian problem can be “Contained”.
Back to the US and as measured by 2s to 10s yield ratio, flattening has run for some 12 months with the Daily RSI making a big swing to overbought. Often booms have run some 12 to 18 months against a flattening curve and the reversal marks the end of the boom. We are watching this one for change.
The action in credit markets has become concerning.
Commodities
Grains (GKX) continue to act well and remain our favourite in this department. At the low of 290 in October it was just as oversold as it was overbought at 424 in May. The high this week has been 330 at neutral momentum.
Base metal prices (GYX) rallied from the October low of 339 to 359 a couple of weeks ago. The hit at the end of November took out the 50 and 200-Day moving averages. The low was 340 and the bounce was to the 50-Day at 350. Now it is at 341 and not oversold.
What’s more, Ross has a chart showing copper moves relative to a “coiled” Bollinger Band Width. The resolution will likely be to the downside.
Iron ore prices continue to decline. The high with the cyclical peak in metals in 2011 was 184, the low in October on the big Monthly chart was 80.09. The December contract is at 69.66 today.
Ron Griess, the genial proprietor of the ChartStore, has a thorough perspective on any number of charts. The update on the big swings in crude’s deflated price shows that significant declines have been in the order of 70 + percent. The chart follows.
Our review of crude oil crashes noted that they ran for some six to seven months. The conclusion of forced selling counts out to around January.
The outlook for most commodities remains bleak.
Precious Metals
Gold’s real price as determined by our Gold/Commodities Index continues to advance from its bottom at 328 in June. This has driven it to new highs for the move (420) and the following updated chart adds conviction to our call that this has been a cyclical bull market.
Keep in mind that the more crude falls relative to gold, the more profitable gold mining becomes. Also, the more base metals decline relative to gold the less profitable base metal mining becomes.
This will keep a lid on wages and on the cost of mine supplies. We are told that after years of scarcity, big tires are again readily available.
Our advice last week was to begin to commit some funds to the sector.
Link to December 12 Bob Hoye interview on TalkDigitalNetwork.com:
http://talkdigitalnetwork.com/2014/12/gold-silver-more-attractive-as-oil-declines/


The cyclical bull market for gold’s real price will, in time, pull the gold shares into a new bull market.

BOB HOYE, INSTITUTIONAL ADVISORS
E-MAIL bhoye.institutionaladvisors@telus.net
WEBSITE: www.institutionaladvisors.com
*Update: While this analyst remained short this morning after initiating a successful short position on the S&P 500 from 2,038 (November 12th). You can see that after the index traded in the low 1960’s tuesday/wednesday showing substantial profits, and the analyst reduced his stop from 2085 to 2025 which allowed the position to have been stopped out with a profit today. – Editor Money Talks
Briefly: In our opinion, speculative short positions are favored (with stop-loss at 2,025 and profit target at 1,950, S&P 500 index).
Our intraday outlook remains bearish, and our short-term outlook is bearish:
Intraday (next 24 hours) outlook: bearish
Short-term (next 1-2 weeks) outlook: bearish
Medium-term (next 1-3 months) outlook: neutral
Long-term outlook (next year): bullish
The U.S. stock market indexes gained between 1.7% and 2.0% on Wednesday, retracing some of their recent move down, as investors reacted to FOMC Rate Decision release, among others. The S&P 500 index bounced off support level at around 1,970-1,975, marked by Tuesday’s daily low. It has returned above the level of 2,000, which is positive. The nearest important level of resistance is at around 2,025-2,035, marked by some previous local lows, as we can see on the daily chart:

Expectations before the opening of today’s trading session are positive, with index futures currently up 1.1-1.3%.
The main European stock market indexes have gained 1.0-2.5% so far. Investors will now wait for some economic data announcements: Initial Claims at 8:30 a.m., Philadelphia Fed number, Leading Indicators at 10:00 a.m. The S&P 500 futures contract (CFD) is in an intraday uptrend, as it trades considerably higher this morning. The nearest important level of support remains at around 2,000-2,010. On the other hand, possible resistance level is at around 2,050, marked by some previous local extremes, as the 15-minute chart shows:

The technology Nasdaq 100 futures contract (CFD) follows a similar path, as it remains in an intraday uptrend. The nearest important support level is at 4,180-4,200. For now, it looks like a correction within a short-term downtrend, however a positive downtrend reversal scenario cannot be excluded here:

Concluding, the broad stock market bounced off support level, as the S&P 500 index continued to fluctuate along the level of 2,000 yesterday. Expectations before the opening of today’s trading session are very positive, however, we still continue to maintain our short position with entry point at 2,038 (November 12th opening price of the S&P 500 index). Stop-loss is at 2,025 and potential profit target remains at 1,950 (S&P 500 index). It is always important to set some exit price level in case some events cause the price to move in the unlikely direction. Having safety measures in place helps limit potential losses while letting the gains grow.
Thank you.


-
I know Mike is a very solid investor and respect his opinions very much. So if he says pay attention to this or that - I will.
~ Dale G.
-
I've started managing my own investments so view Michael's site as a one-stop shop from which to get information and perspectives.
~ Dave E.
-
Michael offers easy reading, honest, common sense information that anyone can use in a practical manner.
~ der_al.
-
A sane voice in a scrambled investment world.
~ Ed R.
Inside Edge Pro Contributors

Greg Weldon

Josef Schachter

Tyler Bollhorn

Ryan Irvine

Paul Beattie

Martin Straith

Patrick Ceresna

Mark Leibovit

James Thorne

Victor Adair