
Timing & trends

If founder Elon Musk is right, Tesla Motors just might reinvent the American auto industry—with specialized robots building slick electric cars in a factory straight from the future. That’s where the battery-powered Model S is born.
Currently it takes 3-5 days to go from raw material to a completed car, and during that period only 4 humans are involved in its manufacture. All else is done by robots.

 The gold and silver stocks have put in a bullish weekly reversal but gold and silver have not confirmed it. The interplay between the metals and the shares has been complicated in recent weeks.
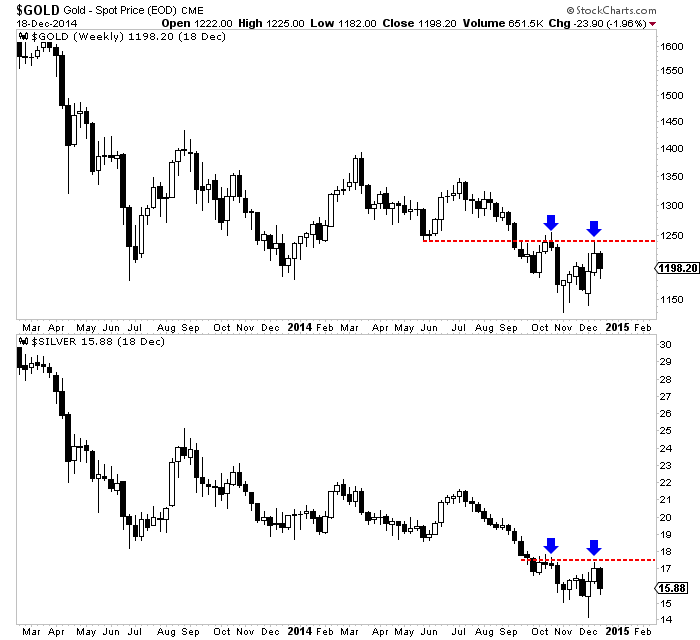
Gold and silver are charted below in weekly candle format. Before this week the metals looked bullish. Each tested support and rebounded strongly towards resistance. However, both metals gave back much of the recent gains. Bulls would say they are correcting and still in position to test resistance. Bears would say the metals failed to reach resistance and are headed to new lows.
Though the mining stocks are selling off today (Friday), they’ve completed a bullish reversal and double bottom on most weekly charts. Below we plot GDXJ, GDX and our Top 40 index. Other than GDXJ just about every miner index has completed a double bottom. Though GDXJ made a new low it did form a bullish reversal. GDX and the Top 40 index formed bullish hammers and potential double bottoms. We say “potential” double bottoms for a reason. The double bottom is a very bullish pattern in which the market should explode up from the second bottom. Only time will tell if the miners follow that path or if the reversal fizzles.
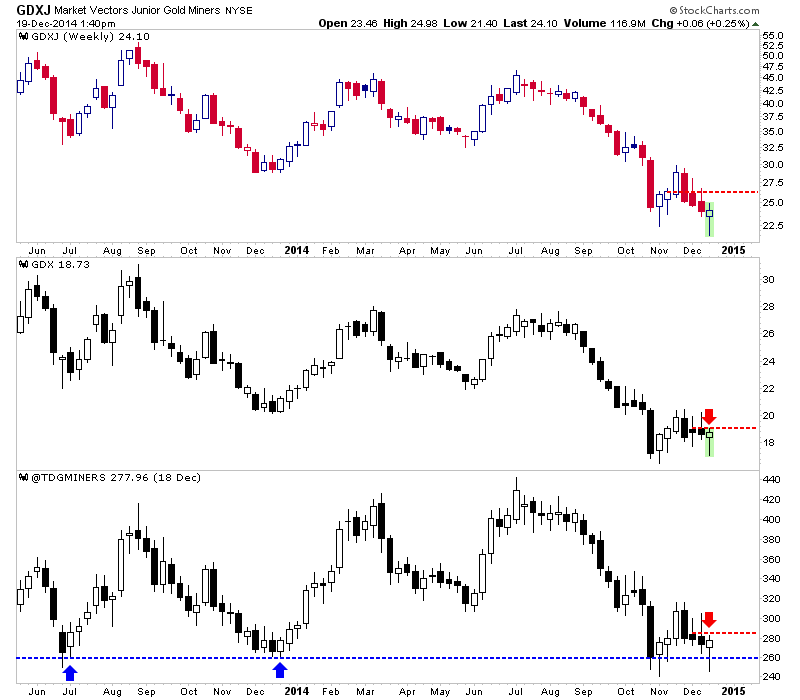
Interestingly, the metals and the miners have been disjointed in recent weeks. Gold lost 2% this week while Silver lost 6% yet the miners put in a positive reversal. During the two prior weeks metals rebounded strongly yet miners sold off. Part of that could be tax loss selling in the miners which has created additional weakness.
Investors and traders have a good setup in the miners. Downside support is defined by the double bottom. A weekly close below that could be the stop out point and would limit losses. Meanwhile, if the metals are destined to take out their October highs then the miners should explode higher sooner rather than later. After 2013 tax loss selling, GDXJ rebounded over 50% within two months. We are working hard to prepare subscribers for this opportunity.
The Daily Gold

Market Analysis plus Simple Strategies to Employ When Buying Stocks – Editor Money Talks
The TSX Composite Index closed the week at 14,468 points, up a solid 5.7% after 4 straight days of gains. This week’s partial recovery was a welcome sigh of relief to investors who nervously watched the market shed almost 10% of its value in the 3 week period ending last Monday.
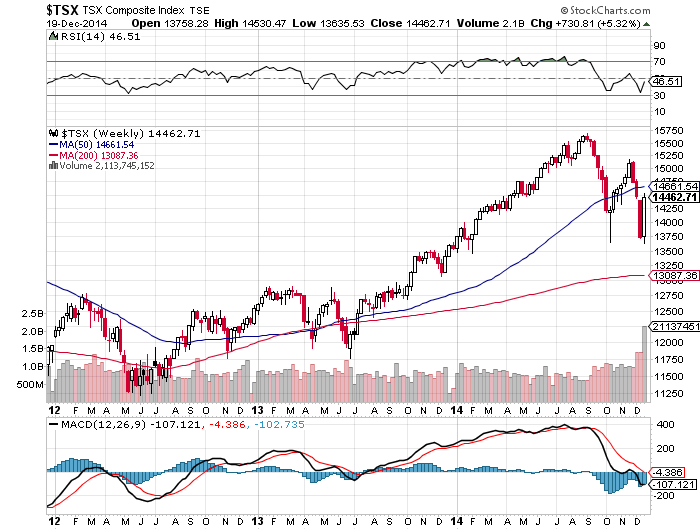
Click on the image for the more dramtic Daily Chart
But before investors get too complacent let’s remind ourselves that we are not out of the woods yet. The culprits that
brought on this malaise were low energy prices coupled with a weak outlook for global growth. It may be the case that the former will help to bolster the latter as few things are more economically simulative as a big drop in energy prices. But at least in Western Canada the economic wagon is firmly tied to the price of oil which has yet to offer a clear sign it has stabilized.
But consumers at least are benefiting from a quasi-tax break at the pump with the average gasoline price in Canada declining below a dollar to $0.99 per liter for the first time in 4 ½ years. This is a far cry from just a few months ago when the average price was over $1.30 per litre. Over the course of a year, many analysts suggest that this can result in savings of $1,000 to $2,000 per family. Time to max out those TFSA contributions!
One of the issues that we have had with the Canadian stock market and economy in general is that it is too focused on resource related sectors. Energy alone accounts for nearly 25% or ¼ of the entire TSX Composite index. With mining and materials accounting for another 9%, we have nearly 35% of our top stock exchange weighted to the two most cyclical industries in the world. Technology on the other hand (an industry which we should be focused on growing) accounts for a measly 2%. This is compared to a technology weighting of 20% for the S&P 500 in the U.S. Clearly our capital markets and economy needs to diversify and it is times like these when this concept really hits home.
——–
Simple Strategies to Employ When Buying Stocks
1. Build your Portfolio Gradually over Time: There is a general tendency for the investor to want to put all of their capital to work immediately. We strongly advise against rushing in and becoming fully invested right away. Our opinion is that it is usually better to take 6 to 18 months to build a portfolio if you are starting from scratch. Taking this time allows you to keep some capital available to purchase new recommendations that come out over the course of the year. Spreading the portfolio building process also mitigates the risk of short-term market volatility and gives you the opportunity to purchase attractively priced stocks during market bottoms.
2. Buy Businesses with Recession Resistant Qualities: This is a theme that has always been a key ingredient of our investment philosophy. With the threat of economic contraction always looming, it is advisable to build your portfolio around a core of recession-resistant businesses. These can be conventional industries with recession resistant traits such utilities and infrastructure, or it could be a special situation company that occupies a valuable niche position in an attractive market.
3. Buy Strong Balance Sheets: This is another theme that has remained core to our strategy. We continue to favour companies with strong financial positions. An ideal situation would be a company with a significant cash balance and little to no debt. Not only does that cash provide a protective buffer for the company in the event of a downturn but can also be employed to purchase “on sale” assets during periods when competitors are having difficulty accessing capital. Realistically, companies that operate in highly capital-intensive industries will utilize debt in the capital structure (and utilize it well) and may find avenues to invest excess cash as soon as it is generated. The objective as an investor is to ensure that you are not buying a company that is leveraged with debt which makes it more susceptible to economic and market contractions.
4. Diversify by Sector: Try to avoid accumulating too many stocks that operate in the same (or similar industries) sectors or are dependent on the same geographies. Within your 8 to 12 stock portfolio, you will have room to diversify into a multitude of different industries and geographies. Companies that operate in the same industry (and often geography) are exposed to many of the same risks. Diversifying provides significant risk management to your portfolio.
5. Don’t Be Afraid to Layer into Positions: Just as we recommended that you build your total portfolio over time, it is sometimes prudent to build positions in individual stocks over time. For example, if you plan to purchase a total of $10,000 of shares in a single stock, you can break that position up into two or more separate purchases. This can help you to mitigate risk and benefit from volatility that occurs through the year. Individual reports provide specific instructions in this regard when appropriate (such as “BUY HALF” recommendations).
11/28/2014
NATIONAL AND INTERNATIONAL WIRELESS RETAILER GLENTEL RECEIVES 121% TAKEOVER BID FROM BCE INC. – SELL

Today’s videos:
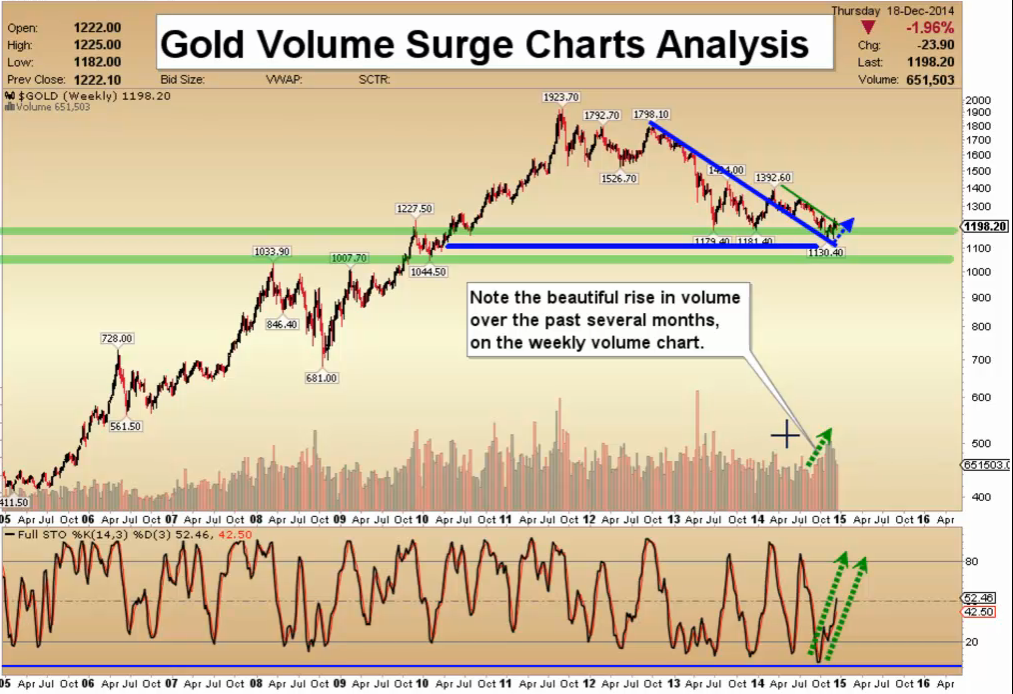
Gold Volume Surge Charts Analysis
Silver Short Term Buy Signal Charts Analysis
FXI Century Of China Charts Analysis
GDX Happy New Year Charts Analysis
GDXJ Bull Wedge Charts Analysis
Thanks,
Morris
Super Force Signals special offer for Money Talks Readers:
Send an email to trading@superforcesignals.com and I’ll send you 3 of my next Super Force Surge Signals free of charge, as I send them to paid subscribers. Thank you!
The SuperForce Proprietary SURGE index SIGNALS:
25 Surge Index Buy or 25 Surge Index Sell: Solid Power.
50 Surge Index Buy or 50 Surge Index Sell: Stronger Power.
75 Surge Index Buy or 75 Surge Index Sell: Maximum Power.
100 Surge Index Buy or 100 Surge Index Sell: “Over The Top” Power.
Stay alert for our surge signals, sent by email to subscribers, for both the daily charts on Super Force Signals at www.superforcesignals.com and for the 60 minute charts at www.superforce60.com
About Super Force Signals:
Our Surge Index Signals are created thru our proprietary blend of the highest quality technical analysis and many years of successful business building. We are two business owners with excellent synergy. We understand risk and reward. Our subscribers are generally successfully business owners, people like yourself with speculative funds, looking for serious management of your risk and reward in the market.
Frank Johnson: Executive Editor, Macro Risk Manager.
Morris Hubbartt: Chief Market Analyst, Trading Risk Specialist.
website: www.superforcesignals.com
email: trading@superforcesignals.com
email: trading@superforce60.com
SFS Web Services
1170 Bay Street, Suite #143
Toronto, Ontario, M5S 2B4
Canada

BIG PICTURE – The world’s prominent central banks are pursuing an accommodative monetary policy and this bodes well for the stock market. Remember, when it comes to investing, monetary policy trumps everything else and the risk free rate of return determines the value of every asset. When interest rates are low and credit is cheap and plentiful, asset prices tend to inflate. Conversely, when interest rates are high and credit is tight, asset prices tend to deflate.
At present, the world’s largest economy is healing and its central bank is maintaining the Fed Funds Rate at a historic low. After several years of deleveraging, American households are borrowing again (Figure 1) and this is stimulating business activity. Although the US unemployment rate has fallen significantly over the past year, inflationary pressures are well contained and this implies that the Federal Reserve will not raise interest rates anytime soon.
If our assessment is correct, the US economy is currently in a sweet spot (just enough growth and lack of inflationary pressures) and if its housing market continues to appreciate, it will unleash tremendous pent-up demand. After all, American households have deleveraged for several years and by doing so, they have postponed the purchase of big ticket items. However, it appears as though they are now beginning to open up their wallets again and this shift in sentiment is benefiting the cyclical industries. For instance, it was recently reported that America’s auto sales have now jumped to levels not seen since 2003! In addition to buying new vehicles, Americans are refurbishing their homes, upgrading their properties, travelling more and spending more money on discretionary items.
Figure 1: US Households are borrowing again!

This shift in sentiment and perception is very bullish for business activity and over the following 2-3 years, it is probable that credit growth in the US will accelerate. If that happens, it will bring about an unprecedented economic boom which will not only benefit the US but the entire world economy.
Make no mistake, when Americans consume more, it will benefit many producing/exporting nations in the developing world and also help European exporters. So, the ongoing economic recovery in the US can only be positive for global growth.
Over in Europe, the situation is still unsatisfactory but even here; we believe that the continent has already passed the point of no return. If anything, we suspect that the European economic recovery is still in its infancy and additional monetary ‘stimulus’ from the European Central Bank (ECB) should bring about a shift in sentiment.
In any event, the ECB has already stated that it wants higher inflation in the Eurozone and it has recently started purchasing assets. Although anything can happen, we believe that if needed, the ECB will commence a full-scale QE program of buying sovereign bonds.
Over in Asia, the Bank of Japan (BOJ) is aggressively easing and the recent negative GDP-print will only bring about more ‘stimulus’. Although additional easing may not benefit the real economy, it will certainly devalue the Japanese Yen and boost the stock market.
If you review Figure 2, you will observe that over the past year, the Japanese currency has depreciated significantly against the US Dollar. At present, the Japanese Yen is trading beneath the key moving averages and it appears as though the path of least resistance remains down.
Figure 2: Japanese Yen – heading south?

Elsewhere in Asia, the Chinese authorities have recently cut interest rates; consequently, the Shanghai Composite Index has staged an impressive rally! Furthermore, it is rumoured that the People’s Bank of China (PBOC) may also unveil a cut in the banks’ minimum reserve requirements, so this may provide more fuel to the raging fire!
It is notable that unlike the other stock markets, Chinese equities have been in a relentless downtrend for 7 years, which is a very long time for any bear market. Moreover, due to the lengthy bear market, Chinese stocks are currently trading at depressed valuations; so the stage is now set for a powerful primary bull market.
Veteran investors may recall that before the bust in late 2007, the Shanghai Composite Index appreciated by approximately 600% in just over 2 years! So, given this history, it is conceivable that after a 7-year bear market, we may get an epic primary uptrend.
If you review Figure 3, you will note that after a huge consolidation phase, the Shanghai Composite Index has just broken out to a multi-year high. Although nothing is set in stone, these sorts of breakouts from lengthy base formations are usually followed by powerful moves and it appears as though the bear market low is now in the rear view mirror.
Bearing in mind the above, we have recently allocated some capital to China’s A-shares and it is our belief that this position will provide good returns over the following year.
Look. There can be no doubt that China’s housing market remains grossly overvalued and undoubtedly, mean reversion will occur at some point in the future. However, in the meantime, if the Chinese authorities embark on a massive easing program, then it is probable that the housing bubble will get even bigger! More importantly, monetary easing will surely have a positive impact on China’s stock market.
Figure 3: Shanghai Composite Index (daily chart)

Looking back at Wall Street, it is noteworthy that the major indices have climbed to all-time highs and this is good news for global equities. Remember, Wall Street is the most influential stock market in the entire world and its primary trend sets the tone for the other regions.
In terms of technical data, we are pleased to report that all the major data points that we monitor are aligned in a bullish manner and even the NYSE Advance/Decline Line has recently climbed to a new high; implying that the stock market breadth remains strong. Historically, the NYSE Advance/Decline Line has always peaked several months before the end of the bull market so this recent strength bodes well for the primary uptrend in common stocks.
As far as the favourable sectors are concerned, it is interesting to note that the cyclical sectors are performing well and doing better than the broad market. For instance, airlines, asset managers, auto dealers and parts manufacturers, credit cards, home builders, home improvement retailers, industrials, railways, restaurants, retailers and travel related counters are showing impressive strength! Elsewhere, biotechnology, consumer staples and healthcare stocks are also showing strength and we recommend exposure to these industry groups.
Conversely, energy, materials and precious metals stocks are underperforming the broad market by a wide margin and until the trend reverses, they should be avoided.
In the context of the broad stock market, you will recall that we had recently highlighted the weakness in the small-cap counters and the growth stocks. Despite the fact that the major indices were climbing to new highs, the growth stocks were not confirming the bull-run and this was an area of concern.
If you review Figure 4, you will note that the Russell 2000 Growth Index had fallen sharply during autumn and it had briefly dipped below its spring low. Fortunately, this index has staged an impressive rebound and it is now sitting comfortably above the key moving averages; thereby opening up the possibility of additional gains.
If the ongoing primary uptrend is strong and sustainable, then over the following weeks, the Russell 2000 Growth Index must appreciate further and take out its spring high. If that happens, new life will be injected into the stock market and the last bearish divergence will also disappear. So, this is one area we will continue to monitor closely.
Figure 4: Russell 2000 Growth Index (daily chart)

Bearing in mind the above, we have allocated our equity portfolio to some of the leading stocks in the strong sectors and this strategy is well positioned to profit from the primary uptrend.
Looking at geographical exposure, we continue to overweight and recommend the developed world (Europe, Japan and the US); although we also see potential in China’s and India’s stock markets. Accordingly, we have invested our fund portfolio in our preferred investment themes (geographical areas and sectors).
PRECIOUS METALS – Whether you like it or not, precious metals are in a multi-year bear market and the path of least resistance remains down.
You will recall that the prices of both gold and silver peaked in 2011 and over the past 3½ years, they have drifted lower. For sure, the southbound journey has been punctuated by consolidations and the periodic relief rallies, but the primary trend has been down.
From a fundamental perspective, the macro-economic environment (recovery in the West and low inflation) is no longer conducive towards the metals and the strengthening US Dollar is an additional problem for the gold bugs. Similar to commodities, precious metals are also denominated in US Dollars and they are inversely correlated to the price fluctuations in the greenback. So, if the US Dollar continues to appreciate over the following months, then it is conceivable that the prices of precious metals will weaken further.
If you review Figure 5, you will note that during autumn, the price of gold sliced through last summer’s low and by doing so, it reasserted its primary downtrend. Recently, the price of gold has firmed a bit but we suspect this is a counter-trend rally which will soon fizzle out.
Figure 5: Gold (weekly chart)

Turning to silver, it is noteworthy that its price has also sliced through last summer’s low and it is still trading beneath that level. Although the price of silver has already fallen significantly from the bull market top of US$50 per ounce, we suspect that the white metal will eventually trade below US$10 per ounce. After all, silver is merely a high-beta play on gold and the ongoing bear market in the yellow metal should weigh heavily on this volatile beast.
If our assessment proves to be correct, then the mining industry will have to endure a chilling, deflationary winter which will bring about the bankruptcy of many junior outfits. Already, the Gold Bugs Index has fallen to a 6-year low and additional strength in the US Dollar will probably bring about another smash.
Bearing in mind the above prognosis, we currently have no exposure to the physical metals or the related mining stocks. The trend in the precious metals remains down and our readers are advised to stay out of harm’s way.
About the Author: Puru Saxena
An investment adviser based in Hong Kong, he is a regular guest on CNBC, BBC, Bloomberg, NDTV Profit and writes for several newspapers and financial journals.


-
I know Mike is a very solid investor and respect his opinions very much. So if he says pay attention to this or that - I will.
~ Dale G.
-
I've started managing my own investments so view Michael's site as a one-stop shop from which to get information and perspectives.
~ Dave E.
-
Michael offers easy reading, honest, common sense information that anyone can use in a practical manner.
~ der_al.
-
A sane voice in a scrambled investment world.
~ Ed R.
Inside Edge Pro Contributors

Greg Weldon

Josef Schachter

Tyler Bollhorn

Ryan Irvine

Paul Beattie

Martin Straith

Patrick Ceresna

Mark Leibovit

James Thorne

Victor Adair