
Gold & Precious Metals
Two quick charts to note some developments in gold.
The first is of the metal itself.

A couple of things worth mentioning. First of all is the CLOSING push past the 100 day moving average. That will attract the technical or chart-based trading funds. If they are short, they will cover; if not long, some will come in on a signal like this.
Secondly – the price closed above the first level of chart resistance noted down near the $1225 level or so. That is the best CLOSING price in over one month.
Also, the price managed to push into, but not through so far, the second resistance zone noted on the chart. That extends up to $1240. A push through that level that can stay above it, should allow the market to make a run at $1250. Clearing that would be a big deal in my view as it would open the potential to run at least another $25 higher to the area near $1275 and possibly even $1290-$1300.

Also, the RSI has now finally moved through the key 60 level, something it has not done since July of last year. If the RSI can extend higher tomorrow or the next day, and actually get above 65, this recent move higher would have to be respected as having some more upside potential.
Personally, I am still not excited about gold based on my current view of the fundamentals as I see little reason to own it for any sort of decent returns in the long term, but in this environment in which stocks are wobbly right now and interest rates are falling, it is definitely attracting safe haven flows as is witnessed by the falling yield on the Ten Year Treasury note and the move higher in the long bond ( as well as Yen strength). In other words, while the intermediate term chart, the weekly, looks poor, the Daily chart has definitely improved. Short term I see nothing on this chart to induce me to be bearish its prospects for the current time being – yet…
That being said, one cannot fight the tape and expect to win so if you are short, keep a close eye on this as a fairly good contingent of short positions are covering right now.
One of the other positive factors for the metal at the moment is the strength in the gold shares. The HUI looks very impressive on the chart right now, again, the DAILY CHART. It too has cleared its 100 day moving average, something which it has not done since September of last year. Also the 50 day is turning higher.
Note that there is what appears to be a solid band of resistance over the market near the 200 level. That will be a bit test for the bulls in my view.

Switching out to a longer term view ( intermediate or weekly chart), the index has pushed past the top of the first resistance zone noted on this chart. That extends back to the December 2013 /October 2014 lows. If the HUI can maintain its gains until the close of trading this Friday, it stands a good chance of moving higher and possibly making a potential run at 200-210.
I should note however that on this longer-dated time frame, the RSI is currently showing a BEAR MARKET RALLY is occurring at this point. That is because the reading is well below 60 ( currently near 52). As you can see from looking across at the indicator, it has not been above 60 since October 2012!

The MACD is positive reflecting the bullish view but the reading is also quite depressed even though it is indeed in a bullish posture. I have drawn in some dotted/dashed lines in orange on that indicator to give you some examples of what the MACD looks like when it is reflecting some bullish readings. I try to combine these two indicators to give me a sense of the strength of any market move. Back in September 2012, the MACD was strongly bullish and the RSI has moved above 60, reaching to 67 at that time, giving the possibility of a resumption of the bull move. Note how quickly the RSI fell back below the 60 level. It was only a few weeks later that the MACD threw off a new SELL signal. The market then proceeded to implode lower.
That is the reason one wants to employ a few good indicators ( I have not even included the ADX/DMI on this chart) along with various horizontal support and resistance levels, to analyze a market. As far as I am concerned at this time, until the WEEKLY RSI can register a reading above 60 in this market, this appears to be nothing more than yet another move higher in an ongoing bear market in the gold shares. Short term (Daily chart) the HUI is promising; longer term it is not. Not yet…
I will make this comment and leave it at that… some of the readers are still holding large numbers of mining shares in their portfolios from having bought them a few years back at the height of the gold bug “the sky is falling” hysteria. I would watch this intermediate term chart very closely if you are considering lightening any of that load and trying to salvage what is left of a financial disaster that occurred in these shares. Right now, at this moment, there is still upside momentum on display. Keep a close eye on that because if that momentum changes to the downside and the rise stalls out, it might present you with an opportunity to sell some of your holdings in this sector and set aside some cash to buy into a different sector later on these next few weeks/months. Don’t try to predict anything – just watch the price action carefully and buy and sell based on what you see in the price chart action.
The reason I bring this up is that I know from emails in the past that many, many readers of my former site had swallowed the propaganda from the gold perma bulls and loaded the boat on gold mining shares. Having watched their financial net worth devastated as a result of listening to those Johnnie One note hucksters, they are now stuck with large holdings of the things in their portfolios. If the market gives you a chance to sell some of those losers at a better price AND IF YOU believe you are overloaded in gold shares, then watch the current rally closely as it may be just what the Doctor ordered for you to relieve some of your pain in there.
I remember how stunned I was to first learn that some of the poor victims of these gold shills sold every stock that they had while waiting for the “any day now market crash” and took the entire proceeds and put them into gold shares! The results of that were of course horrendous. I know of two instances in which marriages were ruined as a result of this sort of “bet the farm on a sure thing” crap.
The lesson in this is hard but simple – when trading or investing PRECIOUS INVESTMENT CAPITAL DO NOT listen to emotional or fear-based ideas. Instead, do your own analysis and STUDY THE PRICE CHARTS. You will never go wrong by listening to what the market tells you.
That goes for anything yours truly here might tell you! Like any other trader, I have my own idea of what a market should be doing from my understanding of the fundamental factors that impact it. Guess what – I can be wrong as well! We all can. That is why it takes humility and a lack of ego when trading. Admitting you are on the wrong side of a trade or investment is incredibly easy unless you have an ego problem. If you are wrong, GET OUT! You can always get back in but not if you have lost all of your money by refusing to admit that the market is not confirming your opinion towards it.

In this interview Marc lays out his reasons for an imminent Stock Market Correction/Crash of 30-40%, and why the only sector that is truly beaten down right now are the gold and silver mining shares. Some key summaries of this 13 minute interview are below – Money Talks Editor
When speaking about an imminent stock market correction, Marc Faber argues that since the market hasn’t had more than a 10% correction since 2011, it is likely that we will se a 30-40% decline in the not to distant future.
Marc has witnessed many bull markets and crashes in his career. Marc says that bull markets frequently go on for longer than expected, but the current bull market is already very old, and has been going up steeply since 2009 – in other words, more than 5 years old. “The one thing I can say, is that we are in a aging bull market, and the recovery has lasted longer than the typical recovery phase over the past 100 years.”
We ask Marc if the Fed’s current slowdown in tapering will be reversed in a stock market correction? Marc points out that whenever there is a problem with liquidity in the markets (1988, 2000, 2007), the Fed has stimulated the economy by injecting liquidity, so it’s not unlikely that the Fed will again try to support assets markets. The problem is when this goes on long enough, numerous assets aren’t affordable for the majority of people. The impact of this may be negative for the economy, because some asset prices may rise disproportionally in comparison to other prices.
On the multi year low in mining equities, Marc says that general assets are very high right now. And the only asset class that in Marc’s view are beaten down now are the gold and silver mining shares. When looking at the Dow Jones Index in comparison to the GDXJ(junior gold mining stocks index), the underperformance from the GDXJ has been colossal. As a contrarian or as a value investor, Marc sees reasonable value in the gold mining stocks right now. Government bonds and other assets are essentially inflated, but the gold mining stocks are deflated.
Speaking on the influx on gold into Asia… Marc thinks it’s an interesting situation, because in the west we have rumors of central bank’s manipulation of the gold market to keep the price depressed. Marc believes that these rumors are insensible – the West should want to sell their gold at a high price, not at a low price point.
Finally, in the last 20 years, there has been a huge increase of wealth in Asia. The increase in gold purchases in Asia, comes from a growing population, and a population which is increasingly affluent. Marc says that in terms of the Asian stock markets, they are relatively depressed in comparison to the US stock markets, and there is better value there.
About Marc Faber

Dr Faber publishes a widely read monthly investment newsletter “The Gloom Boom & Doom Report” report which highlights unusual investment opportunities, and is the author of several books including “ TOMORROW’S GOLD – Asia’s Age of Discovery” which was first published in 2002 and highlights future investment opportunities around the world. “ TOMORROW’S GOLD ” was for several weeks on Amazon’s best seller list and is being translated into Japanese, Chinese, Korean, Thai and German. Dr. Faber is also a regular contributor to several leading financial publications around the world.


In this week’s issue:
- Weekly Commentary
- Strategy of the Week
- Stocks That Meet The Featured Strategy
In This Week’s Issue:
– Stockscores’ Market Minutes Video – Stop Trying to Make Money
– Stockscores Trader Training – Sell Signals
– Stock Features of the Week –
Stockscores Market Minutes Video – Stop Trying to Make Money
Most traders focus on money when making their decisions and that leads to mistakes. This week, I discuss the importance of taking money out of the decision. Plus, my regular weekly market analysis.
Trader Training -Sell Signals
Selling your stocks at the right time is the most emotionally challenging step in the trade. There are times when we are wrong and we must exit at a loss – that is hard. There are times when we buy strong stocks that perform very well which we tend to sell too early because we doubt that the strength can last. Then there is the pain of watching a winning trade turn in to a loser because we fail to exit at all.
This makes it important to have an approach to selling that allows the trader to maximize profits over time. A tested and proven approach can help the trader take the emotion out of this difficult decision. Should the investor use fundamental or technical analysis to tell them when to sell?
Those who use the business fundamentals to make their investment decisions will typically set a price target based on their determination of fundamental value. If their fundamental analysis determines that a stock trading at $10 is really worth $15 then it makes sense to buy it at $10 and sell it when it hits $15. This is why you often hear fundamental analysis include a price target.
A technical analyst will wait for the market to give a sell signal, either by a loss of momentum, reaching an overbought state or by suffering a breakdown on the stock chart. Technicians may set price targets based on price ceilings that the market has defined in the past or they may simply wait for the market to give a signal that the buyers are losing their enthusiasm.
Whether you use a fundamental or technical approach, there are countless varieties that can be applied, making it a challenge to arrive at an answer to which approach is better. However, if we stick to a very basic set of competing definitions, it becomes possible to see the strengths and weaknesses of each.
Let’s define a fundamental approach to selling as exiting a trade when the stock’s price is greater than its fundamental value. Put that up against the technical approach which is to sell a stock when there is a signal from its trading activity that the stock is more likely to go lower than higher.
While the notion that we should sell a stock if its price is higher than its fundamental value makes a lot of sense, there are major problems in its application.
First, do stocks only rise to their fundamental value?
History is filled with stories of stocks that have enjoyed amazing upward trends that go far beyond any fundamental analyst’s estimation of value. Consider shares of Tesla (TSLA), the electric car manufacturer. This company makes about 20,000 cars a year (as a comparison, Ford makes about 2 million cars a year). TSLA has a market cap of about $20 billion dollars (that is $1 million of market cap per car for a company that sells its cars for around $100k). No matter how you crunch the fundamental valuation models, it is not possible to justify the price that TSLA shares trade at. Even the company founder, Elon Musk, has said that he thinks the shares are overvalued which is perhaps why the stock has finally started to lose its long term upward momentum. However, a shareholder that used fundamental valuations would have sold the stock very early in the long term upward trend and left a LOT of money on the table.
The second major issue for using fundamental analysis to determine an exit point is the actual assessment of what fundamental value is. There is no rule book which determines how the pricing model should look. Even if fundamental analysts use the exact same pricing model they could still arrive at very different valuations if they use different information to arrive at price.
If you believe in market efficiency then you have to believe that the price a stock is trading at today is correct given the information that the public has to work with. The stock’s price in the future will not depend on what the market knows today, it will be determined by what new information the market learns in the future.
A good fundamental analyst has the ability to predict what the company’s value will be in the future because they have information that the general public does not have. To be a good fundamental analyst requires the use of private information.
That is where good technical analysis comes in.
Most technical analysis uses market activity to assess what investors think of the company’s fundamentals. Momentum indicators like the MACD or moving averages judge whether the buyers or sellers are in control of the stock. Oscillators like the Stochastic or RSI determine whether the buyers or sellers have been too aggressive, pushing the stock up or down too quickly. While these indicators have some use in analyzing the stock, they are like most fundamental analysis – they don’t provide an edge.
To beat the market, you have to trade with private information. Since most of us do not have the expertise or insight to gather private information on a lot of stocks, we have to use technical analysis to figure out what the people who are doing really good fundamental analysis know.
From the sell side, we need to look for evidence that those with the best information are selling for a reason. It is normal for stocks to have up and down moves in a long term trend. What is key is to be able to figure out the difference between a pull back and a trend reversal. That is where good technical analysis comes in.
A stock that is trending higher will form an upward sloping trend line that can be drawn by placing a line across the bottoms on the stock chart. As long as that line is not violated, the buyers are in control of the stock and the perception of fundamentals is improving over time.
A trend line that is broken implies that some investors have information which justifies aggressive selling. We have to listen to those investors so sell your winners when their upward trend line is broken.
The second approach to technical selling is to establish a range of price volatility that is normal for the stock and plan to sell if the stock moves down more than that price volatility range tolerates. This is a sort of trailing sell signal concept which allows the investor to lock in more profit as the stock moves higher by establishing a higher floor price. If the stock pulls back to hit the floor it is time to exit.
This approach is not without its faults. The most common mistake that traders make is taking too short term a view for the trading style that they are applying. If you are a longer term trader looking for entry signals on a daily chart then you should not be looking for trend line breaks on an intraday chart. It is probably best to look for a longer term entry signal using a weekly chart. As good traders say, the profit is in the patience.
The two technical approaches discussed here are very simple and will be useful to anyone holding winning stocks. It is possible to improve upon them with more sophistication but without making them complex. These better selling rules are taught in the Stockscores trader training programs, which you can learn more about at www.stockscores.com/learn.
![]()
2015 is starting off in similar fashion to 2014 for the Gold (and Silver) miners. After ruthless tax loss selling pressure in to the end of the year, we are seeing a bounce back on relatively light volume. Some of the miners have moved up more than 50% in just a few weeks.
The problem for the longer term trader is that most of the charts for these stocks are still pretty ugly. There is not yet a good sign that the long term downward trend is reversing. That does not mean you can’t trade and make money from these stocks, you just have to take a short term view. Day and swing trading the more active and volatile names is working well right now, but the probability that they will continue to show strength through 2015 is still pretty low.
If you have the time to be a more active trader, there are some ETFs that are very actively traded and which make big short term moves when the sector is attracting buyers. Here are a few ETFs to consider if you want to take advantage of the short term action in the Gold Mining sector.
1. NUGT
NUGT is a US listed, leveraged ETF that moves 3 times as fast as the underlying sector of Gold Mining stocks. Very active with some big moves but be very careful holding this for a long time against the trend. It suffers value decay each day because of rebalancing so you have to be very disciplined with using stop losses if your trade does not work. (Do a Google search for leveraged ETF rebalancing to see some explanations of how this works).
2. T.HGU
T.HGU is a Canadian listed ETF that is similar to NUGT except that it is based on Canadian Gold Miners and is leverage 2 times rather than 3. It has moved from $4.50 to $7 in the past few weeks as investors bottom fish the oversold Gold Mining stocks. Since it is a leveraged ETF, be careful with longer term holds.
3. GDXJ
GDXJ is a non leveraged ETF that is based on the junior Gold Miners listed in the US. Less volatile and not subject to the daily rebalancing, it is a more conservative way to trade the sector. If you want to focus on the larger cap Gold Miners, use the GDX.

References
- Get the Stockscore on any of over 20,000 North American stocks.
- Background on the theories used by Stockscores.
- Strategies that can help you find new opportunities.
- Scan the market using extensive filter criteria.
- Build a portfolio of stocks and view a slide show of their charts.
- See which sectors are leading the market, and their components.
Disclaimer
This is not an investment advisory, and should not be used to make investment decisions. Information in Stockscores Perspectives is often opinionated and should be considered for information purposes only. No stock exchange anywhere has approved or disapproved of the information contained herein. There is no express or implied solicitation to buy or sell securities. The writers and editors of Perspectives may have positions in the stocks discussed above and may trade in the stocks mentioned. Don’t consider buying or selling any stock without conducting your own due diligenc

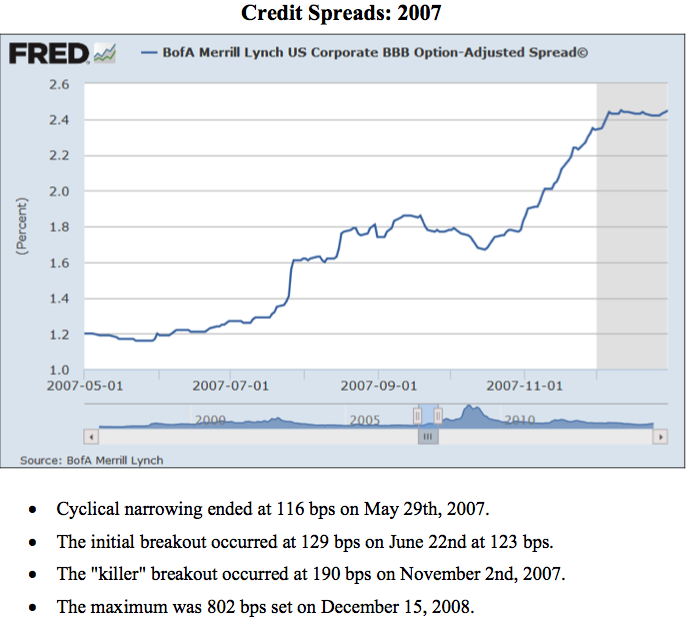
We think financial markets are beginning to have second thoughts about the Fed…a month ago “everybody knew” that the Fed was going to start raising interest rates in 2015…but now we see signs that “some people” aren’t so sure…if these second thoughts become more wide spread then the US Dollar will take a hit…and other markets will react to that.
At the beginning of 2014 “everybody” was forecasting that interest rates would rise…they didn’t…and Treasuries out-performed stocks by a mile. At the beginning of 2015 “everybody” is forecasting that the US Dollar will keep rising. One of the KEY components of the USD bullish forecasts is “divergent” central bank policies…the Fed is expected to tighten while other central banks either sit on their hands or ease.
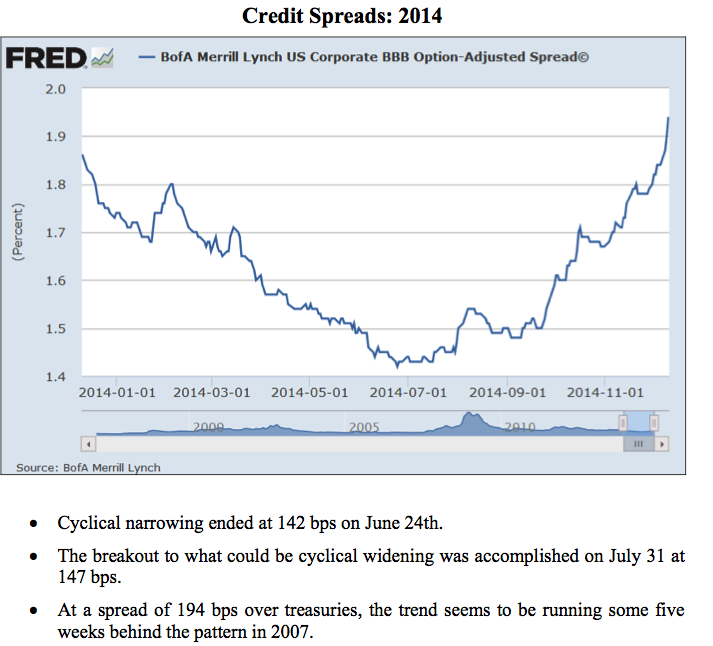
But since mid-December US credit markets have been “backing away” from their conviction that the Fed will tighten in 2015. Economic weakness outside the USA, falling commodity prices, a strong US Dollar and falling domestic wage growth may cause the Fed to reconsider.
The December 2015 Eurodollar: has rallied ~20 basis points since mid-December…meaning that…come December 2015…the market is expecting 90 day Eurodollar rates to be ~20 basis points lower than what was expected 3 weeks ago. (The Eurodollar contract trades at a discount to par…rising prices signify lower interest rates)

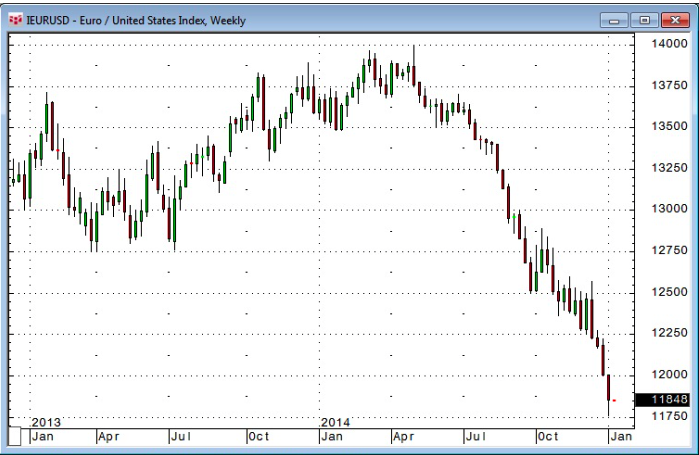
The Euro Currency: We think that the sell-off in the Euro is over-done…it has fallen for 7 consecutive months… it’s at 9 year lows…virtually all currency analysts are lowering their year-end forecasts to Par or worse…bad news for the Euro is everywhere and speculators hold record sized short positions…we are in a “Buy the Rumor / Sell the News” mood. If there is a correction in the USD and the Euro starts to rally then short-covering could easily drive prices to the 125 level. We remain long-term bearish the Euro but we sense a short-term bounce may be at hand.
We took an initial position betting on a USD correction last week…we bought OTM Euro calls…our thinking was that IF the USD is going to correct then the Euro would likely have the steepest rally of all the currencies. If we see signs that the Euro is turning higher we will get more aggressive. If the Euro doesn’t rally we will limit our losses to ~50% of the option premium.
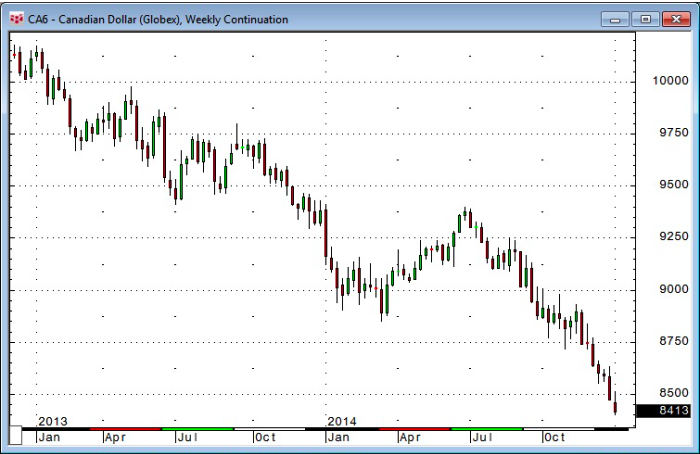
The Canadian Dollar: closed last week at 5 ½ year lows. The more Crude Oil falls the more intense the pressure on CAD…we have added to our long-term hedges on CAD the past couple of months…it’s been hard to sell more CAD at 5 year lows but we felt under-hedged being short only ~30% of our net worth. If the USD corrects lower then we expect all currencies will rally…but CAD probably less than others…unless there is a BIG bounce in Crude. We have no short-term trading position in CAD…but would probably look to get short if it rallies on any USD weakness.
WTI Crude Oil: traded to a new 5 ½ year low last week…closing lower for 14 of the last 15 weeks as it fell from ~$95 to ~$47. Crude seems to be extremely over-sold and it might rally if…the USD shows signs of correcting. We have no current position…BUT…

WTI Crude Oil option volatility: has more than tripled from multi-year lows made in July. We have no current position in Crude…but…we would certainly consider writing OTM puts if we thought that the breathless decline was going to pause…or reverse.

Gold: we bought gold in early December…we were impressed with the $80 rally off the lows on December 1…and we added to our position last week. We like the way gold has traded even as Crude has tumbled and the USD has soared. We note that gold stocks have out-performed gold. We see serious chart resistance at ~$1250…a rally through that level would be impressive. Given that we expect a USD correction we like our long gold position and would look to add on a rally through $1250.

The S+P 500: traded to All Time Highs after Christmas…then sold off into January 6. For our short-term trading accounts…trading on nothing more than market action…we bought OTM calls last Wednesday and loved the big Thursday rally ahead of the Friday UE report. We sold the calls early Friday morning and late in the day we took a new position shorting OTM puts. We obviously think the market is going higher but would abandon our short puts if Thursday’s lows were convincingly broken.


So when will 1.20 print on USDCAD?
We have a quiet week ahead in terms of economic releases and this lack of data will probably see the trend for a stronger USDCAD continue. Keep an eye on oil though as a bounce here will give a bid to CAD but for the moment weak oil, weak commodities and weak employment numbers all combine to keep the Loonie on the back foot. Elsewhere, the Euro is having an even harder time of it with some commentators now calling for EURUSD hitting parity this year from the current 1.1850 level, and which 6 months ago was trading at 1.37. With Europe beset by political and fiscal issues it’s hard to see what can turn this one around and that 1 to 1 value seems a lot more likely than a return to the level of last summer.

![]()

-
I know Mike is a very solid investor and respect his opinions very much. So if he says pay attention to this or that - I will.
~ Dale G.
-
I've started managing my own investments so view Michael's site as a one-stop shop from which to get information and perspectives.
~ Dave E.
-
Michael offers easy reading, honest, common sense information that anyone can use in a practical manner.
~ der_al.
-
A sane voice in a scrambled investment world.
~ Ed R.
Inside Edge Pro Contributors

Greg Weldon

Josef Schachter

Tyler Bollhorn

Ryan Irvine

Paul Beattie

Martin Straith

Patrick Ceresna

Mark Leibovit

James Thorne

Victor Adair