
Timing & trends
Perspective
It is not just the tech sector that has entered “hyper-drive”, which is a term and convention used for a long time in the world of science fiction. While unwilling to define central banking as “science” or “fiction”, artificial-drive has been employed since the Federal Reserve System was confected in late-1913. In order to prevent bad things from happening hyper-drive has been imposed since the late 1990s.
The saddest part of the experiment is that it has been based upon arbitrary notions about how the economy “ought” to work. It is also based upon the absurd concept of a national economy. The other main absurdity is that expanding credit forces price up.
What’s been happening to commodities?
It is the other way around, soaring asset price permit credit expansions and Mister Leverage has been fully engaged in the financial markets. Not in commodities.
Politically, the US administration has been on hyper-drive on its way to “change” the American culture. This has been the most ambitious assault on the socio-economic fabric, ever, and has employed not just class warfare, but race warfare as well. This was intensified going into the November election with hopes of eliminating any kind of opposition to the Left’s endless pursuit of control.
The election resulted in the strongest Republican position since the 1920s.
Unfortunately, there is the big election in 2016 and while the control freaks were severely damaged in the polls, both kinds of warfare will be fanatically employed. Right through to November 2016.
In a boom everyone gets busy, including the political Left.
Outside of domestic politics, the global warming movement is becoming particularly frantic. That’s in the face of eighteen years of no increase in satellite measurement of temperature. In America the last three years have set successive record lows in tornado activity. The Antarctic ice sheet has set record highs and the Arctic sheet is the largest in almost ten years. A chart follows.
How long can the mania in central banking, financial markets and political markets last?
This is difficult to pinpoint, but we are comfortable in noting that economic and political nihilism will continue until it is seen not to work.
Wrap: 2014
In November a year ago, we concluded that a significant “Rotation” into depressed commodities would provide a good trade. Energy, base metals, grains and precious metals staged important lows and accomplished rallies into late spring. Each rally soared to enough of an overbought to depart the play.
This would be within the bear market that began in 2011 for most commodities.
On the interest rate side, “Rotation” would naturally be accompanied by rallies in low- grade bonds out to around May-June. We got out on the overbought. And a possible credit contraction would be accompanied by a strong dollar.
Technically in December a year ago, the bond future was poised for a rally and we are still “in” and are now looking for “ending action”.
In the stock markets, outstanding action generated Exuberance, Divergence and Volatility. The result was a correction in October for the senior stock indexes and a resumption of excesses. The full “Resolution” of such measurable excesses has yet to be realized.
Outlook: 2015
Financial markets revived out of October and recorded another set of technical excesses. Ambitious central banking will continue until denied by Mother Nature. In so many words, the notion that eternal prosperity can be obtained through eternal depreciation will get slammed by another wave of asset deflation.
Generations of veteran traders have known that concepts about fiscal and financial intervention have been just another example of utopian nonsense. The reason why it has had so many followers is that intuition is always so appealing. That’s in any century. Without knowing it Keynes “discovered” what so many intellectuals before him had discovered in previous crashes.
And that is that more credit from somewhere will make a credit contraction go away. The earliest one we have found was uttered by Edward Misselden in the 1618 to 1622 crash. The sudden change from prosperity to hardship and unemployment provokes the same policy knee-jerk. That would be from “everything is wonderful” to “we have to do something”.
In December 2007 it was the “Dream Team” at the Fed. Nothing could go wrong. In 2008 it was emergency “shovel ready” plans.
In the early 1600s, England’s government essentially duplicated the cloth-finishing business that existed in the Netherlands. It was a make work program.
A London merchant described the grand scheme as like a sepulcher – “attractive without, dead bones within”.
Milton described such folly as “Tyrannical Duncery”.
Essentially many in 2014 realized that the grand plan to “manage” the climate was just plain stupid. Quite likely as 2015 progresses the public will discover that the grand plan to “manage” the economy is just as stupid.
So where does this place the investor?
Orthodox methods of determining portfolio balances based upon conjecture about what the Fed is going to do or “ought” to do has essentially been impractical. This holds for the gold bugs as well. All that Fed recklessness “ought” to have driven gold to “five thousand”, but it did not happen. Essentially because lower-grade bonds reached the equivalent of “five thousand”. The NYSE was working on the same impetus until this week and the bond future is working on it right now.
Where will the best returns be earned?
High-grade US corporates in the 3 to 4-year maturities are an ideal position in a financial storm. Gold’s unique liquidity and financial character is also good for riding out a storm. By later in the year gold stocks could be showing superior returns.
Stock Market
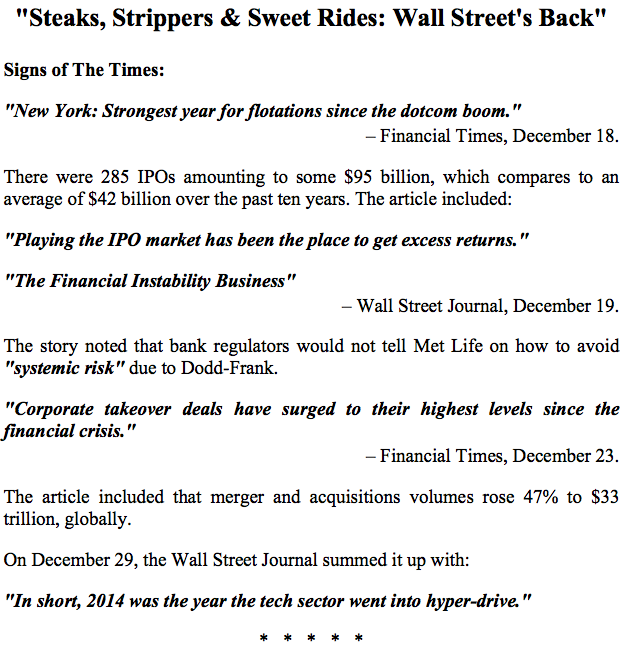
“Steak, Strippers & Sweet Rides: Wall Street’s Back”
This was from a CNBC article published on January 2nd. We think it is accurate and it included advice on how to “spend a $1 million bonus”. Also noted was that automakers were selling millions of high-priced cars. (A “sweet ride” is a nice car.)
This anecdotal measure ranks right up there with the best in the long history of stock markets.
The latest surge has been based upon the benefits of weakening crude oil prices. On December 1st, the Washington post reported “Tumbling oil prices are…injecting a much- needed boost for American consumers”.
Our view has been that the plunge in oil prices and further weakness in other commodities could be signaling a global recession. This melancholy probability is being confirmed by credit spreads reversing to widening in June. Yet to confirm is the curve reversing to steepening.
Some weeks ago we ran the chart of crude’s price and recessions. The chart from The Chart Store follows and starts in 1913. Most bear markets in crude oil have been associated with a recession. Intense speculation in crude oil can leave a lot of financial damage behind.
The year closed with another burst of enthusiasm, followed by volatility.
On the big market, the NYSE Comp (NYA) has been a good guide for cyclical peaks. This set a Rounded Top in 2007 and seems to working on one over the past six months.
On the nearer-term chart, taking out the December low of 10360 would be interesting. Taking out the October low at the 10000 level would set the downtrend.
Banks stocks (BKX) have taken out the 50 and 200-Day moving averages, as well as the December low.
Europe’s STOXX recorded Rounding Tops in 2000 and 2007 that is being replicated since mid-2014. Of interest is that the high in 2000 was 5552, in 2007 it was 4572 and in 2014 it was 3325. That was in June and now it is at 3007, which is at December support.
The sequence of descending highs in Europe helps explain the focus on NYSE senior stocks. The S&P high in 2000 was 1553, in 2007 it was 1576 and December it was 2093.
Selling pressures across many sectors has been impressive – enough to register a Springboard Buy on the senior indexes.
Commodities
Crashes in crude don’t happen all that often but when they do they are impressive.
On timing there are seasonal forces that have been likely to complete in December. Some crashes have run for 6 to 7 months and this month is number seven on the count.
Percent declines have been impressive and the action can take a pause.
In gold terms the full bear could amount to a decline to some 25% of the cyclical high. That was the decline in the last Great Depression.
Another measure of the real price is against the PPI.
One example we used was the 1985 to 1986 crash when the deflated price fell 66% from that fateful November to the following March. The bear market from October 1990 to February 1994 amounted to 65%. The crash from June 2008 to December 2008 amounted to 75%.
As deflated by the PPI, the high in June was 102 and at 48 the plunge is 53%. In gold terms it is down 53% as well.
After a pause, crude can decline further.
At the height of the boom in 1980 all of the banks had to be in the Oil Patch, and then it turned bad. So bad that there were hearings and one of the problems that non-market people have in a bust is wondering where the money went.
There was a particularly aggressive young banker with a new bank in Oklahoma. When the judge asked the question about the money he responded “Well, your honor, we spent it on wine women and song – the rest we just pissed away.”
This was quoted in the Wall Street journal on the way to the nasty conclusion in late 1990. The Fed had to move dramatically to bail out Citigroup and Chase Manhattan.
Grains (GKX) enjoyed a rally from a “saucer” base and became overdone a couple of weeks ago. The low was 290 in September and the high was 342 in mid-December. The drop to 316 took out the 50-Day and it has bounced to 330 yesterday. If it stays above the 50-Day it would be constructive.
Base metals (GYX) continue to decline and are getting somewhat oversold on the Weekly RSI. The 319 set earlier today is a new low for the bear that started at 502 in 2011.
Base metal miners (SPTMN) rallied from the December low of 606 to 710 last week. This could be mainly with the rally in the big market and it has given up a little. We will watch this one as the stocks tend to lead changes in metal prices.
Will there be a “Rotation” such as we called for last year?
That was likely to be significant, but can’t make the equivalent call now.
Credit Markets
With hits to stocks and commodities the bond future has rallied – right up to a Daily Upside Exhaustion on the TLT. In so many words, a correction in high-grade bonds is starting. This could be within our prospect for “ending action”, which would require a Weekly signal as well.
Lower-grade stuff has whipped-sawed with JNK at a Springboard Buy in the middle of December, which was followed by the opposite ten days later.
JNK has declined from 39.98 to 38.18. The last low was 37.08 and that is now support.
Spreads from BBB to treasuries narrowed from 210 bps in mid-December to 197 bps at the end of the year. It has widened to 206 and the trend will likely continue.
Weakening commodity prices suggest weakening producer prices and that suggests weakening earnings. As it continues it will weaken the ability to service debt. With some 17% of junk bonds having been issued by the Oil Patch, this became very clear.
Weakening crude prices had a lot to do with the panic in Russia’s bonds and currency. It reached a crescendo in the middle of December as the yield spiked up to 16.24%, much higher than the 12.80% reached in 2009. As the panic eased the yield declined to 13.12% and it has increased to 14.09% today.
As the Russian panic eased, concerns shifted to Greece as their yield jumped from 7.25% to 10.35%. This was on conjecture that Greece would leave the EU. The spike high in the October troubles was 8.98%.
Then just as the Greek yield started to soar, Der Spiegel editorialized that “The danger of contagion is limited because Portugal and Ireland are considered rehabilitated.”
“Contagion” uttered by the establishment is the term we have been watching for. It, or “contained”, has been used to keep the boogeyman of a global contraction away. Sadly – each time since the Asian Crisis of 1997 – without avail.
It seems like only yesterday when in that July the Thai central bank ran out of reserves and the there was a local panic. International policymakers moved quickly with assurances that it would be limited to Thailand. After quickly engulfing the Philippines, the hit took until September to reach the shores of Manhattan Island.
The German Ten-Year continues to plunge, hitting 0.447% on Tuesday. Away back in September it was 1.00%. In the 2008 Crash the high was 4.63%. In 1981 the high was 10.80 (no typo) percent.
However, it is worth putting the 0.447% yield in perspective. In the unprecedented rise in yields to 1981, Government of Canada long rates reached 19.5%. In that panic there might have been days when the spread between the bid and ask was greater than 0.447 percentage points.
Central bankers have become fanatical and investors have had little choice but to go along with the ride. Quite likely the action in US long treasuries has further to go and will set the ending action, which will be opposite to the mania that drove the yield up to 15% in 1981.
Precious Metals
We have been rather cautious in our re-positioning gold stocks and in early December recommended buying a little. GDXJ set a low of 22.18 in early November and bounced to 29.54. The next low was 21.24 in the middle of December and this week’s rush has upped it to 26.91. That it has broken above the 50-Day ma is constructive.
Our January 2nd special “Something Happening?” noted that gold stocks were beginning to move opposite to the big stock markets, which is also constructive. We should keep in mind that this sector took part in last year’s “Rotation” and shot up to a very overbought on the silver/gold ratio in May. We marked it as “dangerous”.
So we have not been looking for a “V” bottom, but have been looking for the sector to constructively end a cyclical bear market. This would have a period of stability with the gold shares outperforming the bullion price. This has risen above the 50-Day ma.
Also needed would be silver beginning to outperform gold. Since November this has been basing and today it got a little over the 50-Day.
Another item would be gold stocks outperforming the big stock market. Using GDXJ/SPX, this has been the case since the third week in December, with the last two days above the 50-Day.
All of this adds up to rather good construction, but the sector is still vulnerable. Thus the advice to buy in modest amounts on weakness.
The most constructive feature of the sector is that gold’s real price continues to climb. Our proxy is our Gold/Commodities chart and it follows.
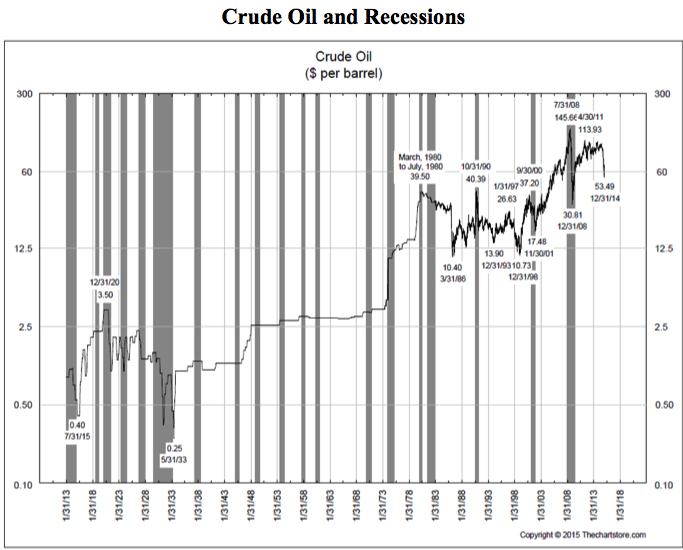
- Most bear markets for crude have been associated with a recession.
- The 1985-1986 crash was not part of a recession.
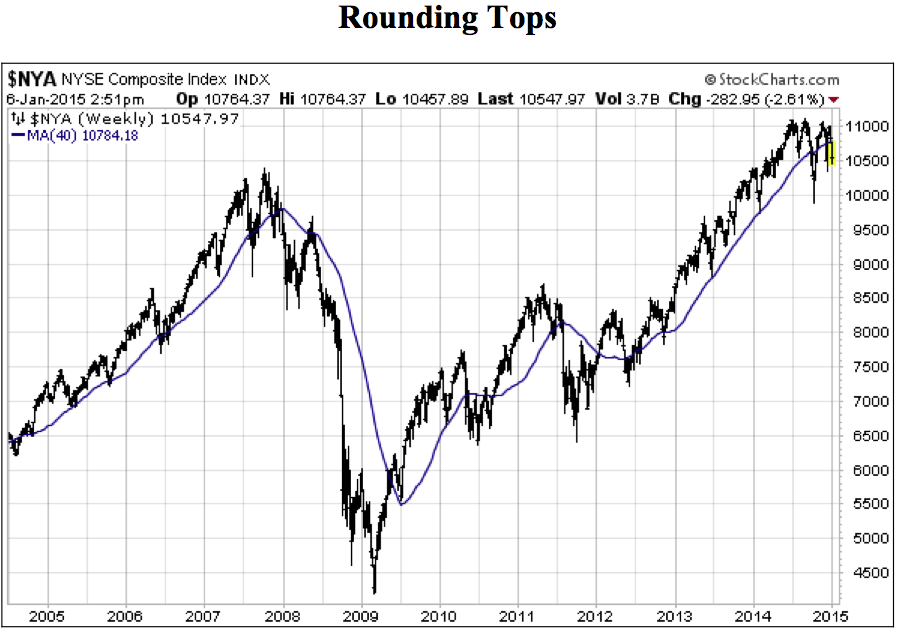
- A big Rounding Top described the completion of the 2007 bull market.
- The simple technical guide that “told-the-tale” were the multiple highs and the take out of the 40-Week ma.
- In 2007 it took two attempts late in the year.
- This example is working on the second attempt.
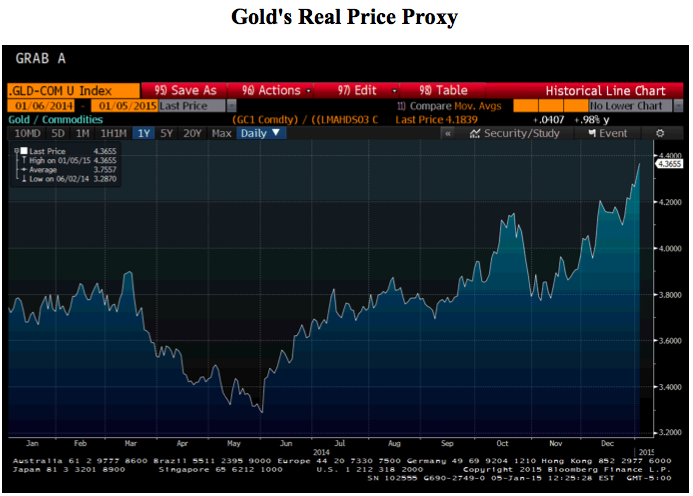
- Our Gold/Commodities Index is our proxy for gold’s real price.
- When it is going up it suggests that the bullion price is outperforming most of the costs of mining.
- We took the low of 3.28 set in June as the end of the cyclical bear that started in 2011.
- This week’s action set a new high for the move at 437.
- This compares to the cyclical high of 487 set in early 2011.
Link to January 9, 2015 Bob Hoye interview on TalkDigitalNetwork.com:
http://talkdigitalnetwork.com/2015/01/collapsing-crude-leads-to-shinier-gold/
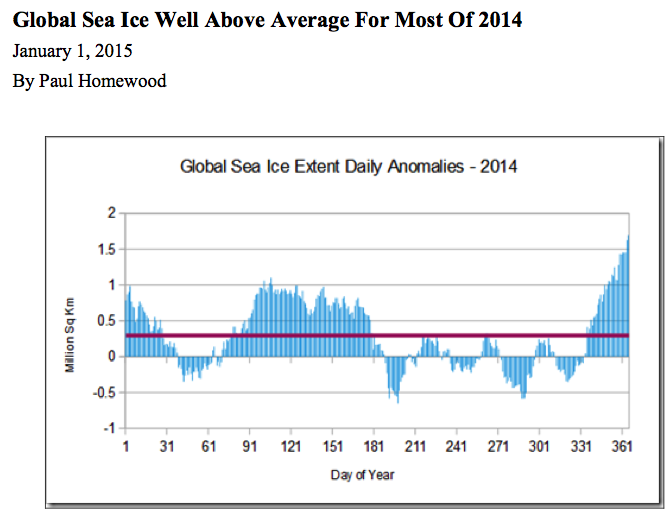
Global sea ice extent finished the year at 1.69 million sq km above the 1981-2010 average. This equates to 8.2% above normal.
During 2014, sea ice extent has been above normal for 245 days, at an average of 295,000 sq. km.
BOB HOYE, INSTITUTIONAL ADVISORS
E-MAIL bhoye.institutionaladvisors@telus.net
WEBSITE: www.institutionaladvisors.com

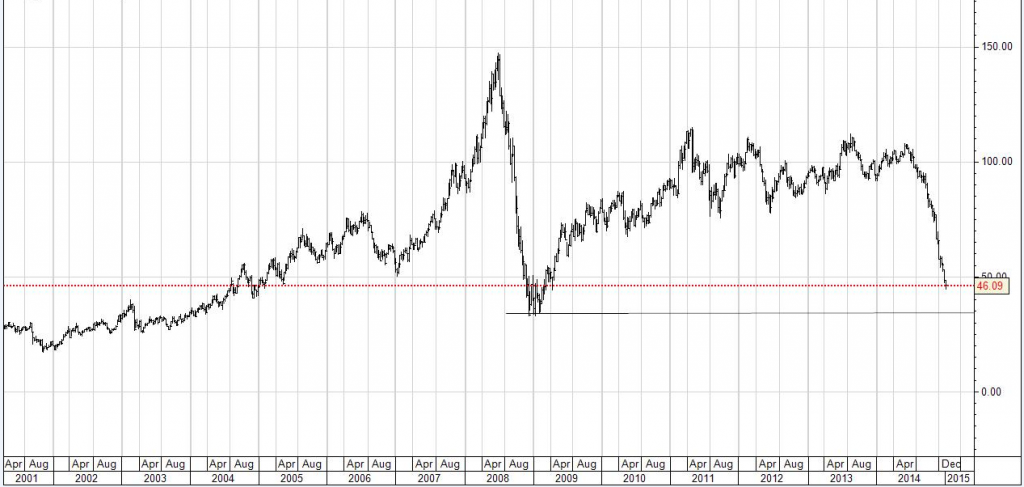
For the last 48 hours USDCAD has been stuck in a pretty tight range chopping around the 1.1950 level and it feels like it’s just preparing itself for a charge through the psychologically important 1.20 barrier. So when it does bust through where is the next stop on the line? Clearly right now price action is determined by where oil is going so let’s look at long term support for wti. Only yesterday we had the UAE energy minister confirming that there will be no change in OPEC policy and no reduction in production, and so the falling knife that is the price of oil has further to go. Looking at the weekly chart of oil going back 15 years we are now getting close to the mid 30 lows seen during the financial crisis of 2008, which would be a natural level of support. So what does a $35 barrel of oil mean for the Loonie……..the current correlation would suggest a level of 1.22, which also happens to be a longer term resistance point.
Weekly Oil going back 15 years
 The collapse of the oil price has created losers and winners, and like every major movement in a commodity sector, the trick for investors is figuring out which side of the trade to be on. The most obvious victim of the slide in Brent and WTI prices over the last 6 months has been the major oil producers. Holders of these equities have seen price slides up to 33 percent. The question for oil company investors now is how to determine which of these companies are prepared to weather a sustained period of oil prices around $50 a barrel, or worse. Inevitably, those companies with high debt levels combined with high operating costs will be the first to get washed away. In contrast, low-leveraged companies with attractive cost structures are likely to survive. These companies will gain when the oil price comes back, and are the ones that investors should be eyeing right now.

But stock picking isn’t the only way to make money out of the butchered oil price. Here are 5 ways to position yourself for either a recovery or a further deterioration of the oil market, depending on where you place your bet.
1. Buy low-cost, low-debt producers
Oil production is, to say the least, a costly business. The cost of finding and “lifting” a barrel of oil out the ground varies between $16.88 in the Middle East to $51.60 offshore in the United States, according to the US Energy Information Administration. An analysis by Citi published by Business Insider shows that a significant amount of US shale oil production will be challenged if Brent prices move below $60 (Brent is currently at $49), and that companies are canceling projects that require prices above $80 a barrel to break even.
In this difficult price environment, investors want to buy companies that can produce at a lower rate than their competitors and do not have significant debts they need to service while having to accept lower commodity prices. Here are three possibilities:
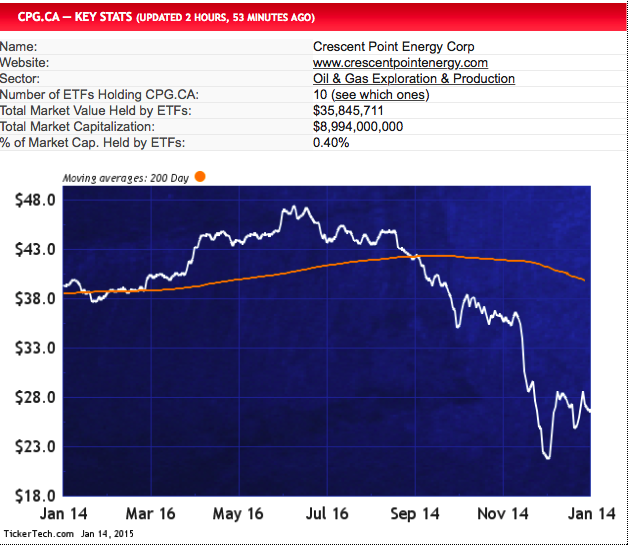
Crescent Point Energy (NYSE, TSX:CPG): A conventional oil and gas producer with assets in Canada and the United States, Crescent Point can pull oil out of the ground at a cheaper rate than its Canadian oil sands rivals. Despite cutting spending by 28 percent in 2015 compared to last year, the Saskatchewan-focused firm is still planning to increase average daily production to 152,000 barrels. Crescent Point has a solid balance sheet, with net debt totaling $2.8 billion as of Sept. 30, against a market value of $11.55 billion. CPG also offers a very attractive 10.64% dividend at its current share price, leading to the speculation that its dividend could be cut if low oil prices persist. However, Crescent Point has stated that it will only cut its dividend as a last resort and has other levers at its disposal, including borrowing through one of its credit facilities or further reducing its capital budget later this year.
Husky Energy (TSX:HSE): Having gotten clobbered 25 percent over the last six months, partly due to cost overruns at its Sunrise oil sands project, upstream and downstream behemoth Husky now offers a respectable 4.69% dividend for buy and hold investors. Husky is pulling in the reins on spending, trimming $1.7 billion off its capital budget in 2015, mostly at its Western Canadian oil and gas operations. A third of Husky’s production in 2015 was natural gas, which has held up better than oil, and should provide smooth earnings going forward. The company will also get a bump in cash flow from its Liwan project in the South China Sea. This joint venture with Chinese company CNOOC is in its second phase and Husky will receive a 50 percent price premium on the gas compared to North American prices.
Suncor Energy (NYSE, TSX:SU): The Canadian oil sands giant has been a lean machine since scrapping its $11.6-billion upgrading plant back in 2013. As The Motley Fool pointed out in a recent piece, Suncor has dropped its operating costs from $37 per barrel in 2013 to $31.10 in the last quarter. The company is not being strangled by a high debt load as it contends with lower margins. SU had about $6.6 billion in debt compared to nearly $42-billion in shareholder equity as of Sept. 30, one of the lowest debt ratios in the industry, notes Motley Fool. Lastly, investors with a long view can take comfort from Suncor’s respectable 3.17% dividend.
2. Shift your individual stock holdings to an energy ETF
Picking energy stocks is tough at the best of times, let alone during this volatile, catch-a-falling-knife environment. Shifting to an energy ETF might be a better way to hedge oil risk right now. One possibility is the iShares S&P TSX Capped Energy Index Fund (XEG). The index includes energy stocks listed on the TSX, with the weight of any one company capped at 25 percent of the market cap of the index. Owning the ETF may be a good way to capture a short-term bounce in the energy market if momentum swings to the upside.
3. Short the oil price.
The time to begin shorting oil would have been 6 months ago, but those who believe crude has further to fall could still earn some gains if they time a short correctly. One way to do that is to purchase an inverse oil ETF. Zacks has a good article on 4 possibilities, including the popular ProShares Ultrashort DJ-UBS Crude Oil ETF (SCO). Another is the Horizon BetaPro NYMEX Crude Oil Bear Plus ETF (HOD). This derivative-based fund resets its leverage daily, making it a complex instrument that should only be used by experienced traders. An investor who bought HOD back in June would have realized a 6-month gain of 264.5%.
4. Short the service companies.
Oil producers have revenue coming in even though the price of oil is down. Oilfield service companies are beholden to producers to drill and service new and existing wells, making them especially vulnerable to falling prices. When the majors cut their capex budgets, oilfield service companies feel the pain. Hedge funds started shorting oilfield service companies in November, with CGG, Fugro and Seadrill among the most shorted stocks in Europe, according to Markit data quoted by Reuters. US-based short candidates include Schlumberger (NYSE:SLB), Halliburton (NYSE:HAL), Baker Hughes (NYSE:BHI) and National Oilwell Varco Inc. (NYSE:NOV).
5. Buy transportation stocks.
Lower prices for gasoline, bunker fuel and jet fuel have made winners out of airlines, shipping and trucking companies. Two examples are Delta Airlines, up 27.2% since June, and Canadian regional carrier WestJet (TSX:WJA), which has gained 19.2% in the same period. Transportation logistics companies such as TransForce Inc. (TSX:TFI), Saia (NASDAQ:SAIA), Echo Global Logistics (NASDAQ:ECHO) and J.B. Hunt Transport Services (NASDAQ:JBHT) may also be worth a look, although the dividend payouts on these companies tends to be meager or non-existent compared to the oil majors. The author does not hold positions in any of the above-mentioned equities. Due diligence is recommended before making any investment decisions.

(1) Crescent Point Energy Corp (TSE:CPG.CA) — 10.2% YIELD
Crescent Point Energy is an oil and gas exploration, development and production company with assets focused in properties comprised of crude oil and natural gas reserves located in Canada and the United States. Co. is engaged in acquiring, developing and holding interests in petroleum and natural gas properties and assets related thereto through a general partnership and wholly owned subsidiaries.
![]()
 What can we expect in 2015? Global recession and civil disorder top the list, according to what I read. Given the way central banks and governments have sabotaged free markets at every turn, coupled with the belligerent nature of U.S. foreign policy and the militarization of our police, both forecasts strike me as plausible.
 Since last week, some 12,000 stations dropped their price under $2/gal, with 45.1% of all gas stations (nearly 61,000) now selling under the $2/gal mark. The national average currently stands at its lowest since May 9, 2009, a date that saw 8.9% unemployment . . .
An analysis of the history of technology shows that technological change is exponential, contrary to the common-sense “intuitive linear” view. So we won’t experience 100 years of progress in the 21st century — it will be more like 20,000 years of progress (at today’s rate). The “returns,” such as chip speed and cost-effectiveness, also increase exponentially. There’s even exponential growth in the rate of exponential growth. Within a few decades, machine intelligence will surpass human intelligence, leading to The Singularity — technological change so rapid and profound it represents a rupture in the fabric of human history. [Italics in original]
The first technological steps — sharp edges, fire, the wheel — took tens of thousands of years. For people living in this era, there was little noticeable technological change in even a thousand years. By 1000 A.D., progress was much faster and a paradigm shift required only a century or two. In the nineteenth century, we saw more technological change than in the nine centuries preceding it. Then in the first twenty years of the twentieth century, we saw more advancement than in all of the nineteenth century. Now, paradigm shifts occur in only a few years time. . . .
As exponential growth continues to accelerate into the first half of the twenty-first century, it will appear to explode into infinity, at least from the limited and linear perspective of contemporary humans. The progress will ultimately become so fast that it will rupture our ability to follow it. It will literally get out of our control.
He has received twenty honorary doctorates, and honors from three U.S. presidents. Kurzweil has been described as a “restless genius” by The Wall Street Journal and “the ultimate thinking machine” by Forbes. PBS included Kurzweil as one of 16 “revolutionaries who made America” along with other inventors of the past two centuries. Inc. magazine ranked him #8 among the “most fascinating” entrepreneurs in the United States and called him “Edison’s rightful heir”.
Fundamental measures of information technology follow predictable and exponential trajectories, belying the conventional wisdom that “you can’t predict the future.” There are still many things — which project, company or technical standard will prevail in the marketplace, or when peace will come to the Middle East — that remain unpredictable, but the underlying price/performance and capacity of information is nonetheless remarkably predictable. Surprisingly, these trends are unperturbed by conditions such as war or peace and prosperity or recession.
- By the early 2020s, we will have the means to program our biology away from disease and aging. We already have the tools to reprogram our biology the way we reprogram our computers. “RNA interference, for example, can turn genes off that promote disease and aging.”
- By 2030 solar energy will have the capacity to meet all of our energy needs. The production of food and clean water will also be revolutionized. “The total number of watts of electricity produced by solar energy is growing exponentially, doubling every two years. It is now less than seven doublings from 100%.” Once we have inexpensive energy we will be able to convert all the bad water on the planet to usable water. Agriculture will go from horizontal to vertical, where we will grow high-quality food in AI controlled buildings.
- By the early 2020s we will print out a significant fraction of the products we use including clothing as well as replacement organs. The early 2020s will be the golden age of 3D printing. We’ll be able to choose from thousands of open source clothing designs and print them out at pennies per pound. “We can already experimentally print out organs by printing a biodegradable scaffolding and then populating it with a patient’s own stem cells, all with a 3D printer. By the early 2020s, this will reach clinical practice.”
- Within five years, search engines will be based on an understanding of natural language. “At Google, we are creating a system that will read every document on the web and every book for meaning and provide a rich search and question answering experience based on the true meaning of natural language.”
- By the early 2020s we will be routinely working and playing with each other in full immersion visual-auditory virtual environments. By the 2030s, we will add the tactile sense to full immersion virtual reality. The latter will require “nanobots [nanometer-size robots] traveling noninvasively into the brain through the capillaries and augmenting the signals coming from our real senses.”

-
I know Mike is a very solid investor and respect his opinions very much. So if he says pay attention to this or that - I will.
~ Dale G.
-
I've started managing my own investments so view Michael's site as a one-stop shop from which to get information and perspectives.
~ Dave E.
-
Michael offers easy reading, honest, common sense information that anyone can use in a practical manner.
~ der_al.
-
A sane voice in a scrambled investment world.
~ Ed R.
Inside Edge Pro Contributors

Greg Weldon

Josef Schachter

Tyler Bollhorn

Ryan Irvine

Paul Beattie

Martin Straith

Patrick Ceresna

Mark Leibovit

James Thorne

Victor Adair