
Stocks & Equities
The bad news hitting the tape has not forced the SP500 to crack, buy the dip folks are very pleased.
Bad news
- Oil crash, increased risk of debt accidents
- Swiss peg break to the Euro, funds blowing up
- US retail sales, fundamentals dont matter any more
The ECB is buying more stuff, the game of musical chairs moves on FED to BOJ to ECB. A Citi bank analyst has stated that world wide markets need $200 to $250 billion a quarter to ‘NOT CRASH’, so far the order has been met.
This cycle continues to work and should show a risk on market by the end of Jan 2015.

Larger Image
Investing Quote…
“Tape reading is rapid-fire horse sense…The Tape Reader aims to make deductions from each succeeding transaction — every shift of the market kaleidoscope; to grasp a new situation, force it lightning-like through the weighing machine of the brain and to reach a decision which will be acted upon with coolness and precision”~ Richard D Wyckoff
“Investing should be like watching paint dry or watching grass grow. If you want excitement…go to Las Vegas.” ~ Paul Samuelson

Well, what a week! I can’t remember seeing such sustained volatility in the markets for a long time. The over-riding theme remains the almighty dollar, currently at 6 year highs against the Loonie and 11 year highs against the Euro. Although everyone knew it was coming the sheer size of yesterday’s ECB QE announcement caused some shock and with concerns about the make-up of the next Greek government will ensure the Euro stays on the defensive for the foreseeable future. Those analysts that are calling for Euro parity with the USD could soon be proved right.
Canadian CPI came out yesterday and was none too pretty (-0.7%), clearly this was in the BoC’s thoughts regarding Wednesday’s surprise rate cut.
Another theory regarding the rate cut is that the BoC was concerned about the Loonie appreciating against other currencies due to the Loonie performing better against the USD than other G7 countries are doing. Either way the Loonie here will keep exporters happy.
The graph below show s that over the last 6 months , in spite of the Loonie crashing against the USD , the Loonie has still appreciated by 5% against the Euro.
EURCAD
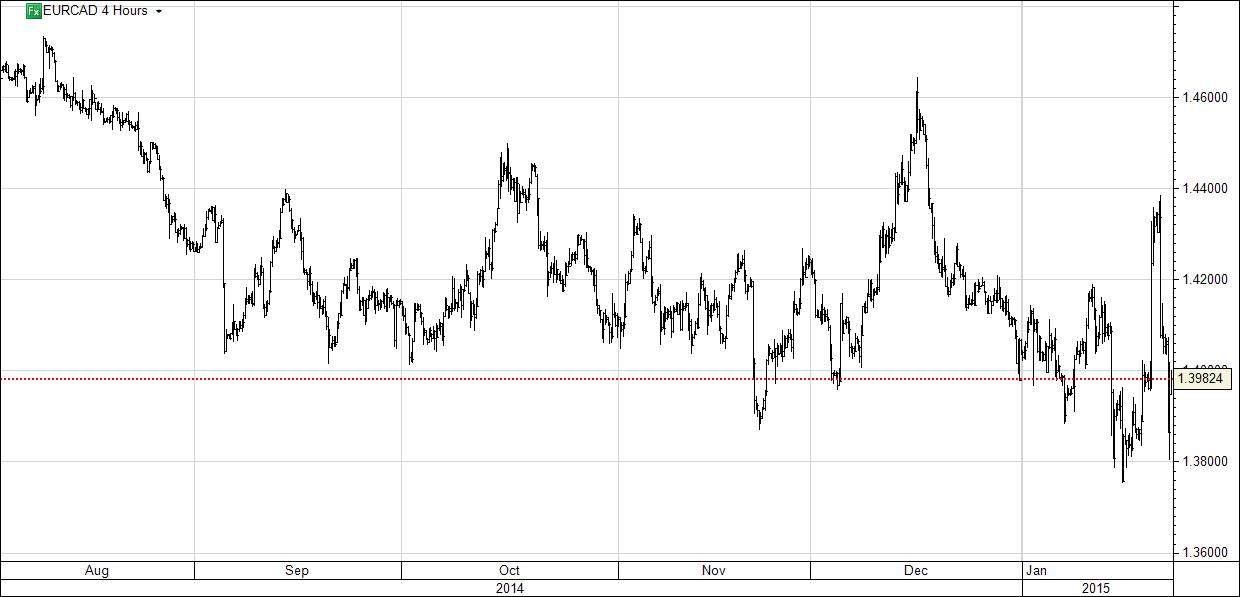
Single Click for Much Larger Chart
Gold surged this week on massive buying from stock investors and speculators. This critical group of traders and their vast pools of capital utterly abandoned gold in the past couple years. So to see them start to flock back is a watershed event, heralding a major reversal in gold’s fortunes. And with their gold exposure remaining near extreme lows, they have vast buying left to do to restore prudent portfolio diversification.
Successful investors have always practiced this essential concept of not putting all their eggs in one basket. This great wisdom is ancient, stretching back at least three millennia to King Solomon’s reign in ancient Israel. In the Biblical book of Ecclesiastes he advised, “Invest in seven ventures, yes, in eight; you do not know what disaster may come upon the land.” Portfolio diversification is absolutely critical.
Most investors today keep the vast majority of their capital in stocks and bonds, which is fine. But truly wise ones also diversify into alternative investments, which simply mean not stocks, bonds, or cash. Gold has always been the leading alternative asset, largely thanks to its strong negative correlation with the stock markets. Gold thrives when stocks are weak, making it indispensable to managing overall portfolio risk.
American stock investors’ preferred vehicle for diversifying into gold is the flagship SPDR Gold Shares gold ETF, which trades under the symbol GLD. This is the world’s largest gold ETF by far, and offers some great advantages to stock traders. They can instantly buy or sell GLD shares, gaining or shedding gold exposure, with normal stock-trading accounts. And this is very efficient, with very low transaction costs.
GLD’s mission is to track the gold price, which it has done flawlessly since its birth in November 2004. Investors and speculators owning GLD shares get gold-price exposure that’s virtually identical to gold’s underlying price moves. Achieving this mirroring isn’t trivial for GLD’s custodians, because the real-time supply and demand of GLD shares rarely matches gold’s own. That requires GLD to act as a conduit.
When stock traders buy GLD shares faster than gold itself is being bought, they threaten to decouple to the upside. That would cause GLD to fail its tracking mission. So its custodians quickly step in to the markets to offset that excess demand. They issue enough new GLD shares to supply that differential demand, and then use the proceeds to buy physical gold bullionthat is held in trust for shareholders.
Thus GLD is effectively a capital pipeline directly linking the vast pools of stock-market capital to gold. Differential buying pressure on GLD shares is quickly equalized into the underlying global physical gold market. So the more capital stock investors and speculators choose to deploy into GLD shares, the faster the gold price rises. GLD shunts stock-market capital into and out of gold, a double-edged sword.
When stock traders sell GLD shares faster than gold itself is being sold, this ETF’s price will decouple to the downside. GLD’s custodians must quickly absorb that excess share supply, so they buy back enough shares to maintain gold tracking. They raise the capital necessary to make these purchases by selling some of the physical gold bullion held in trust for shareholders. Stock capital sloshes back out of gold.
Even though the world’s gold miners launched this flagship gold ETF via their World Gold Council to increase gold investment demand, conspiracy theoristshave long attacked it. So GLD has always been super-transparent. Every single day, it publishes its total gold-bullion holdings itemized down to the individual-gold-bar level including refiners, serial numbers, and weights. This week this list was 1164 pages long!
Watching GLD’s daily physical-gold-bullion holdings data is exceedingly important for all gold investors and speculators. It effectively shows stock-market capital flows into and out of gold itself. When GLD’s holdings are rising, stock-market capital is migrating into gold. When they are falling, it is exiting out. And this week an extraordinary reversal happened likely heralding a major sea change in gold investment.
This first chart looks at GLD’s gold-bullion holdings over the past year or so in blue, measured in metric tons. They are superimposed over the gold price rendered in red. Stock investors and speculators just flooded back into gold through incredible differential GLD-share buying in recent days. I’ve carefully studied and watched GLD’s holdings for over a decade now, and I’m just amazed by this serious buying.

Last Thursday January 15th, stock traders bought enough excess GLD shares to force its custodians to buy 9.6 tonnes of gold bullion. That grew GLD’s holdings by 1.4% that day, its biggest daily build since August 2011 just before the last major gold peak near $1900! Stock investors flooded back into gold via GLD shares as gold soared 2.4% following Switzerland’s central bank greatly shocking the world’s markets.
The Swiss National Bank suddenly and surprisingly abandoned its efforts to cap the Swiss franc in euro terms. This campaign was launched in September 2011 in response to the Eurozone financial crisis. It was intended to protect Switzerland’s export-heavy economy, keeping products affordable for its dominant Eurozone customers. SNB officials constantly called that cap the cornerstone of their bank’s policy.
So traders weren’t ready for the SNB to capitulate out of the blue, it was a black-swan currency event sending shockwaves cascading through global markets. Gold caught a major safe-haven bid in Europe on the resulting chaos, and American stock traders piled on. They were way underexposed to gold after years of shunning it, and their heavy differential buying of GLD shares certainly helped propel gold higher.
Strong rallies feed on themselves, as nothing begets more buying like fast-rising prices. Stock traders snatched up GLD shares at such a furious pace that its holdings surged 13.7t or 1.9% on Friday the 16th and another 11.4t or 1.6% on Tuesday the 20th. All together over that 3-trading-day span, enough stock-market capital poured into gold via the GLD conduit to catapult this ETF’s holdings up 34.7t or 4.9%!
This GLD-holdings surge is readily evident above, a radical change from the heavy differential selling pressure GLD shares suffered in late 2014. I couldn’t remember the last time GLD’s holdings rocketed up so fast, so I had to crunch some numbers. This recent buying spree turns out to be GLD’s biggest 3-day build in both absolute and percentage terms in many years, a truly extraordinary buying event.
GLD’s holdings hadn’t shot up by 34.7t in 3 trading days since May 2010, 4.7 years ago. That was an interesting time as stock traders migrating back into gold via GLD would help drive the yellow metal a whopping 56.3% higher over the next 15 months. Major stock-market capital returning to gold was a very bullish omen. This was also true the last time GLD saw a 4.9% 3-day percentage build in February 2009.
That was 5.9 years ago, right after that once-in-a-century stock panic in late 2008 sucked in gold due to the resulting record US dollar rally. But the subsequent big GLD-share differential buying comparable to last week’s heralded the early months of a major new gold upleg. Over the next 2.5 years the gold price would rocket 92.4% higher as investors returned! So stock traders flooding into GLD is a major buy signal.
As of this Wednesday, the data cutoff for this essay, GLD’s holdings were up 31.4 metric tons or 4.4% so far in January. This is serious buying by any standard. The chart above details GLD’s absolute and percentage holdings builds and draws on a monthly basis since early 2013. And the previous best month over this past year is merely July’s 11.1t or 1.4%. GLD’s January-to-date build nearly triples that!
Though I was a few months early thanks to the Fed’s extreme financial-market distortions, I had been expecting stock investors to start returning to gold via GLD in a major way. They had totally abandoned gold in 2013 and 2014 as the Fed’s third quantitative-easing debt-monetization campaign had artificially levitated the stock markets. With stocks doing nothing but rally, demand for alternative investments collapsed.
But stock markets are forever cyclical and can’t climb forever, no matter how much paper money the world’s central banks choose to print. So stretched to lofty and very-overvalued levels, it was only a matter of time until they inevitably reversed. And once that got underway, investors would remember the ancient wisdom of prudent portfolio diversification and start rebuilding their extraordinarily-low gold exposure.
GLD’s holdings slumped to a miserable 6.3-year low of 704.8t earlier this month. At the prevailing gold price of $1213, they were worth about $27.5b. Meanwhile the 500 elite stocks of the S&P 500 had a collective market capitalization near $18,881.7b. Stock investors’ gold exposure can be approximated by comparing their capital invested in GLD shares to their capital invested in the leading S&P 500 stocks.
That equates to mainstream stock-investor exposure to gold via GLD of just 0.15%! That is incredibly low by all historical standards. Many of the world’s best battle-hardened investment advisors believe that every investor should always have 5% to 10% of their capital deployed in gold. This is a prudent portfolio-diversifying hedge, an insurance policy that will pay out big when the stock markets decisively roll over.
Merely to hit 5%, stock investors would have to up their GLD holdings by a staggering 34.3x! That’s not going to happen, but it illustrates just how chronically underinvested in gold stock investors are today. There is a more conservative read on at least how much stock capital will almost certainly flow back into GLD over the next couple years or so. This comes from just a few years ago when gold’s price last peaked.
Back in August 2011 gold surged to $1894 the last time it was in favor. That was inarguably the time gold enjoyed the most popularity among mainstream investors during GLD’s lifespan. That day GLD’s gold bullion held in trust for its shareholders was worth $78.2b, or 2.8x higher than today’s levels. But with the S&P 500’s market cap only at $10,585.3b then, stock investors’ gold exposure was around 0.74%.
While that was a far cry from a basic 5% portfolio allocation in gold, it was still 5.1x higher than stock investors’ gold exposure today. So it’s not a stretch at all to expect stock investors’ gold exposure to gradually return to those gold-in-favor levels in the coming years. Gold will slowly regain popularity as these Fed-goosed stock markets inevitably roll over and lapse into their overdue cyclical bear market.
Stock investors will remember the wisdom of prudent portfolio diversification to protect themselves from stock downturns. And no alternative investment is better for this critical mission than gold, thanks to its strong inverse correlation to the general stock markets. The recent serious differential GLD-share buying by stock investors is likely only the start, as they remain chronically underinvested in the yellow metal.
This last chart illustrates how much differential GLD buying is still left to go. It extends GLD’s holdings and the gold price back to early 2013, when the Fed’s QE3 campaign and associated jawboning started levitating the US stock markets. As alternative investments fell out of favor, the differential selling that hammered GLD shares was epic. The quarterly draws and builds in GLD’s holdings are shown here.

This past week’s serious differential GLD-share buying by stock investors was a radical change, even at this scale. But GLD’s holdings have a long ways left to go to mean revert out of recent years’ extreme selling. Interestingly just days before the Fed more than doubled QE3’s debt monetizations to include US Treasuries in December 2012, GLD’s holdings were at an all-time record high of 1353.3 metric tons.
And that certainly wasn’t some anomalous extreme. Back 2.4 years earlier in the summer of 2010, they had hit 1320.4t. They averaged 1238.2t in 2011 and 1294.2t in 2012, and gold was actually suffering a major correction and consolidation throughout most of that span so it certainly wasn’t in favor among investors. So there’s no reason at all not to expect GLD’s holdings to fully mean revert back to those levels.
Even after this week’s stunning surge of stock-market capital flowing into gold via GLD shares, this ETF’s holdings still have to climb another 553.8t to regain 2012’s average levels. That’s a staggering amount of marginal gold investment demand, and if it happens within a year or two it will help catapult the gold price dramatically higher. 2013’s epic outlying record plunge in GLD’s holdings puts this into perspective.
That year as the Fed seduced stock investors into abandoning portfolio diversification, GLD’s holdings plummeted 552.6t. Nearly half of this extreme selling happened in 2013’s second quarter, which saw gold’s worst quarterly loss in an astounding 93 years! Those massive GLD gold-bullion liquidations that year driven by extreme differential selling helped batter gold down 27.9% in 2013. Imagine that all reversing.
If stock investors merely migrate enough capital back into gold through the GLD conduit to regain those 2012 average GLD-holdings levels, gold is going far higher. Its price actually averaged $1669 that year before 2013’s extreme selling. And with 2012’s correcting and consolidating, those gold levels were certainly nothing special and this metal wasn’t popular among investors. Such levels should easily return.
Financial markets are forever cyclical, no trend lasts forever. No matter what money-printing mischief central banks are up to, stock bulls aren’t perpetual. They always eventually yield to subsequent bears. And just as stock markets can’t rise forever, gold can’t fall forever. Major reversals are afoot in both the lofty euphoric stock markets and depressed loathed gold market. Stock investors diversifying will lead the way.
Their major GLD differential buying that is coming to help protect their portfolios will greatly accelerate gold’s young new upleg. And gold’s gains will entice even more stock investors to participate by moving some of their own capital into GLD shares. This process will not only be self-feeding among the stock investors, but it will spawn major new buying in the crucial American gold-futures market as well.
It wasn’t just American stock investors fleeing GLD shares that were responsible for 2013’s extreme gold downside anomaly, but American speculators aggressively dumping gold futures. And even though these guys recently reached selling exhaustion and started buying, they have a massive amount left to go to restore their total long and short gold-futures contracts to their normal years’ averages between 2009 to 2012.
Stock investors buying GLD shares and futures speculators adding longs and covering shorts will work together to amplify gold’s coming upside. And the longer, faster, and higher gold rallies, the more it will motivate more investors to deploy capital to participate. This week’s incredible differential GLD-share buying is only the earliest vanguard of a major reversal getting underway in gold, it’s very exciting.
Investors and speculators can certainly play gold’s big mean reversion higher in GLD shares, that’s the most-efficient and least-risky way. But since GLD’s mission it to mirror the gold price less this ETF’s annual 0.4% management fee, gold’s gains are the best GLD will see. Meanwhile the stocks of the gold miners, which were recently trading at fundamentally-absurd levels, will greatly leverage gold’s gains.
At Zeal we’ve long specialized in this high-potential contrarian sector, researching and successfully trading gold and silver stocks for 15 years now. We are constantly digging into the entire universe of many hundreds of precious-metals stocks, trying to ferret out the elites with the best fundamentals. Our favorites are profiled in fascinating fundamental reports, available at our website. They can help you decide what to buy.
We’ve also long published acclaimed weekly and monthly newsletters for contrarian speculators and investors. They draw on our decades of hard-won experience, wisdom, knowledge, and ongoing research to explain what’s going on in the markets, why, and how to trade them with specific stocks. With major reversals underway in the markets, it’s never been more important to cultivate a studied contrarian perspective. Subscribe today!
The bottom line is American stock traders started pouring capital back into gold this week in a serious way. They bought GLD shares so aggressively that this ETF had to shunt enough stock capital into physical gold bullion to grow its holdings by their fastest pace in about 5 years. And this is likely just the beginning, as American stock investors remain woefully underinvested in gold and not prudently diversified.
As the lofty overvalued US stock markets inevitably roll over without Fed money printing forcing them higher any more, gold will gradually return to favor. Stock investors have vast GLD buying left to do to attain even a semblance of portfolio diversification. This massive buying is going to propel today’s low gold prices far higher, earning fortunes for contrarians brave enough to buy in early ahead of the herd.
Adam Hamilton, CPA
January 23, 2015
So how can you profit from this information? We publish an acclaimed monthly newsletter, Zeal Intelligence, that details exactly what we are doing in terms of actual stock and options trading based on all the lessons we have learned in our market research. Please consider joining us each month for tactical trading details and more in our premium Zeal Intelligence service at … www.zealllc.com/subscribe.htm
Questions for Adam? I would be more than happy to address them through my private consulting business. Please visit www.zealllc.com/adam.htm for more information.
Thoughts, comments, or flames? Fire away at zelotes@zealllc.com. Due to my staggering and perpetually increasing e-mail load, I regret that I am not able to respond to comments personally. I will read all messages though and really appreciate your feedback!
Copyright 2000 – 2015 Zeal LLC (www.ZealLLC.com)


Stock Markets
Exuberance and Volatility continue to be the features of the stock markets. This week’s violence suggests that the Resolution Phase has become irresistible. Will resolving the excesses be moderate as in October, or cyclical?
We have reviewed that momentum and sentiment number have twice reached levels only seen at cyclical peaks in the stock market. At year-end the Bulls minus Bears number had increased to 41.5%, which compares to the 45.4 notched in June. Anything above 40 can be dangerous.
The highly-regarded John Hussman has reviewed valuations by P/E and concluded:
“One might as well be investing on a dare.”
Liked the turn of words, but this valuation is high, but not as high as in 2000 and in 1929.
Of course, the “dare” has been that the Fed’s former bond buying program would prevent bad things from happening. This was backed up with Draghi’s boasting that the ECB would soon start the bond buying. We thought that in lieu of actual buying his tout about “buying” would have to be repeated at least twice a day to keep the faithful in.
There are a few salient points that seem to be overwhelming policymaker ambition.
As if on schedule, credit spreads reversed in June and had become very concerning in the middle of December. After correcting until year-end, widening has resumed. This will likely continue and as it does it will remind that the Fed has no (repeat no) control over credit spreads.
There is no official control over the yield curve as well and it seems to have reached a technical excess at year-end. Let’s put it this way – flattening has been a positive and steepening at the end of a bubble has always been a negative.
Another point is that the intention of reckless policy has been to drive commodities up, making business more prosperous. Our commodity index, which does not include gold, set its high at 470 in 2011 and it has set a new low for the bear at 261 this week.
Of course, the charts provide dispassionate adjudication of the ambitions of policymakers, investors and traders.
We have using the NYSE Comp and the STOXX to monitor the big “Rounding Top”.
As noted last week, the pattern for the NYA has been replicating that of 2007. For the STOXX the replication includes 2007 and 2000. The key to both breakdowns was taking out the 50-Week ma at – strangely enough – the end of the year. So far this week and on a Weekly basis the price range is trading both sides of the ma at 3149. Of interest was that the year-end 2000 failure of the 50-Week was followed by a two-year bear. The year- end failure in 2007 was followed by a 15-month bear.
On the first week of the year, STOXX took out the 50-Day and 200-Day moving averages. The rebound was stopped at the 50-Day and could not reach the 200-Day, which is weak action.
The NYA accomplished a modest Rounded Top in 2000 (big action was in the Techs). It took out the 50-Week ma in January of that fateful year and declined to late 2002. The next such failure was in December 2007 and that decline ended in March 2009. The 50- Week is at 10706 and at 10532, the key long-term moving average has failed.
The near-term pattern is similar to that of the STOXX.
For both, taking out the December lows would do a lot of damage and taking out the Octobers lows would say “Game Over!”.
Within the swings the August decline registered a Springboard Buy and subsequent volatility gave two Hindenburgs. December’s decline ended with a Springboard Buy, which has now provided two Hindenburgs.
What could limit the senior stock indexes to a correction of just 10 percent?
Perhaps the limit to the last correction was provided by October’s ability to clear problems? We know that “everyone” was playing the October to May seasonality and that drove equities to another unsustainable condition.
More investors are becoming aware of the full implications of weakening commodities. Last week’s Pivot noted that the plunge in crude was getting overdone and thought that “the action can take a pause”. Which with copper’s plunge getting overdone as well could release a rally in the senior indexes.
Makes intuitive sense, but Ross has noted that crashes in crude have been followed by generally weak stock markets. Some bounces are possible but the financial markets are more precarious than they were in October.
Credit Markets
As noted above, credit spreads changed towards adversity in June which was on schedule. We had thought at some time the curve would also change, but the mania in yields made that call uncertain. However, one rule seems to be coming in. Typically a boom will run some 12 to 16 months against a flattening curve. In 2000 and 2007 the curve inverted, but some expansions have ended without inversion.
December was Month 12 on the count and this places the curve in the window of probable change. So let’s look for change. Using the twos to tens (UST2Y/TNX), flattening has become dynamic with a big swing in the Daily RSI from 29 a year ago to 72. This is the most dramatic rush of flattening since mid-2008.
This could take a little more work, but the curve is now providing a warning on change.
Spreads widened out to 210 bps in the middle of December and narrowed to 197 bps at the end of the month. It is now at 211 bps and providing another warning on contraction.
The seasonal rally for the bond future came through and was enhanced by declines in commodities and equities. We had thought that treasuries could rally up to “ending action” and as the saying goes “Are we there yet?”.
Within the spirit of avoiding precision, we are almost “There”. The Monthly RSI is up to 71 and above 70 has been rare. The last one peaked in November 2008, which was a sharp rally with the worst part of the Crash. This bond rally has been part of the financial party since December a year ago.
Also very much part of the party have been European bonds. Except for those of Russian and Greece. The German 10-year continues to set new lows for the move. Now at 0.408 percent. It is mainly the same in Spain with the yield now down to 1.60% after visiting 1.51% last week. As an example of a mania, the yield has declined from 6.78% with the Euro Crisis that completed in July 2012. There was a brief and modest correction from March to May 2013. Otherwise no correction in almost 2 years.
Much the same holds for other European bonds. A paucity of corrections.
Commodities
The concept that the Fed can depreciate the purchasing power of the dollar at will seems not to be working.
As determined by the CRB, commodities have declined by declined by 41 percent since 2011. We don’t call gold a commodity so we created our commodity index to not include gold. It has declined 45 percent on the same move.
The sell-off is becoming impetuous with the Weekly RSI on the CRB down to 11. On a chart back to 1980 it has never been this low. Perhaps a brief rally will correct the excesses.
The main depressant has been crude oil with a big weighting and a big decline. The Weekly RSI is down to only 9. Last week’s view was that the decline could “take a pause”.
Oil stocks (XLE) registered an Upside Exhaustion in June. The high was 100 and the low has been 72 in December and 71.7 yesterday. Crude’s December low was 53.60 and the low for the move was 44.20. Stocks have been outperforming the product.
While both could enjoy a pause in the decline, it is worth noting that at 45 crude was back to the price level of April 2009. At the slump to 72 the US Oil Patch (XLE) compares to the level of 45 set in April 2009.
In Canada the XEG is back to the 2009 level and that is despite the 15 handle drop in the Canadian dollar.
Perhaps the big integrated oil companies are providing the cushion, but how long can it last? The Oil Patch could suffer a multi-year contraction as suffered by the Precious Metals.
Precious Metals
The action in the Precious Metals Sector continues to be constructive. Gold shares have been outperforming the bullion price and the silver/gold ratio has improved a little.
Of particular interest is that despite this week’s strength in the dollar, gold’s dollar price has increased. This could be confirming our “New Paradigm” theme whereby gold outperforms most other price series during a post-bubble deflation. This is more obvious in each of the recessions.
The “Old Paradigm” whereby the evil Fed depreciates the dollar and gold goes to “$5,000” is hopefully shelved. The “Goldbug” story began to get legs in the 1960s when macroeconomists became aggressive in their theories that through clever manipulations they could eliminate the business cycle.
Despite the endless drumbeat about the Fed there was not one long bull market in gold’s dollar price. There were two. From 35 in the 1970 to 850 in 1980. Then from 255 in 2001 to 1895 in 2011. The following chart shows the calls based upon the gold/silver ratio.
Relative to commodities, gold’s real price continues to advance, which will eventually enhance profit margins for the industry. It will also enhance valuation of gold deposits.
Our advice has been to accumulate gold stocks on weakness, but we do not have a full position yet.
Ampersand
At the Christmas lunch with our favourite exploration company there were some “stories”. One was about a prospector coming to town and wearing his best suit which was medium grey. But it seemed to have “circles” in the fabric. This was a puzzle until someone figured out that he was putting the suit beneath the mattress overnight to keep it pressed. Coil springs.
All bear markets are the worst in history and in one in the early 1980s I recall talking to a mining broker and saying that “What the Vancouver market really needs is a good discovery”.
“Yes, but they have been holding back on those lately” was the response.
Link to January 16 Bob Hoye interview on TalkDigitalNetwork.com:
http://talkdigitalnetwork.com/2015/01/swiss-franc-shocks-currency-markets/

-
- Whenever the RSI on the silver/gold ratio soars to 80 or higher it indicates excessive speculation.
- In 1987 our research noticed that the silver/gold ratio changed before the magnificent blow-off in January 1980.
- We have been using it since.
- In 2011 the RSI on the ratio reached 92. The only other example occurred with
the 1980 peak. - The next speculative surge took it to 84 in September 2012.
- The last “Sell” was in June 2014 when the RSI reached 84.


REPORT —————
We are not only living with a bull market in gold, we are living with a potentially monster bull market in gold! The message is loud and clear. All we have to do in order to see this clearly is ignore the fumbling and mumbling of active daily and weekly traders – be they amateurs or so called professionals.
We won’t see this long term corrective pattern very often, if ever, in any stock or commodity. However, leave it to gold and silver to show us the way via this magnificent indication of what we are about to witness. Oh yes, and leave it to the Federal Reserve to be the cause that helped produce this effect.
Simply align the quarterly charts of gold, silver, the Dollar Index, and the Dow Jones Industrial Average and you will see the handwriting on the wall.
Welles Wilder’s Delta Long Term turning points are the icing on the cake. This is the type of icing that only Mother Nature can make. You know the expression:
DON’T MESS WITH MOTHER NATURE.

Indeed it is a rare occasion when a correction in a bull market ends at a higher price than it was when the correction began. That is what gold has accomplished. The extent of the move to follow this type of correction should be monumental and not soon forgotten. We should expect a historic rise in price. The rise in the price of gold should take the entire precious metals complex to unimagined heights not yet recognized.
Running flat


….continue reading this 10 page thorough reoport with larger charts HERE


-
I know Mike is a very solid investor and respect his opinions very much. So if he says pay attention to this or that - I will.
~ Dale G.
-
I've started managing my own investments so view Michael's site as a one-stop shop from which to get information and perspectives.
~ Dave E.
-
Michael offers easy reading, honest, common sense information that anyone can use in a practical manner.
~ der_al.
-
A sane voice in a scrambled investment world.
~ Ed R.
Inside Edge Pro Contributors

Greg Weldon

Josef Schachter

Tyler Bollhorn

Ryan Irvine

Paul Beattie

Martin Straith

Patrick Ceresna

Mark Leibovit

James Thorne

Victor Adair