
Stocks & Equities
Briefly: In our opinion, speculative short positions are favored (with stop-loss at 2,150 and profit target at 1,980, S&P 500 index)
Our intraday outlook is now bearish, and our short-term outlook is bearish:
Intraday outlook (next 24 hours): bearish
Short-term outlook (next 1-2 weeks): bearish
Medium-term outlook (next 1-3 months): neutral
Long-term outlook (next year): bullish
The U.S. stock market indexes were virtually flat on Wednesday, as investors continued to hesitate following last week’s rally. The S&P 500 index remains relatively close to its Tuesday’s all-time high of 2,101.30. The nearest important resistance level is at around 2,100. On the other hand, level of support is at 2,070-2,080, marked by some previous local highs, among others. There have been no confirmed negative signals so far. However, we can see overbought conditions accompanied by negative technical divergences:

Expectations before the opening of today’s trading session are virtually flat. The main European stock market indexes have been mixed so far. Investors will now wait for some economic data announcements: Initial Claims at 8:30 a.m., Philadelphia Fed, Leading Indicators at 10:00 a.m. The S&P 500 futures contract (CFD) extends its short-term consolidation, following last week’s move up. The nearest important resistance level remains at around 2,100. On the other hand, level of support is at 2,080-2,090, among others, as we can see on the 15-minute chart:

The technology Nasdaq 100 futures contract (CFD) follows a similar path, as it extends its short-term consolidation along the level of 4,390. The nearest important resistance level is at 4,400 and support level is at 4,350-4,370, among others, as the 15-minute chart shows:

Concluding, the broad stock market extended its short-term fluctuations on Wednesday, following last week’s rally. There have been no confirmed negative signals. However, we continue to maintain our speculative short position (2,099.16, S&P 500 index), as we expect a downward correction or an uptrend reversal. Stop-loss is at 2,150, and potential profit target is at 1,980. It is always important to set some exit price level in case some events cause the price to move in the unlikely direction. Having safety measures in place helps limit potential losses while letting the gains grow.
Thank you.

A lot of investors want to know why I am not screaming from the rooftops, “Buy Gold!”
The reason is simple: Gold has not bottomed yet, not by a long shot.
So why am I so confident gold has not bottomed (ditto for silver), especially when all is not well with the world?
After all, in addition to the Ukraine crisis, which is not over, tensions are rising dramatically all over the world.
My answer is simple: It’s not yet time for gold and silver to take off to the upside. Quite the contrary, they have more work to do on the downside.
Look, every market has its time and place in the sun. And every market has its false rallies. That’s why timing is so critically important.
The pause in gold and silver’s long-term
bull markets is not yet over
In contrast to important tops in any market, important bottoms take time to complete. That’s especially true with the precious metals.
Gold and silver have more backing and filling to do. They have lots of investors they still need to chew up and spit out. Especially the most recent buyers and pundits urging investors to buy.
 In fact, gold and silver will not bottom until most investors have turned outright bearish on them.
That’s one of the reasons why gold and silver took a nice nose-dive last week. It cast out recent buyers. And though there may be one or two more bounces higher — sucking in even more naïve analysts and investors …
Gold is destined to fall below $1,000 … and silver to near $12.50 in the months ahead.
Mining shares, even penny miners, will be sliced in half again.
Keep in mind that for a market to bottom, it must hit long-term support levels at the right time. When price and time converge together, then you have an important bottom.
We have none of that yet, in gold, silver, any precious metal, or the mining sector. And though yes, one or two more bounces higher can easily form, the most important thing for you to know right now is that a new sell signal is rapidly approaching.
You can see it here on this chart that I have for you.
A chart based on a composite of all the reliable cycles affecting gold’s trading. Over two billion computations of those cycles and what they say for the future of gold.

As you can clearly see, though one or two more small rallies remain possible, this model is showing a very strong timing sell signal for Feb. 26, just eight days from now.
And take a look at the decline it’s forecasting. It’s quite a whopper. A potential waterfall decline that would last into late May, where gold would have a chance to finally bottom, around the week of May 21.
Then there would be a bounce, and a sort of double-bottom formation heading into late June, before gold’s new bull market actually materializes.
The long-term bull market would then take back over.
But the bottom line is this: The bear market in the precious metals is not yet over, and anyone telling you that it is, either has a hidden agenda, or simply can’t see the writing on the wall (or both).
Ditto for mining shares, no matter how big or small they may be, no matter how cheap they may seem.
So what will drive gold into its final bottom?
It’s simple and it boils down to two chief reasons:
1. As I mentioned above, there are too many premature bulls in the market. They’re still trying to buy and get everyone else to buy, and that in itself is a sign gold has not bottomed.
Gold will bottom when the investors and analysts screaming “buy now” are bloodied.
2. Deflation is reigning supreme now. It’s almost everywhere. Blanketing Europe. Even some sectors in China and Asia. Even here in the U.S. And in virtually all commodity markets.
All this, despite the most massive money printing in the history of civilization!
So much for all that hyperinflation talk!
Best wishes,
Larry
– See more at: http://www.swingtradingdaily.com/2015/02/18/no-way-has-gold-bottomed/#sthash.ggRYF84u.dpuf

Strengths
- The market for gold coins and bars in Europe is now twice as large as that of the United States, and similarly on par with those of China and India. In addition, the India Trade Ministry is said to be seeking to cut the gold import tax from 10 percent to 2 percent.
- With new global mined gold supply averaging around 258 tonnes per month, and with 255 tonnes of gold withdrawals from the Shanghai Gold Exchange in January, China is effectively consuming all of the world’s new mined supply.
- In 2014 governments added 477.2 metric tonnes to their reserves, the second-biggest increase in 50 years and 17 percent more than the previous year. Furthermore, central banks have added to gold reserves for the past five years, representing a reversal from two decades of selling. For investors considering adding bullion to their portfolio, gold just triggered this long-term buy signal (only the fourth one to show up in the past 10 years as illustrated by the technical chart shown below). The prior signals have come in 2005, 2007 and 2009, and each time gold rallied thereafter.

Weaknesses
- Gold traders are bearish for the first time in three months on concerns about a stronger dollar and weakening demand from China’s slowing economy.
- Two people remained missing after Mexican police freed 10 others who were kidnapped last Friday. The incident happened in the same southern region where the disappearance and murder of 43 students in September ignited protests throughout the country. One of the people missing is a worker from Torex Gold Resources. B2Gold Corp announced the overnight shooting death on Wednesday of two security guards at the Masbate Gold Mine operating in the Philippines.
- Greece’s new left-wing government announced it will legally oppose a Canadian-run gold mine in northern Greece belonging to Eldorado Gold Corp. on the grounds of worker protections.
Opportunities
- The merger and acquisition (M&A) space seems to be heating up in the gold mining industry. Tahoe Resources announced on Monday it will acquire Rio Alto Mining for $1.1 billion. Mark Bristow, CEO of Randgold Resources, said the company has been “flat-out besieged with offers to buy assets.” Acacia Mining said it’s looking to do a transformational deal this year. Lastly, AngloGold Ashanti’s CEO said he is looking to sell assets or form joint ventures to reduce debt.
- There is growing consensus in the market that an unspoken currency war has broken out. This is a result of many countries facing zero interest rates and binding fiscal constraints. With such constraints, the only policy tool at their disposal to stimulate growth is targeting a weaker exchange rate. While a weak currency might provide a short-term boost to the countries engaging in currency devaluation, the fact that so many countries are concurrently engaging in these tactics will likely mean we may end up with higher foreign-exchange volatility. In such a scenario, gold is increasingly looked upon as the currency of choice.

- U.S. retail sales tumbled 0.8 percent in January despite the “great” jobs report and sharply lower gasoline prices. Furthermore, U.S. corporate profits and sales are crumbling with companies in sectors such as technology, telecommunications, consumer discretionary and staples all seeing sharp earnings per share (EPS) slowdowns as a result of the strong dollar. Lastly, Credit Suisse recommended underweighting U.S. equities as they have slipped on both economic and earnings-momentum scorecards. A weakening of the U.S. market would provide a catalyst for gold.
Threats
- In its 2015 outlook report, JPMorgan Chase said that a strengthening U.S. dollar, weaker energy prices and low inflation will dampen gold demand.
- President Zuma of South Africa announced in his State of the Nation address that foreign nationals will be barred from owning land in the country, only allowing them to enter into long-term lease contracts. Furthermore, last month Zuma referred the Mineral and Petroleum Resources Development Act Amendment Bill back to parliament for reconsideration.
- South Africa’s mining industry remains a highly complex space where aligning competing interests has proved difficult. Mining companies, labor and government seem to have very different opinions on how things should be done, leading to instability. Justin Froneman, director of equity research at Credit Suisse, said that international investors want active leadership at both the corporate and country level in order to reduce uncertainty.

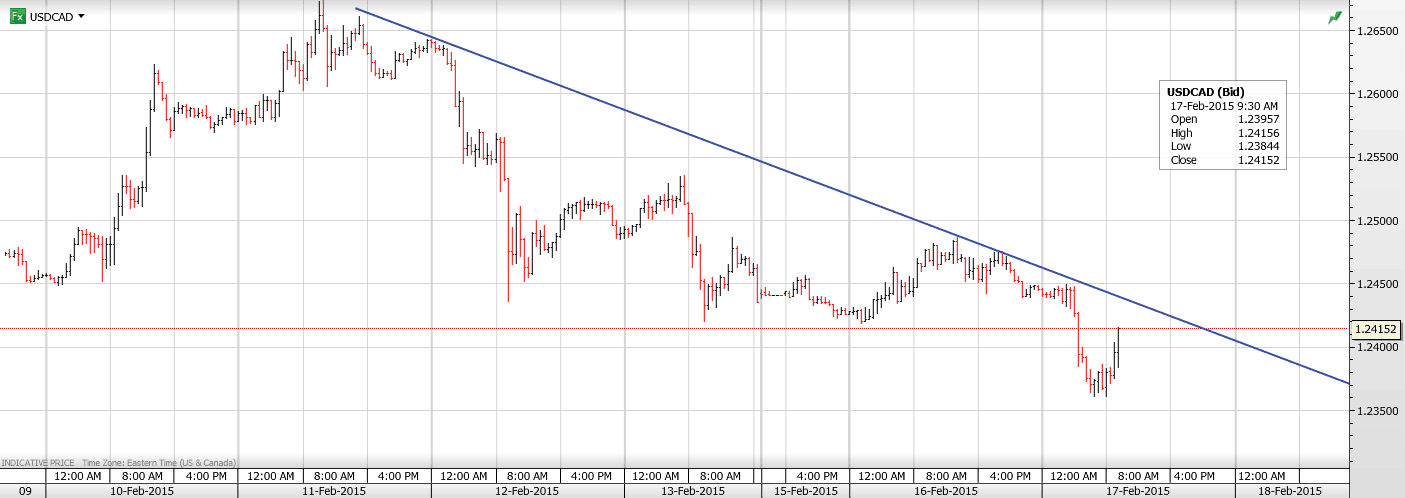
USDCAD Overnight Range 1.2366-1.2470
Rising oil prices in a market well long USDCAD put the Loonie on the griddle. After spending Monday in a 1.2420-80 range,USDCAD fell through support at 1.2420, triggering stops at 1.2380 and touched 1.2366. Oil rallied on the risk of supply disruptions due to Egypt’s bombing of ISIS targets in Libya. USDCAD is off the lows in early New York trading as WTI gives ups some gains.
EURUSD shrugged off news that the Greek negotiations were still on-going but enjoyed the better than expected German ZEW index gain.EURUSD recouped all of Monday’s losses and then some. The RBA minutes didn’t provide any additional guidance as to future rate moves and AUDUSD ticked higher.
There isn’t any data of note today leaving oil price movements and Greek debt headlines to provide trading direction.
USDCAD technical Outlook
The intraday USDCAD technicals are bearish while trading below 1.2440 supported by the break of support at 1.2415.Failure to climb above 1.2390 risks another probe of support in the 1.2340-60 area. The line in the sand is 1.2320. A break here would lead to 1.2050 in a hurry. A rally above 1.2440 negates the downtrend and argues for further gains to 1.2550.
Today’s Range 1.2360-1.2440

In This Week’s Issue:
In This Week’s Issue:
– Stockscores Active Trader Webinar – Tuesday Feb 17 6pm PT, 9pm ET
– Stockscores’ Market Minutes Video – How Resistance Works
– Stockscores Trader Training – Information Pitfalls
– Stock Features of the Week – Flag Breaks on the Weekly
Stockscores Active Trader Webinar
Tuesday Feb 17 6pm PT, 9pm ET
Learn how the Stockscores Approach works for day and swing trading with this free, one hour webinar.
Click here to register
Stockscores Market Minutes Video – How Resistance Works
How price action behaves around resistance helps to determine whether a trend will evolve out of a breakout through resistance. This week, I explain how this works plus provide my analysis of the markets for the week ahead.Click here to watch
Trader Training – Information Pitfalls
In theory, information should make the stock market’s world go round. Information about companies and their ability to make money in the future is what should determine share price. As the market learns of new information, price is adjusted up and down to reflect the value of that information.
This implies that investors should focus their analysis on information so they can predict where share prices should go in the future.
While this makes good sense, I have found it to be extremely rare that investors who use information are able to consistently beat the stock market. With smaller retail investors (you and I) in particular, the use of information for making investing decisions is more destructive than it is beneficial. Here are ten reasons why:
1. Information is Usually Already Priced In – most investors use publicly available information. That means it is widely known and available to anyone considering the stock. If information is available to a large number of investors then we should expect that the market will have priced that information in to the stock. Therefore, the information has not value to us.
2. Information Usually Comes with a Bias – as a general rule, people do what they are financially motivated to do. If someone is encouraging you to purchase a stock, there is a good chance that they have some financial motivation to do so. Before you trust the information you receive, understand the financial motivation. If you find the reason, you will often usually find that there is a strong bias in the information being provided to you.
3. Trading on Truly Insider Information is Illegal – there are few risk free trades in the stock market, but trading on significant, inside information is one. You stand to make a lot of money buying stock in a company that will be acquired by another at a premium tomorrow. If you have that information and act on it, you are trading on inside information and that can land you in jail.
4. Gathering Good Private Information is Expensive and Time Consuming – there are investors who are able to uncover information that is not priced in to a stock but is not considered inside information. This private information is valuable because it can lead to market beating returns. However, gathering private information typically requires significant resources, knowledge and time. For small investors, it is not feasible to do this kind of work across a broad range of stocks.
5. Information Causes You to Ignore the Market’s Message – when you have an understanding of a company’s story, there is a tendency to fall in love with that story and ignore new information that goes against your outlook for the stock. This leads the committed shareholder to hang on to a losing position, allowing the loser to bog down the performance of the overall portfolio.
6. You May Not Have All of the Information You Need – the market tends to focus on two or three key information points that affect the price investors are willing to pay for it. An investor who does a thorough fundamental analysis of the stock may still have an incomplete understanding of the company’s business. If missing one of the key points, this investor can make a gross error in valuing the stock.
7. The Market May Not Be Trading On Fundamentals – in theory, stock price is based on the present value of future earnings expectations. In practice, there are often very non fundamental influences on share price. A large investor that has a liquidity crisis may be forced to unload a large position with little regard for price. Often, the laws of supply and demand affect share price even though theory tells us that they should not have an influence.
8. Your Interpretation May Not Be the Same as The Market’s – Our mood affects how we judge information and the same can be said for the market in general. Your fundamental analysis may be correct in an optimistic environment, but if the market is in a pessimistic mood, the investment can lead to losses. Even the market is wrong, it is right.
9. There Is No Standard for What Information is Worth – There are many formulas for determining what a company’s share price should. Many fundamental analysts look for stocks to trade at a certain multiple of their earnings with that multiple to be based on growth. However, there are great variations in accounting methods that can have a profound effect on how earnings are reported. More importantly, there is no rule that a company should trade at a certain multiple of earnings, that target multiple is just an opinion.
10. We Tend to Focus On Information That is Easy to Get – we often looks for the easiest way to achieve a goal. With information, there is a tendency to focus on the information that is front of us. Rather than work to find something to disprove our thesis on a stock, we instead look for information to strengthen our thesis. In doing so, we present our own biased outlook for our investment decisions that can often be very incomplete and wrong.
Ultimately, I look at the market’s interpretation of all available information when I look at a chart of price and volume. It shows not only every bit of information detail but also what the market thinks of it.
![]()
This week I ran the Stockscores Simple Weekly Market Scan but I went in search of flag pattern breaks. A flag pattern is an uptrend continuation pattern where there is a break higher after a short pull back. It allows for risk management at the low of the pull back and has a high probability of success because there is strong momentum in the chart. I day trade these patterns daily but they are also worth considering on the longer term weekly chart.
Here are two stocks in strong upward trends that made flag breaks last week:
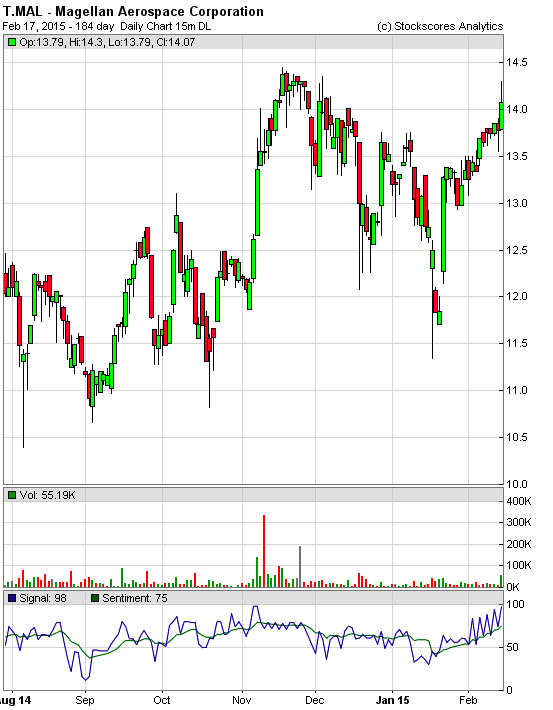
1. T.MAL
T.MAL moved up well over the past week and has defined support at $12.90. It may stall at the old highs of $14.40 but the long term trend is strong and up.
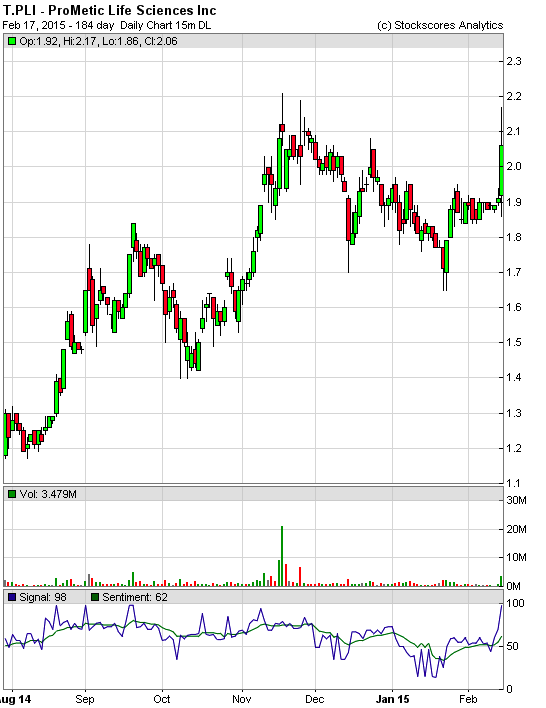
2. T.PLI
T.PLI made a strong break on Friday but was halted before the close. The long term chart is showing a good flag break but wait to see how it opens after it resumes trading, a big gap up could hinder the reward for risk of the trade. Support at $1.82.
References
- Get the Stockscore on any of over 20,000 North American stocks.
- Background on the theories used by Stockscores.
- Strategies that can help you find new opportunities.
- Scan the market using extensive filter criteria.
- Build a portfolio of stocks and view a slide show of their charts.
- See which sectors are leading the market, and their components.
Disclaimer
This is not an investment advisory, and should not be used to make investment decisions. Information in Stockscores Perspectives is often opinionated and should be considered for information purposes only. No stock exchange anywhere has approved or disapproved of the information contained herein. There is no express or implied solicitation to buy or sell securities. The writers and editors of Perspectives may have positions in the stocks discussed above and may trade in the stocks mentioned. Don’t consider buying or selling any stock without conducting your own due diligenc


-
I know Mike is a very solid investor and respect his opinions very much. So if he says pay attention to this or that - I will.
~ Dale G.
-
I've started managing my own investments so view Michael's site as a one-stop shop from which to get information and perspectives.
~ Dave E.
-
Michael offers easy reading, honest, common sense information that anyone can use in a practical manner.
~ der_al.
-
A sane voice in a scrambled investment world.
~ Ed R.
Inside Edge Pro Contributors

Greg Weldon

Josef Schachter

Tyler Bollhorn

Ryan Irvine

Paul Beattie

Martin Straith

Patrick Ceresna

Mark Leibovit

James Thorne

Victor Adair